4.15 MB - Food Security Clusters
4.15 MB - Food Security Clusters
4.15 MB - Food Security Clusters
- No tags were found...

Create successful ePaper yourself
Turn your PDF publications into a flip-book with our unique Google optimized e-Paper software.
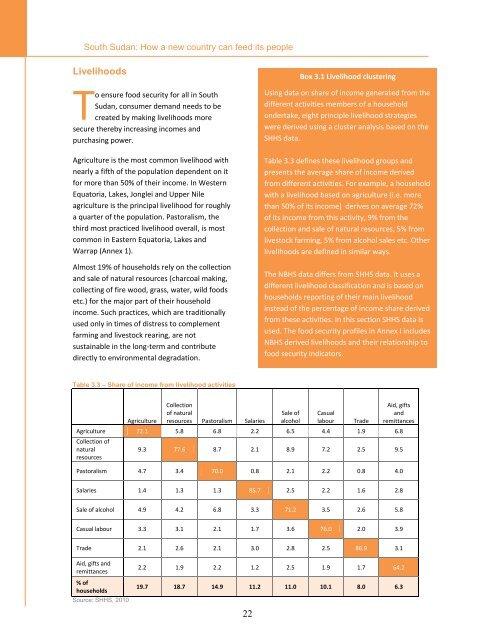
South Sudan: How a new country can feed its peopleLivelihoodsTo ensure food security for all in SouthSudan, consumer demand needs to becreated by making livelihoods moresecure thereby increasing incomes andpurchasing power.Agriculture is the most common livelihood withnearly a fifth of the population dependent on itfor more than 50% of their income. In WesternEquatoria, Lakes, Jonglei and Upper Nileagriculture is the principal livelihood for roughlya quarter of the population. Pastoralism, thethird most practiced livelihood overall, is mostcommon in Eastern Equatoria, Lakes andWarrap (Annex 1).Almost 19% of households rely on the collectionand sale of natural resources (charcoal making,collecting of fire wood, grass, water, wild foodsetc.) for the major part of their householdincome. Such practices, which are traditionallyused only in times of distress to complementfarming and livestock rearing, are notsustainable in the long-term and contributedirectly to environmental degradation.Box 3.1 Livelihood clusteringUsing data on share of income generated from thedifferent activities members of a householdundertake, eight principle livelihood strategieswere derived using a cluster analysis based on theSHHS data.Table 3.3 defines these livelihood groups andpresents the average share of income derivedfrom different activities. For example, a householdwith a livelihood based on agriculture (i.e. morethan 50% of its income) derives on average 72%of its income from this activity, 9% from thecollection and sale of natural resources, 5% fromlivestock farming, 5% from alcohol sales etc. Otherlivelihoods are defined in similar ways.The NBHS data differs from SHHS data. It uses adifferent livelihood classification and is based onhouseholds reporting of their main livelihoodinstead of the percentage of income share derivedfrom these activities. In this section SHHS data isused. The food security profiles in Annex I includesNBHS derived livelihoods and their relationship tofood security indicators.Table 3.3 – Share of income from livelihood activitiesAgricultureCollectionof naturalresources Pastoralism SalariesSale ofalcoholCasuallabourTradeAid, giftsandremittancesAgriculture 72.1 5.8 6.8 2.2 6.5 4.4 1.9 6.8Collection ofnaturalresources9.3 77.6 8.7 2.1 8.9 7.2 2.5 9.5Pastoralism 4.7 3.4 70.0 0.8 2.1 2.2 0.8 4.0Salaries 1.4 1.3 1.3 85.7 2.5 2.2 1.6 2.8Sale of alcohol 4.9 4.2 6.8 3.3 71.2 3.5 2.6 5.8Casual labour 3.3 3.1 2.1 1.7 3.6 76.0 2.0 3.9Trade 2.1 2.6 2.1 3.0 2.8 2.5 86.9 3.1Aid, gifts andremittances% ofhouseholdsSource: SHHS, 20102.2 1.9 2.2 1.2 2.5 1.9 1.7 64.219.7 18.7 14.9 11.2 11.0 10.1 8.0 6.322