4.15 MB - Food Security Clusters
4.15 MB - Food Security Clusters
4.15 MB - Food Security Clusters
- No tags were found...

Create successful ePaper yourself
Turn your PDF publications into a flip-book with our unique Google optimized e-Paper software.
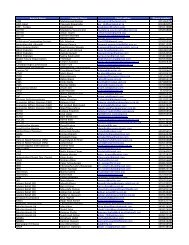
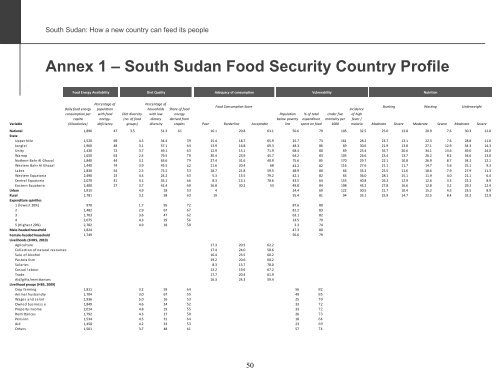
South Sudan: How a new country can feed its peopleAnnex 1 – South Sudan <strong>Food</strong> <strong>Security</strong> Country Profile<strong>Food</strong> <strong>Security</strong> Profile for South Sudan (2010)<strong>Food</strong> Energy AvailabilityDiet QualityAdequacy of consumptionVulnerabilityNutritionVariableDaily food energyconsumption percapita(kilocalories)Percentage ofpopulationwith foodenergydeficiencyDiet diversity(no. of foodgroups)Percentage ofhouseholdswith lowdietarydiversityShare of foodenergyderived fromstaples<strong>Food</strong> Consumption ScoreIncidenceStunting Wasting UnderweightPopulation % of total Under five of highbelow poverty expenditure mortality per fever /Poor Borderline Acceptable line spent on food 1000 malaria Moderate Severe Moderate Severe Moderate SevereNational 1,890 47 3.5 51.3 61 16.1 20.8 63.1 50.6 79 105 32.5 25.0 13.8 20.9 7.6 30.3 12.0StateUpper Nile 1,520 69 4.5 34.4 39 15.4 18.7 65.9 25.7 73 161 28.2 23.7 13.1 22.3 7.6 28.8 11.0Jonglei 1,960 48 3.1 57.1 64 13.9 16.8 69.3 48.3 86 69 30.6 21.9 13.8 27.1 12.9 34.3 14.3Unity 1,430 72 3.7 49.1 63 12.9 15.1 71.9 68.4 80 69 25.4 35.7 20.6 34.1 13.6 49.0 24.0Warrap 1,650 63 2.4 79.5 70 30.4 23.9 45.7 64.2 83 105 26.6 23.4 13.7 26.2 8.2 34.6 13.0Nothern Bahr Al Ghazal 1,840 44 3.1 63.6 79 27.4 31.6 40.9 75.6 85 170 29.7 22.1 10.8 26.9 8.7 34.2 12.1Western Bahr Al Ghazal 1,440 74 3.9 45.5 42 11.6 20.4 68 43.2 82 116 27.6 21.1 11.7 14.7 5.6 25.1 9.3Lakes 1,830 54 2.5 73.2 53 18.7 21.8 59.5 48.9 80 66 33.2 25.5 11.6 18.6 7.9 27.9 11.3Western Equatoria 2,490 23 4.4 24.2 63 5.3 15.5 79.2 42.1 82 65 36.0 28.1 15.1 11.9 4.0 21.1 6.4Central Equatoria 2,070 41 4.1 35.1 66 8.3 13.1 78.6 43.5 64 153 40.8 26.2 12.9 12.6 3.5 22.1 8.9Eastern Equatoria 2,400 27 3.7 41.4 60 16.8 30.2 53 49.8 84 198 45.2 27.8 16.6 12.8 3.2 29.2 12.4Urban 1,915 4.9 18 53 4 24.4 69 122 30.5 21.7 10.4 15.2 4.5 23.5 8.9Rural 1,781 3.2 58 63 19 55.4 81 94 33.1 25.9 14.7 22.5 8.4 32.2 12.9Expenditure quintiles1 (lowest 20%) 970 1.7 95 72 87.6 802 1,482 2.9 67 67 81.2 833 1,703 3.6 47 62 63.1 824 2,075 4.3 29 56 14.5 795 (Highest 20%) 2,782 4.9 18 50 3.3 74Male-headed household 1,824 47.3 80Female-headed household 1,749 56.6 79Livelihoods (SHHS, 2010)Agriculture 17.3 20.5 62.2Collection of natural resources 17.4 24.0 58.6Sale of Alcohol 16.4 23.5 60.2Pastoralism 19.2 20.6 60.2Salaries 8.3 13.7 78.0Casual labour 13.2 19.6 67.2Trade 17.7 20.4 61.9Aid/gifts/remittances 16.3 24.3 59.4Livelihood groups (HBS, 2009)Crop farming 1,811 3.2 59 64 56 82Animal husbandry 1,704 3.0 67 55 49 85Wages and salari 1,936 5.0 16 53 25 70Owned business e 1,849 4.6 24 52 33 72Property income 2,014 4.8 19 55 33 72Remittances 1,792 4.3 27 50 26 73Pension 1,534 4.5 31 64 18 64Aid 1,458 4.2 33 53 23 69Others 1,501 3.7 48 61 57 7450