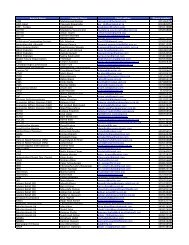
4.15 MB - Food Security Clusters
4.15 MB - Food Security Clusters
4.15 MB - Food Security Clusters
- No tags were found...

You also want an ePaper? Increase the reach of your titles
YUMPU automatically turns print PDFs into web optimized ePapers that Google loves.
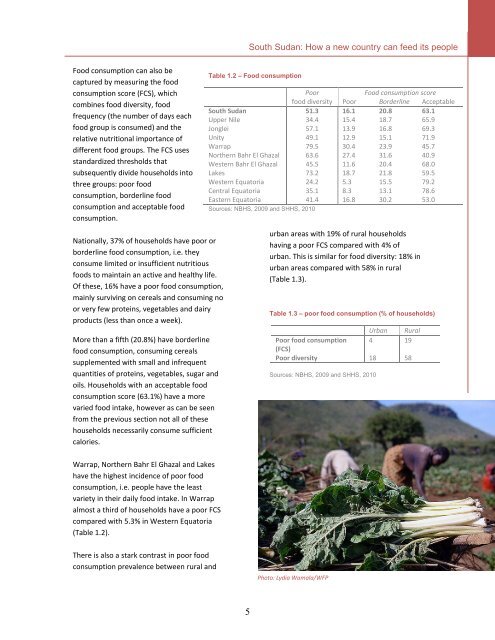
South Sudan: How a new country can feed its people<strong>Food</strong> consumption can also becaptured by measuring the foodconsumption score (FCS), whichcombines food diversity, foodfrequency (the number of days eachfood group is consumed) and therelative nutritional importance ofdifferent food groups. The FCS usesstandardized thresholds thatsubsequently divide households intothree groups: poor foodconsumption, borderline foodconsumption and acceptable foodconsumption.Table 1.2 – <strong>Food</strong> consumptionPoor<strong>Food</strong> consumption scorefood diversity Poor Borderline AcceptableSouth Sudan 51.3 16.1 20.8 63.1Upper Nile 34.4 15.4 18.7 65.9Jonglei 57.1 13.9 16.8 69.3Unity 49.1 12.9 15.1 71.9Warrap 79.5 30.4 23.9 45.7Northern Bahr El Ghazal 63.6 27.4 31.6 40.9Western Bahr El Ghazal 45.5 11.6 20.4 68.0Lakes 73.2 18.7 21.8 59.5Western Equatoria 24.2 5.3 15.5 79.2Central Equatoria 35.1 8.3 13.1 78.6Eastern Equatoria 41.4 16.8 30.2 53.0Sources: NBHS, 2009 and SHHS, 2010Nationally, 37% of households have poor orborderline food consumption, i.e. theyconsume limited or insufficient nutritiousfoods to maintain an active and healthy life.Of these, 16% have a poor food consumption,mainly surviving on cereals and consuming noor very few proteins, vegetables and dairyproducts (less than once a week).More than a fifth (20.8%) have borderlinefood consumption, consuming cerealssupplemented with small and infrequentquantities of proteins, vegetables, sugar andoils. Households with an acceptable foodconsumption score (63.1%) have a morevaried food intake, however as can be seenfrom the previous section not all of thesehouseholds necessarily consume sufficientcalories.urban areas with 19% of rural householdshaving a poor FCS compared with 4% ofurban. This is similar for food diversity: 18% inurban areas compared with 58% in rural(Table 1.3).Table 1.3 – poor food consumption (% of households)Urban RuralPoor food consumption 4 19(FCS)Poor diversity 18 58Sources: NBHS, 2009 and SHHS, 2010Warrap, Northern Bahr El Ghazal and Lakeshave the highest incidence of poor foodconsumption, i.e. people have the leastvariety in their daily food intake. In Warrapalmost a third of households have a poor FCScompared with 5.3% in Western Equatoria(Table 1.2).There is also a stark contrast in poor foodconsumption prevalence between rural andPhoto: Lydia Wamala/WFP5