4.15 MB - Food Security Clusters
4.15 MB - Food Security Clusters
4.15 MB - Food Security Clusters
- No tags were found...

Create successful ePaper yourself
Turn your PDF publications into a flip-book with our unique Google optimized e-Paper software.
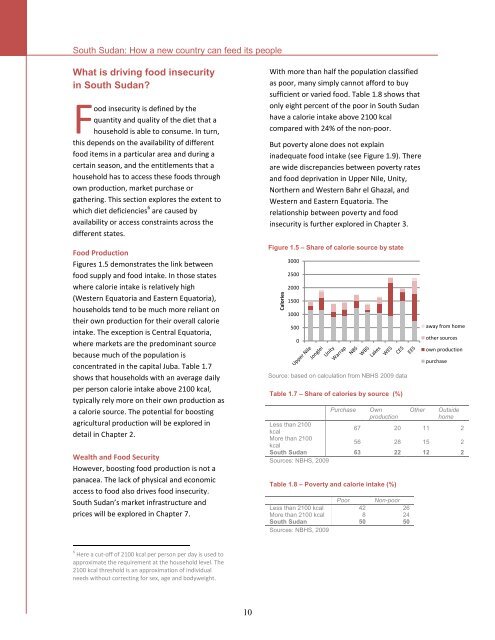
CaloriesSouth Sudan: How a new country can feed its peopleWhat is driving food insecurityin South Sudan?<strong>Food</strong> insecurity is defined by thequantity and quality of the diet that ahousehold is able to consume. In turn,this depends on the availability of differentfood items in a particular area and during acertain season, and the entitlements that ahousehold has to access these foods throughown production, market purchase orgathering. This section explores the extent towhich diet deficiencies 6 are caused byavailability or access constraints across thedifferent states.<strong>Food</strong> ProductionFigures 1.5 demonstrates the link betweenfood supply and food intake. In those stateswhere calorie intake is relatively high(Western Equatoria and Eastern Equatoria),households tend to be much more reliant ontheir own production for their overall calorieintake. The exception is Central Equatoria,where markets are the predominant sourcebecause much of the population isconcentrated in the capital Juba. Table 1.7shows that households with an average dailyper person calorie intake above 2100 kcal,typically rely more on their own production asa calorie source. The potential for boostingagricultural production will be explored indetail in Chapter 2.Wealth and <strong>Food</strong> <strong>Security</strong>However, boosting food production is not apanacea. The lack of physical and economicaccess to food also drives food insecurity.South Sudan’s market infrastructure andprices will be explored in Chapter 7.With more than half the population classifiedas poor, many simply cannot afford to buysufficient or varied food. Table 1.8 shows thatonly eight percent of the poor in South Sudanhave a calorie intake above 2100 kcalcompared with 24% of the non-poor.But poverty alone does not explaininadequate food intake (see Figure 1.9). Thereare wide discrepancies between poverty ratesand food deprivation in Upper Nile, Unity,Northern and Western Bahr el Ghazal, andWestern and Eastern Equatoria. Therelationship between poverty and foodinsecurity is further explored in Chapter 3.Figure 1.5 – Share of calorie source by state300025002000150010005000Source: based on calculation from NBHS 2009 dataTable 1.7 – Share of calories by source (%)Table 1.8 – Poverty and calorie intake (%)Poor Non-poorLess than 2100 kcal 42 26More than 2100 kcal 8 24South Sudan 50 50Sources: NBHS, 2009away from homeother sourcesown productionpurchasePurchase Own Other OutsideproductionhomeLess than 2100kcal67 20 11 2More than 2100kcal56 28 15 2South Sudan 63 22 12 2Sources: NBHS, 20096 Here a cut-off of 2100 kcal per person per day is used toapproximate the requirement at the household level. The2100 kcal threshold is an approximation of individualneeds without correcting for sex, age and bodyweight.10