Statistics 1 Revision Notes - Mr Barton Maths
Statistics 1 Revision Notes - Mr Barton Maths
Statistics 1 Revision Notes - Mr Barton Maths

Create successful ePaper yourself
Turn your PDF publications into a flip-book with our unique Google optimized e-Paper software.
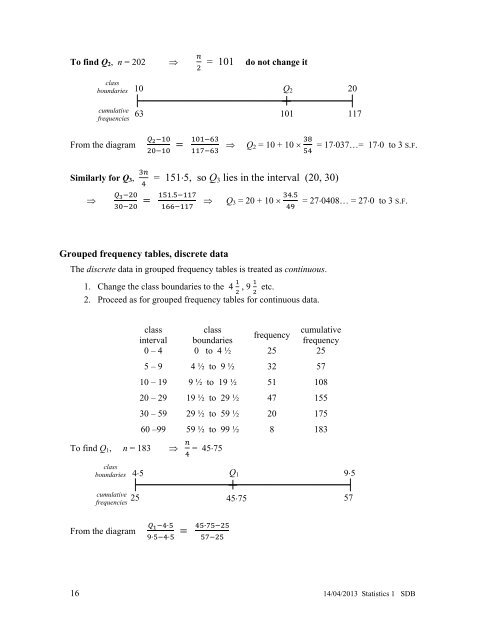
To find Q 2 , n = 202<br />
⇒<br />
<br />
<br />
= 101 do not change it<br />
class<br />
boundaries<br />
cumulative<br />
frequencies<br />
10 Q 2 20<br />
63 101 117<br />
From the diagram<br />
<br />
<br />
<br />
⇒ Q 2 = 10 + 10 × <br />
<br />
= 17⋅037…= 17⋅0 to 3 S.F.<br />
Similarly for Q 3 , = 151⋅5, so Q 3 lies in the interval (20, 30)<br />
⇒<br />
<br />
<br />
.<br />
<br />
⇒<br />
Q 3 = 20 + 10 × .<br />
<br />
= 27⋅0408… = 27⋅0 to 3 S.F.<br />
Grouped frequency tables, discrete data<br />
The discrete data in grouped frequency tables is treated as continuous.<br />
1. Change the class boundaries to the 4 , 9 etc.<br />
2. Proceed as for grouped frequency tables for continuous data.<br />
class class<br />
cumulative<br />
frequency<br />
interval boundaries<br />
frequency<br />
0 – 4 0 to 4 ½ 25 25<br />
5 – 9 4 ½ to 9 ½ 32 57<br />
10 – 19 9 ½ to 19 ½ 51 108<br />
20 – 29 19 ½ to 29 ½ 47 155<br />
30 – 59 29 ½ to 59 ½ 20 175<br />
60 –99 59 ½ to 99 ½ 8 183<br />
To find Q 1 , n = 183 ⇒ = 45⋅75<br />
class<br />
boundaries<br />
4⋅5 Q 1 9⋅5<br />
cumulative<br />
frequencies<br />
25 45⋅75 57<br />
From the diagram<br />
<br />
<br />
·<br />
<br />
16 14/04/2013 <strong>Statistics</strong> 1 SDB