Annual Report 2011 - 2012 - United Breweries Limited
Annual Report 2011 - 2012 - United Breweries Limited
Annual Report 2011 - 2012 - United Breweries Limited

Create successful ePaper yourself
Turn your PDF publications into a flip-book with our unique Google optimized e-Paper software.
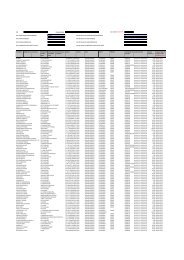
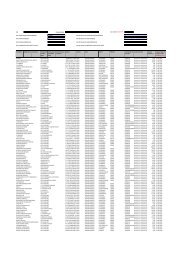
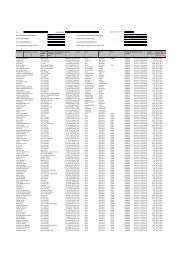
Consolidated Cash Flow Statement for the year ended March 31, <strong>2012</strong><br />
A Cash flow from operating activities<br />
(All amounts in Rs.lacs, unless otherwise stated)<br />
Year ended<br />
March 31, <strong>2012</strong> March 31, <strong>2011</strong><br />
Profit before taxation 21,815 22,658<br />
Adjustments for:<br />
Depreciation and amortisation 14,889 13,081<br />
(Profit)/Loss on sale of assets (1) (2)<br />
Provision for doubtful debts 49 317<br />
Provision for doubtful advances 64 17<br />
Provision for dimunition in investments 1,959 —<br />
Bad debts written off 954 9<br />
Bad advances written off 980 —<br />
Provision for doubtful debts no longer required written back (1,290) (9)<br />
Provision for doubtful advances no longer required written back (998) (513)<br />
Interest expenses (Net) 9,850 7,793<br />
Interest income (3,304) (3,166)<br />
Exchange Loss / (Gains) on foreign currency loans 40 —<br />
Dividend income (19) 23,173 (42) 17,485<br />
Operating profits before working capital changes 44,988 40,143<br />
Adjustment for working capital changes:<br />
(Increase) / Decrease in Trade Receivables (17,171) 15,266<br />
(Increase) / Decrease in inventories (10,741) (6,944)<br />
Increase / (Decrease) in current liabilities and provisions 27,724 15,146<br />
(Increase) / Decrease in other current assets, loans and<br />
advances<br />
(2,918) (3,106) (1,337) 22,131<br />
Cash generated from operations 41,882 62,274<br />
Direct taxes (Income Tax and Fringe Benefit Tax) paid<br />
(6,588) (5,161)<br />
(including TDS)<br />
Cash generated from operations before<br />
35,294 57,113<br />
non-recurring items<br />
Non-recurring items — —<br />
Net cash generated from operating activities 35,294 57,113<br />
B Cash flow from investing activities<br />
Purchase of fixed assets (including acquisition on<br />
amalgamation)<br />
(38,141) (44,010)<br />
Sale of fixed assets 79 124<br />
(Purchase) / Sale of investments (2) 4,899<br />
Interest income 3,538 87<br />
Dividend income 19 42<br />
Net cash used in investing activities (34,507) (38,858)<br />
70