atlas of urban vulnerability in spain: methodology and contents
atlas of urban vulnerability in spain: methodology and contents
atlas of urban vulnerability in spain: methodology and contents

Create successful ePaper yourself
Turn your PDF publications into a flip-book with our unique Google optimized e-Paper software.
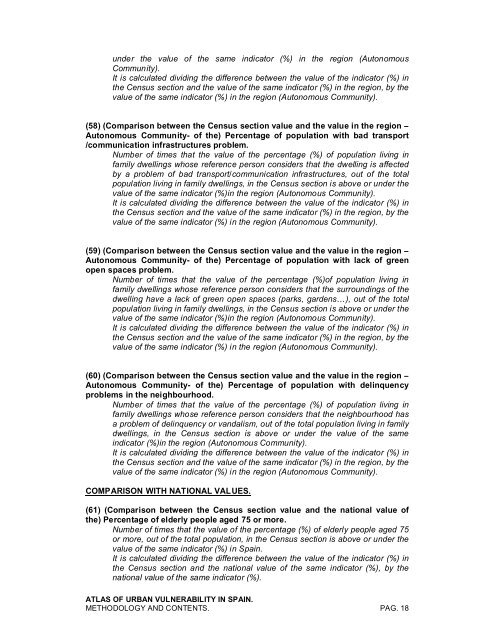
under the value <strong>of</strong> the same <strong>in</strong>dicator (%) <strong>in</strong> the region (Autonomous<br />
Community).<br />
It is calculated divid<strong>in</strong>g the difference between the value <strong>of</strong> the <strong>in</strong>dicator (%) <strong>in</strong><br />
the Census section <strong>and</strong> the value <strong>of</strong> the same <strong>in</strong>dicator (%) <strong>in</strong> the region, by the<br />
value <strong>of</strong> the same <strong>in</strong>dicator (%) <strong>in</strong> the region (Autonomous Community).<br />
(58) (Comparison between the Census section value <strong>and</strong> the value <strong>in</strong> the region <br />
Autonomous Community- <strong>of</strong> the) Percentage <strong>of</strong> population with bad transport<br />
/communication <strong>in</strong>frastructures problem.<br />
Number <strong>of</strong> times that the value <strong>of</strong> the percentage (%) <strong>of</strong> population liv<strong>in</strong>g <strong>in</strong><br />
family dwell<strong>in</strong>gs whose reference person considers that the dwell<strong>in</strong>g is affected<br />
by a problem <strong>of</strong> bad transport/communication <strong>in</strong>frastructures, out <strong>of</strong> the total<br />
population liv<strong>in</strong>g <strong>in</strong> family dwell<strong>in</strong>gs, <strong>in</strong> the Census section is above or under the<br />
value <strong>of</strong> the same <strong>in</strong>dicator (%)<strong>in</strong> the region (Autonomous Community).<br />
It is calculated divid<strong>in</strong>g the difference between the value <strong>of</strong> the <strong>in</strong>dicator (%) <strong>in</strong><br />
the Census section <strong>and</strong> the value <strong>of</strong> the same <strong>in</strong>dicator (%) <strong>in</strong> the region, by the<br />
value <strong>of</strong> the same <strong>in</strong>dicator (%) <strong>in</strong> the region (Autonomous Community).<br />
(59) (Comparison between the Census section value <strong>and</strong> the value <strong>in</strong> the region <br />
Autonomous Community- <strong>of</strong> the) Percentage <strong>of</strong> population with lack <strong>of</strong> green<br />
open spaces problem.<br />
Number <strong>of</strong> times that the value <strong>of</strong> the percentage (%)<strong>of</strong> population liv<strong>in</strong>g <strong>in</strong><br />
family dwell<strong>in</strong>gs whose reference person considers that the surround<strong>in</strong>gs <strong>of</strong> the<br />
dwell<strong>in</strong>g have a lack <strong>of</strong> green open spaces (parks, gardens), out <strong>of</strong> the total<br />
population liv<strong>in</strong>g <strong>in</strong> family dwell<strong>in</strong>gs, <strong>in</strong> the Census section is above or under the<br />
value <strong>of</strong> the same <strong>in</strong>dicator (%)<strong>in</strong> the region (Autonomous Community).<br />
It is calculated divid<strong>in</strong>g the difference between the value <strong>of</strong> the <strong>in</strong>dicator (%) <strong>in</strong><br />
the Census section <strong>and</strong> the value <strong>of</strong> the same <strong>in</strong>dicator (%) <strong>in</strong> the region, by the<br />
value <strong>of</strong> the same <strong>in</strong>dicator (%) <strong>in</strong> the region (Autonomous Community).<br />
(60) (Comparison between the Census section value <strong>and</strong> the value <strong>in</strong> the region <br />
Autonomous Community- <strong>of</strong> the) Percentage <strong>of</strong> population with del<strong>in</strong>quency<br />
problems <strong>in</strong> the neighbourhood.<br />
Number <strong>of</strong> times that the value <strong>of</strong> the percentage (%) <strong>of</strong> population liv<strong>in</strong>g <strong>in</strong><br />
family dwell<strong>in</strong>gs whose reference person considers that the neighbourhood has<br />
a problem <strong>of</strong> del<strong>in</strong>quency or v<strong>and</strong>alism, out <strong>of</strong> the total population liv<strong>in</strong>g <strong>in</strong> family<br />
dwell<strong>in</strong>gs, <strong>in</strong> the Census section is above or under the value <strong>of</strong> the same<br />
<strong>in</strong>dicator (%)<strong>in</strong> the region (Autonomous Community).<br />
It is calculated divid<strong>in</strong>g the difference between the value <strong>of</strong> the <strong>in</strong>dicator (%) <strong>in</strong><br />
the Census section <strong>and</strong> the value <strong>of</strong> the same <strong>in</strong>dicator (%) <strong>in</strong> the region, by the<br />
value <strong>of</strong> the same <strong>in</strong>dicator (%) <strong>in</strong> the region (Autonomous Community).<br />
COMPARISON WITH NATIONAL VALUES.<br />
(61) (Comparison between the Census section value <strong>and</strong> the national value <strong>of</strong><br />
the) Percentage <strong>of</strong> elderly people aged 75 or more.<br />
Number <strong>of</strong> times that the value <strong>of</strong> the percentage (%) <strong>of</strong> elderly people aged 75<br />
or more, out <strong>of</strong> the total population, <strong>in</strong> the Census section is above or under the<br />
value <strong>of</strong> the same <strong>in</strong>dicator (%) <strong>in</strong> Spa<strong>in</strong>.<br />
It is calculated divid<strong>in</strong>g the difference between the value <strong>of</strong> the <strong>in</strong>dicator (%) <strong>in</strong><br />
the Census section <strong>and</strong> the national value <strong>of</strong> the same <strong>in</strong>dicator (%), by the<br />
national value <strong>of</strong> the same <strong>in</strong>dicator (%).<br />
ATLAS OF URBAN VULNERABILITY IN SPAIN.<br />
METHODOLOGY AND CONTENTS. PAG. 18