atlas of urban vulnerability in spain: methodology and contents
atlas of urban vulnerability in spain: methodology and contents
atlas of urban vulnerability in spain: methodology and contents

You also want an ePaper? Increase the reach of your titles
YUMPU automatically turns print PDFs into web optimized ePapers that Google loves.
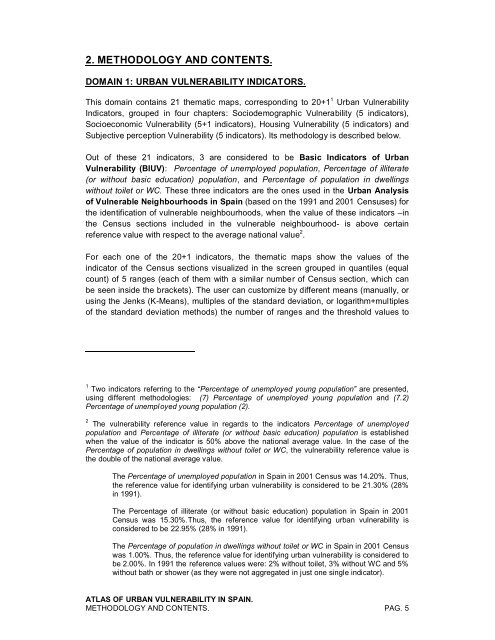
2. METHODOLOGY AND CONTENTS.<br />
DOMAIN 1: URBAN VULNERABILITY INDICATORS.<br />
This doma<strong>in</strong> conta<strong>in</strong>s 21 thematic maps, correspond<strong>in</strong>g to 20+1 1 Urban Vulnerability<br />
Indicators, grouped <strong>in</strong> four chapters: Sociodemographic Vulnerability (5 <strong>in</strong>dicators),<br />
Socioeconomic Vulnerability (5+1 <strong>in</strong>dicators), Hous<strong>in</strong>g Vulnerability (5 <strong>in</strong>dicators) <strong>and</strong><br />
Subjective perception Vulnerability (5 <strong>in</strong>dicators). Its <strong>methodology</strong> is described below.<br />
Out <strong>of</strong> these 21 <strong>in</strong>dicators, 3 are considered to be Basic Indicators <strong>of</strong> Urban<br />
Vulnerability (BIUV): Percentage <strong>of</strong> unemployed population, Percentage <strong>of</strong> illiterate<br />
(or without basic education) population, <strong>and</strong> Percentage <strong>of</strong> population <strong>in</strong> dwell<strong>in</strong>gs<br />
without toilet or WC. These three <strong>in</strong>dicators are the ones used <strong>in</strong> the Urban Analysis<br />
<strong>of</strong> Vulnerable Neighbourhoods <strong>in</strong> Spa<strong>in</strong> (based on the 1991 <strong>and</strong> 2001 Censuses) for<br />
the identification <strong>of</strong> vulnerable neighbourhoods, when the value <strong>of</strong> these <strong>in</strong>dicators <strong>in</strong><br />
the Census sections <strong>in</strong>cluded <strong>in</strong> the vulnerable neighbourhood- is above certa<strong>in</strong><br />
reference value with respect to the average national value 2 .<br />
For each one <strong>of</strong> the 20+1 <strong>in</strong>dicators, the thematic maps show the values <strong>of</strong> the<br />
<strong>in</strong>dicator <strong>of</strong> the Census sections visualized <strong>in</strong> the screen grouped <strong>in</strong> quantiles (equal<br />
count) <strong>of</strong> 5 ranges (each <strong>of</strong> them with a similar number <strong>of</strong> Census section, which can<br />
be seen <strong>in</strong>side the brackets). The user can customize by different means (manually, or<br />
us<strong>in</strong>g the Jenks (K-Means), multiples <strong>of</strong> the st<strong>and</strong>ard deviation, or logarithm+multiples<br />
<strong>of</strong> the st<strong>and</strong>ard deviation methods) the number <strong>of</strong> ranges <strong>and</strong> the threshold values to<br />
1 Two <strong>in</strong>dicators referr<strong>in</strong>g to the Percentage <strong>of</strong> unemployed young population are presented,<br />
us<strong>in</strong>g different methodologies: (7) Percentage <strong>of</strong> unemployed young population <strong>and</strong> (7.2)<br />
Percentage <strong>of</strong> unemployed young population (2).<br />
2 The <strong>vulnerability</strong> reference value <strong>in</strong> regards to the <strong>in</strong>dicators Percentage <strong>of</strong> unemployed<br />
population <strong>and</strong> Percentage <strong>of</strong> illiterate (or without basic education) population is established<br />
when the value <strong>of</strong> the <strong>in</strong>dicator is 50% above the national average value. In the case <strong>of</strong> the<br />
Percentage <strong>of</strong> population <strong>in</strong> dwell<strong>in</strong>gs without toilet or WC, the <strong>vulnerability</strong> reference value is<br />
the double <strong>of</strong> the national average value.<br />
The Percentage <strong>of</strong> unemployed population <strong>in</strong> Spa<strong>in</strong> <strong>in</strong> 2001 Census was 14.20%. Thus,<br />
the reference value for identify<strong>in</strong>g <strong>urban</strong> <strong>vulnerability</strong> is considered to be 21.30% (28%<br />
<strong>in</strong> 1991).<br />
The Percentage <strong>of</strong> illiterate (or without basic education) population <strong>in</strong> Spa<strong>in</strong> <strong>in</strong> 2001<br />
Census was 15.30%.Thus, the reference value for identify<strong>in</strong>g <strong>urban</strong> <strong>vulnerability</strong> is<br />
considered to be 22.95% (28% <strong>in</strong> 1991).<br />
The Percentage <strong>of</strong> population <strong>in</strong> dwell<strong>in</strong>gs without toilet or WC <strong>in</strong> Spa<strong>in</strong> <strong>in</strong> 2001 Census<br />
was 1.00%. Thus, the reference value for identify<strong>in</strong>g <strong>urban</strong> <strong>vulnerability</strong> is considered to<br />
be 2.00%. In 1991 the reference values were: 2% without toilet, 3% without WC <strong>and</strong> 5%<br />
without bath or shower (as they were not aggregated <strong>in</strong> just one s<strong>in</strong>gle <strong>in</strong>dicator).<br />
ATLAS OF URBAN VULNERABILITY IN SPAIN.<br />
METHODOLOGY AND CONTENTS. PAG. 5