DE LEON.pdf
DE LEON.pdf
DE LEON.pdf
Create successful ePaper yourself
Turn your PDF publications into a flip-book with our unique Google optimized e-Paper software.
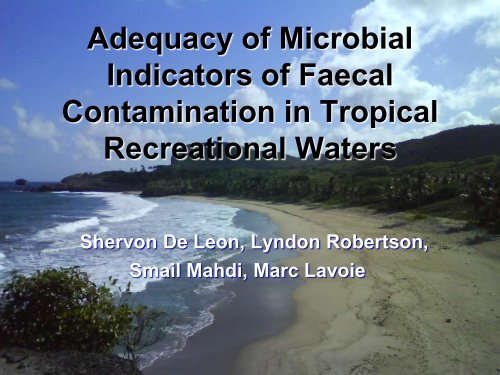
Adequacy of Microbial<br />
Indicators of Faecal<br />
Contamination in Tropical<br />
Recreational Waters<br />
Shervon De Leon, Lyndon Robertson,<br />
Smail Mahdi, Marc Lavoie
Thank You !!<br />
• CEHP –AML, WINDREF<br />
• Soufriere Marine Management Authority<br />
(Newton Eristhee)<br />
• UNEP, IWCAM (Christopher Corbin & Vincent<br />
Sweeney)<br />
• Graduate Studies<br />
• Shakira Grannum & Julia Welch<br />
• Dr. Francis Lopez<br />
• BCS staff esp. Nicole Artherly & Michelle<br />
Mendes<br />
• Family & Friends
Adequacy of Microbial<br />
Indicators of Faecal<br />
Contamination in Tropical<br />
Recreational Waters
Background<br />
• Need to determine water quality (WQ)<br />
received much attention after the 1855<br />
Salmonella outbreak (Snow & Budd,<br />
1855)<br />
• To determine WQ, simple, reliable &<br />
rapid methods for detection &<br />
enumeration of microorganisms (MO)<br />
are necessary
• Pathogens are not detected easily & routine<br />
culturing not recommended<br />
• Methods developed to determine presence<br />
of other faecal microorganisms (FM)<br />
• Absence of these FM means pathogens<br />
unlikely to be present<br />
• Concept of “indicator organisms” was<br />
introduced in 1892 and is the basis for most<br />
microbial water quality standards
Indicator Organisms:<br />
• Leclerc et al. (2001) defined indicators as „„. . .<br />
organisms whose detection at prescribed levels<br />
would point to a certain probability of pathogenic<br />
organisms of similar physiological and ecological<br />
character also being present, albeit at much lower<br />
levels than those of the markers‟‟.<br />
• “A group of organisms that indicates the presence<br />
of faecal contamination, such as the bacterial<br />
groups, thermotolerant coliforms or E. coli. Hence,<br />
they only infer that pathogens may be present.”<br />
(WHO, 2001)
• present when pathogens are present<br />
and are therefore usually used to<br />
estimate the presence of pathogens<br />
• these organisms are then indicators of<br />
potential human health risk
Characteristics of an Ideal Indicator<br />
Organism<br />
• exclusively of faecal origin<br />
• present when faecal contamination is present<br />
• occurs in equal or greater numbers than associated<br />
pathogens<br />
• exhibits same or greater survival characteristics in<br />
treatment processes and in the environment than<br />
associated pathogens<br />
• must not proliferate to any great extent in the environment<br />
• detection, enumeration and identification should be simple,<br />
reliable, quick and inexpensive
Faecal Indicators Organisms include:<br />
• Coliform bacteria<br />
• Total Coliforms<br />
• Faecal Coliforms<br />
• Escherichia coli<br />
• Enterococci<br />
• Clostridium perfringens<br />
• Bacteroides spp.
Gastrointestinal pathogens associated with<br />
enteric disease outbreaks are largely from the<br />
Enterobacteriaceae family & include:<br />
• Salmonella<br />
• Shigella<br />
• Yersinia enterocolitica<br />
• Enterotoxigenic E. coli
iiiiiiiiiiiiiiiiiiiiiiiiiiiiiiiiiii
Other enteric pathogens often<br />
found in contaminated water<br />
• Bacteria (Vibrio cholerae & Campylobacter<br />
jejuni)<br />
• Viruses (enteroviruses)<br />
• Protists (Giardia, Cryptosporidium)
The Problem
The Problem<br />
“No ideal WQI exists”<br />
• WQIs are sometimes detected when no<br />
pathogens are present in the environment<br />
• Regrowth & persistence of indicator<br />
organisms in the environment
Rationale<br />
• Region‟s heavy dependence on (sun, sea & sand)<br />
tourism as a major revenue generating industry,<br />
therefore water quality monitoring is important<br />
• Indicator organisms & water quality standards<br />
developed & based on research done in temperate<br />
regions<br />
• Increasing body of research showing traditional<br />
indicator may not be suitable for use, especially in<br />
tropics<br />
- persist in environment (soil & water)<br />
- found in areas that are considered pristine
“Experts highlighted the importance of<br />
conducting national and regional<br />
epidemiological studies to assess the<br />
suitability of microbial indicators<br />
currently used to evaluate the<br />
microbiological quality of recreational<br />
waters.”<br />
UNEP 2006 workshop report
Objectives<br />
• To determine the adequacy of coliform<br />
bacteria and enterococci for use as faecal<br />
pollution indicators in tropical recreational<br />
waters<br />
• To evaluate the adequacy of other<br />
bacterial indicators like Clostridium<br />
perfringens and Bacteroides spp.
Specific Objectives<br />
• To assess the recreational water quality in Barbados<br />
and the Windward Islands using coliforms, E.coli<br />
and enterococci<br />
• To establish correlations between FC, E. coli,<br />
enterococci, C. perfringens, Bacteroides and faecal<br />
human pathogens in tropical recreational water<br />
• To determine Sensitivity, Specificity and Accuracy of<br />
each indicator<br />
• To determine and propose the most suitable<br />
microbial indicators for recreational water quality<br />
monitoring
Methodology
Collection of Samples<br />
Analysis of Samples<br />
Compilation of Results<br />
Analysis of Data<br />
Conclusions &<br />
Recommendations
Sampling<br />
• Samples collected in accordance with<br />
Standard Methods 2005.<br />
• All samples were stored at 4 o C and analyzed<br />
within 24hrs of being taken
Barbados
Dominica
St. Lucia
Grenada
St. Vincent
Table 1. Standard Methods (2005) for pathogens & indicators.<br />
Bacterial pathogen<br />
Salmonella<br />
Shigella<br />
Vibrio cholerae<br />
Yersinia enterocolitica<br />
Microbial Indicators<br />
Method of Detection<br />
9260 B<br />
9260 E<br />
9260 H<br />
9260 K<br />
Method of Detection<br />
E. coli USEPA Method # 1603<br />
Enterococci USEPA Method # 1600<br />
Faecal Coliform<br />
9222 D<br />
C. perfringens Bisson & Cabelli<br />
(1978) modified by<br />
Armon & Payment<br />
(1988)<br />
Bacteroides sp. was isolated by recently developed methods (Linroy Christian,<br />
Ph.D. Thesis).
Membrane Filtration
Data Compilation
Data Analysis<br />
• Compare results with US EPA standards<br />
• Correlations determined using IBM SPSS 19<br />
• Spearman‟s correlation<br />
• Holm‟s tests of significance by Olkin-Finn Z<br />
statistic method (Cheung and Chan 2004)<br />
• Calculate Sensitivity, Specificity & Accuracy
Number of true negatives<br />
• SPECIFICITY = ------------------------------------------------------- X 100<br />
Number of TN + Number of FP<br />
Number of True Positives<br />
• SENSITIVITY = --------------------------------------------------------- X 100<br />
Number of TP + Number of FN<br />
Number of TP + Number of TN<br />
• ACCURACY = ------------------------------------------------------------ X 100<br />
Where:<br />
# of TP + # of TN + # of FP + # of FN<br />
• True positives (TP) = pathogens present when IO above prescribed<br />
level<br />
• True negatives (TN) = pathogen absent when IO below prescribed<br />
level<br />
• False positives (FP) = IO above prescribed level but pathogen absent<br />
• False negative (FN) = IO below prescribed level but pathogen present
Results
Water Quality<br />
• Total of 713 marine and 127 fresh water<br />
samples collected<br />
• 164 marine from Barbados,<br />
• 184 marine & 75 fresh from St. Lucia,<br />
• 181 marine & 27 fresh from Dominica,<br />
• 96 marine & 16 fresh from Grenada, and<br />
• 88 marine & 9 fresh from St. Vincent.
Frequency at which the sample counts were<br />
above the proposed limits for marine waters 1,2<br />
Barbados St. Lucia Dominica Grenada St. Vincent<br />
Number of samples 164 184 181 96 88<br />
Faecal coliform<br />
One day value (800<br />
CFU/100ml) 3 (2%) 30 (16%) 30 (17%) 6 (6%) 2 (2%)<br />
Escherichia coli<br />
One day value (235<br />
CFU/100ml)<br />
Enterococci<br />
One day value (104<br />
CFU/100ml)<br />
5 (3%) 28 (15%) 26 (14%) 4 (4%) 13 (15%)<br />
14 (9%) 16 (9%) 16 (9%) 7 (7%) 3 (3%)<br />
Clostridium<br />
perfringens<br />
Geometric mean (5<br />
CFU/100ml)<br />
95 (58%) 87 (47%) 78 (43%) 32 (33%) 39 (44%)<br />
1<br />
USEPA 2003<br />
2<br />
Fujioka, 2001
Frequency at which the sample counts were<br />
above the proposed limits for Fresh waters 1,2<br />
St. Lucia Dominica Grenada St. Vincent<br />
Number of samples 75 27 16 9<br />
Feacal coliforms<br />
One day value (800<br />
CFU/100ml)<br />
Escherichia coli<br />
One day value (235<br />
CFU/100ml)<br />
Enterococci<br />
One day value (104<br />
CFU/100ml)<br />
Clostridium<br />
perfringens<br />
Geometric mean (50<br />
CFU/100ml)<br />
31 (41%) 16 (59%) 4 (25%) 3 (33%)<br />
28 (37%) 15 (56%) 4 (25%) 4 (44%)<br />
33 (44%) 8 (30%) 6 (38%) 4 (44%)<br />
9 (12%) 5 (19%) 1 (6%) 3 (33%)<br />
1<br />
USEPA 2003<br />
2<br />
Fujioka, 2001
Occurrence of Pathogens in relation to indicator levels<br />
in the marine & fresh waters of Barbados and the<br />
Windward Islands<br />
Indicators Pathogens in Marine Water Pathogens in Fresh Water<br />
Feacal coliforms≥800 CFU/100ml<br />
Faecal coliform < 800 CFU/100ml<br />
59%<br />
41%<br />
60%<br />
17%<br />
Escherichia coli ≥235 CFU/100ml<br />
Escherichia coli < 235 CFU/100ml<br />
64%<br />
40%<br />
53%<br />
21%<br />
Enterococci ≥104 CFU/100ml<br />
Enterococci < 104 CFU/100ml<br />
Clostridium perfringens ≥ 50<br />
CFU/100ml<br />
Clostridium perfringens < 50<br />
CFU/100ml<br />
Bacteroides spp. ≥ 1 CFU/100ml<br />
Bacteroides spp. < 1 CFU/100ml<br />
71%<br />
39%<br />
3%<br />
34%<br />
69.2%<br />
24.6%<br />
45%<br />
28%<br />
11%<br />
24%<br />
62%<br />
18%
Correlations between Indicators and Pathogens in<br />
Marine Water (N = 713). All values (Sigma twotailed)<br />
were significant at p < 0.05.<br />
Faecal<br />
coliform<br />
Faecal<br />
coliform E. coli Enterococci<br />
C.<br />
perfringens<br />
Bacteroides<br />
Pooled<br />
Pathogens<br />
1.000 .901 .712 .528 .491 .364<br />
E. coli .901 1.000 .743 .509 .503 .376<br />
Enterococci .712 .743 1.000 .510 .479 .419<br />
C.<br />
perfringens<br />
Bacteroides<br />
spp.<br />
Pooled<br />
Pathogens<br />
.528 .509 .510 1.000 .532 .450<br />
.491 .503 .479 .532 1.000 .482<br />
.364 b .376 b,c .419 a,c .450 a .482 a 1.000<br />
a,b,c<br />
Values with the same letter are not statistically significantly different
Correlations between Indicator Organisms and<br />
Between Indicators and Pathogens in Fresh<br />
Water (N = 127)<br />
Faecal<br />
coliform<br />
Faecal<br />
Bacteroides Pooled<br />
coliform E. coli Enterococci C. perfringens spp. Pathogens<br />
1.000 .929 .788 .615 .551 .500<br />
E. coli .929 1.000 .816 .620 .587 .467<br />
Enterococci .788 .816 1.000 .565 .506 .281<br />
C. perfringens .615 .620 .565 1.000 .774 .571<br />
Bacteroides<br />
spp.<br />
Pooled<br />
Pathogens<br />
.551 .587 .506 .774 1.000 .511<br />
.500 a .467 a .281 b .571 a .511 a 1.000<br />
a,b,c<br />
Values with the same letter are not statistically significantly different
Marine Water<br />
Fresh Water<br />
Sensitivity, Specificity & Accuracy<br />
Analyses<br />
Matrix Faecal coliforms E. coli enterococci C. perfringens Bacteroides<br />
spp.<br />
Sensitivity 10% 13.1% 15.2% 8.3% 46.9%<br />
Specificity 95.5% 94.8% 96.1% 98.4% 83.9%<br />
Accuracy 63.5% 64.3% 65.9% 64.6% 68.1%<br />
Sensitivity 75.6% 66.7% 53.3% 31.1% 68.9%<br />
Specificity 74.4% 72.1% 66.3% 96.5% 77.9%<br />
Accuracy 74.8% 70.2% 61.8% 74% 74.8%
Discussion<br />
Does not take into account viruses & protists<br />
Correlation coefficients not statistically<br />
significantly different but close to significance<br />
C. perfringens less closely correlated to<br />
pathogens than Bacteroides spp. but more<br />
easily detected
Conclusions &<br />
Recommendations<br />
More analyses to further confirm these results<br />
Clostridium perfringens be adopted and used alongside E.<br />
coli & enterococci<br />
Develop more easy-to-use techniques for Bacteroides<br />
Epidemiology study using traditional and proposed<br />
indicators<br />
Survival rate comparisons: indicators vs pathogens
Questions Please?
Percentage true and false positives and<br />
negative in fresh and marine samples<br />
Marine Water<br />
Fresh Water<br />
Parameter TN FN TP FP TN FN TP FP<br />
Faecal coliforms 60% 34% 4% 3% 49% 8% 26% 17%<br />
E. coli 59% 33% 5% 3% 47% 11% 23% 18%<br />
Enterococci 60% 32% 6% 2% 44% 16% 18% 22%<br />
C. perfringens 62% 34% 3% 1% 63% 24% 11% 2%<br />
Bacteroides spp. 48% 22% 20% 9% 51% 11% 24% 15%<br />
Where:<br />
True positives (TP) = pathogens present when IO above prescribed level<br />
True negatives (TN) = pathogen absent when IO below prescribed level<br />
False positives (FP) = IO above prescribed level but pathogen absent<br />
False negative (FN) = IO below prescribed level but pathogen present


