The spatial behavior of residential burglars Manuel J.J. ... - TU Delft
The spatial behavior of residential burglars Manuel J.J. ... - TU Delft
The spatial behavior of residential burglars Manuel J.J. ... - TU Delft

You also want an ePaper? Increase the reach of your titles
YUMPU automatically turns print PDFs into web optimized ePapers that Google loves.
426 <strong>Manuel</strong> J.J. López<br />
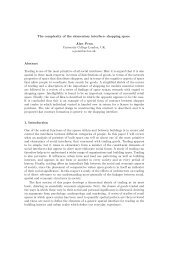
Figure 200: Range <strong>of</strong> operation and buffer zone<br />
at least five burglary <strong>of</strong>fences that were committed between 1998 and 2004. When we look<br />
at the sample, we see that none <strong>of</strong> the <strong>of</strong>fenders were specialists in the sense that they did<br />
not limit their criminal acts to <strong>residential</strong> burglary. <strong>The</strong>y were all male and between the<br />
ages <strong>of</strong> 21 and 43. <strong>The</strong> mean age was 31.8 (S.D. = 0.6). Seven <strong>of</strong>fenders were registered<br />
by the police as habitual <strong>of</strong>fenders, one was an alcoholic and one was a drug addict. <strong>The</strong><br />
average number <strong>of</strong> burglary <strong>of</strong>fences by one <strong>of</strong>fender was 11, with a minimum <strong>of</strong> 5 and a<br />
maximum <strong>of</strong> 19 (S.D. = 3.9). Half <strong>of</strong> the <strong>of</strong>fenders (10) were born in Kennemerland and<br />
the other half were born elsewhere in <strong>The</strong> Netherlands (8) or abroad (2).<br />
A minimum <strong>of</strong> five maps was made for each <strong>of</strong>fender. <strong>The</strong> first map showed the different<br />
home addresses <strong>of</strong> the <strong>of</strong>fender during his lifetime. A distinction was made between the<br />
<strong>of</strong>fender’s home address before, during and after the period <strong>of</strong> <strong>of</strong>fending. <strong>The</strong> second<br />
map marked the locations <strong>of</strong> the burglary <strong>of</strong>fences and the remaining maps gave different<br />
representations <strong>of</strong> the relationship between the <strong>of</strong>fender’s home and burglary locations.<br />
3. Range <strong>of</strong> operation<br />
<strong>The</strong> first step in the study was testing the hypothesis about the range <strong>of</strong> operation.<br />
When we know both the location <strong>of</strong> the <strong>of</strong>fender’s home base and the location <strong>of</strong> his<br />
<strong>of</strong>fenses, we can easily determine the range <strong>of</strong> operation by measuring the longest straightline<br />
distance between the home location and <strong>of</strong>fence locations. <strong>The</strong> so-called buffer zone<br />
can be determined in the same fashion, by measuring the shortest straight-line distance<br />
between the home location and <strong>of</strong>fence locations. Both the range <strong>of</strong> operation and the<br />
buffer zone can be represented on a map, by drawing both distances around the home<br />
location with a pair <strong>of</strong> compasses (Figure 200). When we reverse this procedure and draw<br />
the longest straight-line distance not around the location <strong>of</strong> the <strong>of</strong>fender’s home but around<br />
the locations <strong>of</strong> his <strong>of</strong>fences, we see that the <strong>of</strong>fender’s home base is in the area <strong>of</strong> the<br />
biggest overlap (Figure 201).<br />
If we both know the location <strong>of</strong> the <strong>of</strong>fences and the distance <strong>of</strong> the range <strong>of</strong> operation,<br />
we can be 100% accurate in defining the area in which we can expect the <strong>of</strong>fender’s