The Role of Space Syntax in Identifying the Relationship Between ...
The Role of Space Syntax in Identifying the Relationship Between ...
The Role of Space Syntax in Identifying the Relationship Between ...

You also want an ePaper? Increase the reach of your titles
YUMPU automatically turns print PDFs into web optimized ePapers that Google loves.
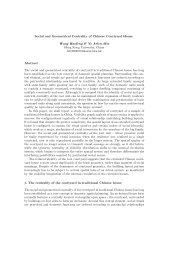
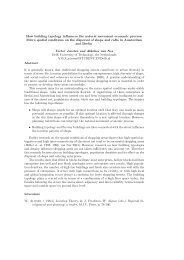
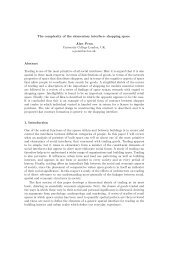
<strong>The</strong> <strong>Role</strong> <strong>of</strong> <strong>Space</strong> <strong>Syntax</strong> <strong>in</strong> Identify<strong>in</strong>g <strong>the</strong> <strong>Relationship</strong><strong>Between</strong> <strong>Space</strong> and Crime 415Figure 196: Map show<strong>in</strong>g <strong>the</strong> volume <strong>of</strong> crime represented by bars. <strong>The</strong> axial l<strong>in</strong>es <strong>in</strong> <strong>the</strong>map vary <strong>in</strong> thickness where thick l<strong>in</strong>es represent highly <strong>in</strong>tegrated street segments andth<strong>in</strong> l<strong>in</strong>es represent segregated street segments<strong>in</strong>terest<strong>in</strong>g study by Bennet (1989) highlighted <strong>the</strong>se <strong>the</strong>ories by <strong>in</strong>terview<strong>in</strong>g 128 <strong>of</strong>fenderscurrently serv<strong>in</strong>g sentences <strong>in</strong> prison about <strong>the</strong>ir choice <strong>of</strong> targets. <strong>The</strong> subjects were allmale and almost half <strong>of</strong> <strong>the</strong>m were under 21. In addition to <strong>the</strong> <strong>in</strong>terview, <strong>of</strong>fenders wereshown a video-record<strong>in</strong>g <strong>of</strong> 36 dwell<strong>in</strong>gs <strong>in</strong> 4 neighborhoods. <strong>The</strong> video was recorded froma van travel<strong>in</strong>g at a walk<strong>in</strong>g speed. When <strong>the</strong> <strong>of</strong>fenders assessed <strong>the</strong> dwell<strong>in</strong>gs, resultsshowed that <strong>the</strong>ir primary <strong>in</strong>fluence was related to <strong>the</strong> likelihood <strong>of</strong> be<strong>in</strong>g caught. <strong>The</strong>difficulty <strong>of</strong> enter<strong>in</strong>g a particular property was mentioned less. Risk factors <strong>in</strong>cluded signs<strong>of</strong> occupancy <strong>of</strong> <strong>the</strong> targeted dwell<strong>in</strong>g or <strong>the</strong> houses nearby. Security locks were seldomconsidered as a risk factor. This suggests that surveillability is an important measure.Earlier studies by Bennett and Wright (1984) and Jackson and W<strong>in</strong>chester (1982)supported <strong>the</strong> f<strong>in</strong>d<strong>in</strong>g that surveillability and occupancy <strong>in</strong>fluence <strong>the</strong> burglar’s choice<strong>of</strong> targets. Indications <strong>of</strong> occupancy <strong>in</strong>clude a car <strong>in</strong> <strong>the</strong> driveway or a security alarmsystem. Bennett and Wright’s study was also <strong>the</strong> result <strong>of</strong> an <strong>in</strong>terview with burglars.<strong>The</strong>y concluded that <strong>the</strong> greatest risk that burglars face is gett<strong>in</strong>g caught.2.2. Crime-design l<strong>in</strong>kA grow<strong>in</strong>g body <strong>of</strong> research has focused on <strong>the</strong> crime-design l<strong>in</strong>k. In <strong>the</strong> L<strong>in</strong>k <strong>Between</strong>Crime and <strong>the</strong> Built Environment (Rubenste<strong>in</strong>,1981), <strong>the</strong> authors reviewed three types <strong>of</strong>rational that might affect crime: <strong>the</strong> hardware rationale, <strong>the</strong> community build<strong>in</strong>g rationale,and <strong>the</strong> social surveillance rationale. <strong>The</strong> hardware rationale focuses on “target harden<strong>in</strong>g”
416 L<strong>in</strong>da Nubani and Jean W<strong>in</strong>emansuch as walls around houses, triple locks and so on. It is assumed that “target harden<strong>in</strong>g”might <strong>in</strong>crease <strong>the</strong> technical difficulty <strong>of</strong> committ<strong>in</strong>g an <strong>of</strong>fense and make <strong>the</strong> crime lesssuccessful.<strong>The</strong> community build<strong>in</strong>g rationale is built on <strong>the</strong> hypo<strong>the</strong>sis that <strong>the</strong>re is a complexrange <strong>of</strong> physical characteristics that, if controlled, may reduce crime. <strong>The</strong> list <strong>in</strong>cludes,but is not limited to, <strong>the</strong> follow<strong>in</strong>g: improved street light<strong>in</strong>g, <strong>in</strong>creased use <strong>of</strong> shared publicspaces, reduced number <strong>of</strong> families per entrance and number <strong>of</strong> apartments per floor,created hierarchy <strong>of</strong> zones from public to private, and <strong>in</strong>creased use <strong>of</strong> symbolic barriers<strong>in</strong> hous<strong>in</strong>g developments. <strong>The</strong> social surveillance rationale presumes that <strong>the</strong> layout <strong>of</strong> <strong>the</strong>physical environment helps residents’ awareness <strong>of</strong> suspicious activities <strong>in</strong> <strong>the</strong>ir neighborhood,<strong>in</strong>creases <strong>the</strong> residents’ ability to recognize strangers and makes strangers feel that<strong>the</strong>y are be<strong>in</strong>g watched.<strong>The</strong> concept <strong>of</strong> surveillance is not new and can be traced back to early work by OscarNewman and Jane Jacobs <strong>in</strong> <strong>the</strong> 1960s Jacobs believed that through <strong>the</strong> occupation anduse <strong>of</strong> space, residents come to consider a particular space is <strong>the</strong>irs and <strong>the</strong>y exert controlover it (Jacobs, 1961).“<strong>The</strong> public place <strong>of</strong> cities is not kept primarily by <strong>the</strong> police,... it is kept primarily byan <strong>in</strong>tricate, almost unconscious, network <strong>of</strong> voluntary controls and standards among <strong>the</strong>people <strong>the</strong>mselves, and enforced by <strong>the</strong> people <strong>the</strong>mselves.” (Jacobs, 1961)Newman called for <strong>the</strong> creation <strong>of</strong> a hierarchy <strong>of</strong> zones from public to private. Thistype <strong>of</strong> separation, termed territoriality, allows residents to adopt an attitude that <strong>the</strong>private area is <strong>the</strong>irs. To achieve this attitude Newman suggests plac<strong>in</strong>g walls or fencesaround private areas, or employ<strong>in</strong>g symbolic devices such as changes <strong>of</strong> level, materials,portals or landscap<strong>in</strong>g (Newman, 1973).It is also <strong>in</strong>terest<strong>in</strong>g to mention that Newman’s ideas formed what currently referredto as Crime Prevention Through Environmental Design, also known as CPTED. CPTEDis def<strong>in</strong>ed by Crowe (2000), “as <strong>the</strong> use <strong>of</strong> <strong>the</strong> built environment <strong>in</strong> reduc<strong>in</strong>g fear <strong>of</strong> crimeand <strong>in</strong>cidence <strong>of</strong> crime and improv<strong>in</strong>g <strong>the</strong> quality <strong>of</strong> life.” CPTED is centered around <strong>the</strong>notion <strong>of</strong> Defensible <strong>Space</strong>, a range <strong>of</strong> mechanisms popularized by Newman <strong>in</strong> early 1970s.Briefly, it stresses <strong>the</strong> importance <strong>of</strong> creat<strong>in</strong>g a sense <strong>of</strong> territoriality among residents, andprovid<strong>in</strong>g natural surveillance through environmental design.2.3. <strong>Space</strong> <strong>Syntax</strong> and CrimeIn <strong>the</strong> past decade, researchers have begun to devote attention to <strong>the</strong> effect <strong>of</strong> configurationalproperties on crime. Such studies found correlations between measures <strong>of</strong> <strong>Space</strong><strong>Syntax</strong>, and crime <strong>in</strong> residential neighborhoods (Shu, 2000; Hillier and Shu, 2000). <strong>Space</strong><strong>Syntax</strong>, a group <strong>of</strong> <strong>the</strong>ories that exam<strong>in</strong>e <strong>the</strong> social use <strong>of</strong> space, was developed <strong>in</strong> <strong>the</strong> late60s by Hillier and Hanson (Hillier and Hanson, 1984). Two <strong>Space</strong> <strong>Syntax</strong> measures, knownas Integration and Connectivity, calculate <strong>the</strong> level <strong>of</strong> accessibility <strong>of</strong> street segments fromall o<strong>the</strong>r street segments with<strong>in</strong> a spatial system.Build<strong>in</strong>g on <strong>the</strong> idea that neighborhood layouts provide opportunities and access tocommit a crime, Shu and Huang (2003) <strong>in</strong>vestigated <strong>the</strong> effect <strong>of</strong> accessibility <strong>of</strong> residentialneighborhoods <strong>in</strong> Taiwan. <strong>The</strong>ir research <strong>in</strong>vestigated <strong>the</strong> <strong>in</strong>fluence <strong>of</strong> spatial configurationon <strong>the</strong> distribution <strong>of</strong> burglary. In <strong>the</strong> first part <strong>of</strong> <strong>the</strong>ir analysis, <strong>the</strong>y controlled for socialfactors by look<strong>in</strong>g at three districts <strong>in</strong> Nor<strong>the</strong>rn Taiwan <strong>in</strong>habited by different socialclasses. <strong>The</strong> first district was a low density farm<strong>in</strong>g district; <strong>the</strong> second was a mediumdensity historical district; and <strong>the</strong> third was a densely populated residential area with parks
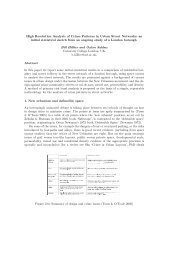
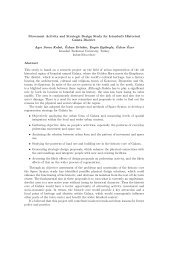
<strong>The</strong> <strong>Role</strong> <strong>of</strong> <strong>Space</strong> <strong>Syntax</strong> <strong>in</strong> Identify<strong>in</strong>g <strong>the</strong> <strong>Relationship</strong><strong>Between</strong> <strong>Space</strong> and Crime 417Figure 197: Table summariz<strong>in</strong>g results <strong>of</strong> Poisson Regression Model<strong>in</strong>gand educational facilities at <strong>the</strong> periphery. <strong>The</strong>re were a total <strong>of</strong> 121 neighborhoods with<strong>in</strong><strong>the</strong> three districts, which were classified <strong>in</strong>to 12 groups accord<strong>in</strong>g to <strong>the</strong>ir <strong>in</strong>come level.<strong>The</strong> neighborhoods were also categorized <strong>in</strong>to 12 groups accord<strong>in</strong>g to <strong>the</strong>ir mean global<strong>in</strong>tegration and accord<strong>in</strong>g to <strong>the</strong>ir mean local <strong>in</strong>tegration. Police crime data was ga<strong>the</strong>redfor an 8 month period; <strong>the</strong>re were total number <strong>of</strong> 241 crime <strong>in</strong>cidents. <strong>The</strong> results showedweak correlation between burglary rate and <strong>in</strong>come levels and weak correlations betweenburglary rates and global <strong>in</strong>tegration. Through correlational analyses with<strong>in</strong> each <strong>in</strong>comelevel, a strong connection was found between global <strong>in</strong>tegration and burglary rates <strong>in</strong>low-<strong>in</strong>come neighborhoods. <strong>The</strong>se f<strong>in</strong>d<strong>in</strong>gs suggested that globally <strong>in</strong>tegrated low-<strong>in</strong>comegroups are safer. Fur<strong>the</strong>r f<strong>in</strong>d<strong>in</strong>gs <strong>in</strong>dicated that <strong>the</strong>re were stronger correlations betweenlocal <strong>in</strong>tegration and burglary rates than between global <strong>in</strong>tegration and burglary rates <strong>in</strong>middle-<strong>in</strong>come groups. <strong>The</strong> authors proposed that globally and locally <strong>in</strong>tegrated middle<strong>in</strong>comegroups are safer than segregated ones. In addition, <strong>the</strong> authors found no correlationbetween global or local <strong>in</strong>tegration and burglary rates <strong>in</strong> high-<strong>in</strong>come neighborhoods. Thisis possibly expla<strong>in</strong>ed by <strong>the</strong> fact that “target harden<strong>in</strong>g” features are more common with<strong>in</strong>high <strong>in</strong>come neighborhoods.Similar to previous work by Shu and Huang, Jones & Fanek (1997) looked at <strong>the</strong> effect<strong>of</strong> spatial configuration on crime <strong>in</strong> Aust<strong>in</strong>, Texas. <strong>The</strong>y selected four pairs <strong>of</strong> tracts <strong>in</strong>which each pair had similar <strong>in</strong>come, poverty rates, population and racial composition.Us<strong>in</strong>g Axman s<strong>of</strong>tware, Integration R=3, Integration R=10, Control and Connectivityvalues were calculated for each <strong>of</strong> <strong>the</strong> tracts. Correlations were <strong>the</strong>n exam<strong>in</strong>ed betweensyntax values and crime rates. Results showed that pairs with higher <strong>in</strong>tegration valueswere associated with lower crime rates. Three tracts with higher mean <strong>in</strong>tegration R=3 andconnectivity values were also associated with lower crimes rates. <strong>The</strong> authors expla<strong>in</strong>edthat more connected streets will attract higher pedestrian movement, and thus more eyeson <strong>the</strong> street.
418 L<strong>in</strong>da Nubani and Jean W<strong>in</strong>emanAs a result <strong>of</strong> promis<strong>in</strong>g f<strong>in</strong>d<strong>in</strong>gs us<strong>in</strong>g <strong>Space</strong> <strong>Syntax</strong> for identify<strong>in</strong>g <strong>the</strong> spatial distribution<strong>of</strong> crime, Gosnells, a city <strong>in</strong> Western Australia consulted <strong>the</strong> <strong>Space</strong> <strong>Syntax</strong> laboratoryat University College London and Murdoch University to identify <strong>the</strong> spatial distribution<strong>of</strong> crime (Australia’s National Government Newspaper, 2003). <strong>The</strong> <strong>Space</strong> <strong>Syntax</strong> Labcompared <strong>the</strong> movement <strong>of</strong> pedestrians and vehicles to crime statistics and space syntaxmeasures. <strong>The</strong> results were consistent with previous f<strong>in</strong>d<strong>in</strong>gs and showed a strong l<strong>in</strong>kbetween spatial configuration and burglary and <strong>the</strong>ft.3. Method3.1. Types <strong>of</strong> crime and description <strong>of</strong> case studyGenerally, different types <strong>of</strong> crime are associated with different levels <strong>of</strong> land use andsocial characteristics (Dunn, 1980). Personal attack crimes, for example, occur <strong>in</strong> lowerclass neighborhoods, while property crimes occur <strong>in</strong> neighborhoods that are accessibleor close to land uses, or <strong>in</strong> neighborhoods with higher percentages <strong>of</strong> underemployed ors<strong>in</strong>gle residents. Arsons, robberies and burglaries share monetary ga<strong>in</strong> objectives and aremore likely to occur <strong>in</strong> middle- and high-class neighborhoods (Rengert, 1980). For <strong>the</strong>sereasons, we excluded non-residential neighborhoods. We also excluded organized crimesor crimes that <strong>in</strong>volve acqua<strong>in</strong>tances or for <strong>the</strong> purpose <strong>of</strong> revenge such as assaults andmurder. Specifically, we focused on four stranger-to-stranger types <strong>of</strong> crime. <strong>The</strong>se arelarceny, motor vehicle <strong>the</strong>ft, break<strong>in</strong>g and enter<strong>in</strong>g and robbery.Accord<strong>in</strong>g to FBI uniform report (1998), larceny, motor vehicle <strong>the</strong>ft and break<strong>in</strong>g andenter<strong>in</strong>g are considered property crimes where <strong>the</strong> object <strong>of</strong> <strong>the</strong> <strong>of</strong>fense is <strong>the</strong> tak<strong>in</strong>g <strong>of</strong>property without any threat <strong>in</strong>volved. More precisely, larceny is tak<strong>in</strong>g away property from<strong>the</strong> possession <strong>of</strong> ano<strong>the</strong>r. Purse-snatch<strong>in</strong>g and shoplift<strong>in</strong>g are good examples <strong>of</strong> larceny.Motor vehicle <strong>the</strong>ft is <strong>the</strong> steal<strong>in</strong>g <strong>of</strong> a truck, automobile, motorcycles, and any o<strong>the</strong>rvehicle. Break<strong>in</strong>g and enter<strong>in</strong>g is def<strong>in</strong>ed as <strong>the</strong> unlawful entry <strong>in</strong>to a property withoutputt<strong>in</strong>g people under threat (Hill, 1995). Robbery on <strong>the</strong> o<strong>the</strong>r hand is a violent crime that<strong>in</strong>volves putt<strong>in</strong>g victims under threat. It <strong>in</strong>cludes tak<strong>in</strong>g anyth<strong>in</strong>g <strong>of</strong> value from persons(FBI uniform report, 1998).In this study, we looked at Ypsilanti, a city located with<strong>in</strong> <strong>the</strong> Metropolitan Detroitarea <strong>in</strong> Michigan. With a population <strong>of</strong> approximately 22,362, 1273 crime <strong>in</strong>cidents werereported <strong>in</strong> year 2003. Crimes <strong>in</strong> this figure <strong>in</strong>clude larceny, break<strong>in</strong>g and enter<strong>in</strong>g, robberyand motor vehicle <strong>the</strong>ft. Accord<strong>in</strong>g to FBI Crime Reports, <strong>the</strong> crime level <strong>in</strong> Ypsilanti isworse than <strong>the</strong> national average particularly for burglaries, robberies, and <strong>the</strong>fts (YpsilantiMI Crime Statistics, 2002). <strong>The</strong> crime report was obta<strong>in</strong>ed from <strong>the</strong> Ypsilanti PoliceDepartment and Eastern Michigan University. It <strong>in</strong>cludes data on <strong>the</strong> four types <strong>of</strong> crimeat an address level with <strong>the</strong> exact date and time.3.2. <strong>The</strong> axial map analysisSpatial layout was analyzed us<strong>in</strong>g space syntax techniques by assign<strong>in</strong>g syntactic valuesto every street segment <strong>in</strong> <strong>the</strong> system (e.g. All <strong>the</strong> street segments <strong>in</strong> Ypsilanti). <strong>The</strong>two syntax measures used were Integration and Connectivity. <strong>The</strong>y were calculated us<strong>in</strong>gSpatialist. <strong>The</strong> Spatialist, a program developed by Peponis and W<strong>in</strong>eman, runs us<strong>in</strong>gMicroStation. First, <strong>the</strong> Ypsilanti map was converted <strong>in</strong>to an acceptable format. Ano<strong>the</strong>rlayer was created on top <strong>of</strong> <strong>the</strong> map to prepare <strong>the</strong> axial map. <strong>The</strong> axial map is a network
<strong>The</strong> <strong>Role</strong> <strong>of</strong> <strong>Space</strong> <strong>Syntax</strong> <strong>in</strong> Identify<strong>in</strong>g <strong>the</strong> <strong>Relationship</strong><strong>Between</strong> <strong>Space</strong> and Crime 419<strong>of</strong> <strong>in</strong>tersect<strong>in</strong>g axial l<strong>in</strong>es. In simple terms, <strong>the</strong> axial map is represented by <strong>the</strong> longestl<strong>in</strong>es <strong>of</strong> sight that can be used to characterize every street segment <strong>in</strong> <strong>the</strong> Ypsilanti area.For example, if two people were stand<strong>in</strong>g at each end <strong>of</strong> <strong>the</strong> l<strong>in</strong>e, <strong>the</strong>y will be able to seeeach o<strong>the</strong>r. <strong>The</strong> l<strong>in</strong>es were drawn manually on top <strong>of</strong> <strong>the</strong> map us<strong>in</strong>g Spatialist. Ypsilanticomprised an average <strong>of</strong> 634 axial l<strong>in</strong>es.Second, <strong>the</strong> program calculated <strong>the</strong> Integration and Connectivity values <strong>of</strong> every l<strong>in</strong>e<strong>in</strong> <strong>the</strong> system (Figure 195). To elaborate on <strong>the</strong>se two measures, Connectivity gives <strong>the</strong>number <strong>of</strong> l<strong>in</strong>es that are directly connected to a specific l<strong>in</strong>e. Integration, on <strong>the</strong> o<strong>the</strong>rhand, is an <strong>in</strong>dicator <strong>of</strong> how easily one can reach a specific l<strong>in</strong>e. Ma<strong>the</strong>matically speak<strong>in</strong>g,it is <strong>the</strong> average number <strong>of</strong> spaces that one needs to pass through to reach a specific l<strong>in</strong>efrom all <strong>the</strong> axial l<strong>in</strong>es <strong>in</strong> <strong>the</strong> system. In o<strong>the</strong>r words, <strong>the</strong>se values suggest <strong>the</strong> extent towhich a selected space <strong>in</strong> <strong>the</strong> system is more <strong>in</strong>tegrated (can be easily reached from o<strong>the</strong>rspaces), or more segregated (one has to travel through many spaces <strong>in</strong> order to reach thatselected space).S<strong>in</strong>ce <strong>the</strong> unit <strong>of</strong> analysis is <strong>the</strong> axial l<strong>in</strong>e (or <strong>the</strong> street space), it was necessary toappend sociodemographic data along with crime data to each l<strong>in</strong>e. <strong>The</strong>refore, a road map<strong>of</strong> Ypsilanti was prepared show<strong>in</strong>g 21 block groups us<strong>in</strong>g ArcGIS. Data on populationdensity, youth concentration, level <strong>of</strong> education, percentage <strong>of</strong> owners, age distributionand racial composition were available from U.S. Census and were appended to each blockgroup <strong>in</strong> Ypsilanti. <strong>The</strong> report on crime at an address level was semi-manually entered<strong>in</strong>to <strong>the</strong> same database (Figure 195). Moreover, <strong>the</strong> orig<strong>in</strong>al axial map that was preparedus<strong>in</strong>g Spatialist was later converted <strong>in</strong>to an appropriate format and was given accurategeographic coord<strong>in</strong>ates for Ypsilanti. This procedure allowed us to match <strong>the</strong> Spatialistaxial map with <strong>the</strong> ArcGIS Ypsilanti road map (Figure 196). <strong>The</strong> ‘Jo<strong>in</strong> Attribute’ feature<strong>in</strong> ArcGIS allowed us to merge <strong>the</strong> data on <strong>the</strong> axial map with <strong>the</strong> rest <strong>of</strong> <strong>the</strong> data.<strong>The</strong> f<strong>in</strong>al database that was produced <strong>in</strong> ArcGIS was later converted <strong>in</strong>to an acceptableSAS format. SAS is a statistical package that enabled us conduct a Poisson Regressionmodel<strong>in</strong>g <strong>of</strong> our data s<strong>in</strong>ce <strong>the</strong> crime report was collected over a period <strong>of</strong> a year.3.3. Statistical Analysis<strong>The</strong> MIXED Procedure <strong>in</strong> SAS (Version 9) was used <strong>in</strong> <strong>the</strong>se analyses to fit l<strong>in</strong>ear mixedmodels to <strong>the</strong> collected data. Because <strong>of</strong> <strong>the</strong> count nature <strong>of</strong> <strong>the</strong> response variables, squareroottransformations were performed <strong>in</strong> order to satisfy <strong>the</strong> assumptions <strong>of</strong> normality andconstant variance <strong>in</strong> random errors. In <strong>the</strong> mixed models, <strong>the</strong> fixed effects <strong>of</strong> physical andsociodemographic variables <strong>of</strong> <strong>in</strong>terest on crime counts collected over one year <strong>in</strong> givenstreet-spaces or axial l<strong>in</strong>es were estimated. Because <strong>of</strong> <strong>the</strong> clustered nature <strong>of</strong> <strong>the</strong> data,axial l<strong>in</strong>es were clustered with<strong>in</strong> randomly selected block groups, random <strong>in</strong>tercepts andrandom connectivity effects associated with <strong>the</strong> randomly sampled block groups were also<strong>in</strong>cluded, to test <strong>the</strong> hypo<strong>the</strong>sis that <strong>the</strong> crime counts and effects <strong>of</strong> connectivity on crimecounts tend to randomly vary from one block group to ano<strong>the</strong>r. Parameters <strong>in</strong> <strong>the</strong> modelwere tested us<strong>in</strong>g likelihood ratio tests, ei<strong>the</strong>r based on maximum likelihood (for fixedeffects) or restricted maximum likelihood (for variance parameters associated with <strong>the</strong>random effects).
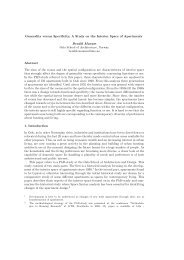
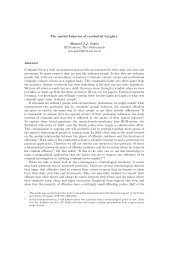
420 L<strong>in</strong>da Nubani and Jean W<strong>in</strong>emanFigure 198: LEFT: Plot show<strong>in</strong>g how <strong>the</strong> effect <strong>of</strong> connectivity on crime is moderatedby levels <strong>of</strong> youth concentration. RIGHT: Plot show<strong>in</strong>g how <strong>the</strong> effect <strong>of</strong> connectivity oncrime is moderated by percentages <strong>of</strong> home ownership4. Results and analysisResults <strong>of</strong> <strong>the</strong> analysis showed that both local <strong>in</strong>tegration and connectivity were highlyassociated with overall crime counts followed by density. O<strong>the</strong>r factors such as median<strong>in</strong>come, racial composition and global <strong>in</strong>tegration did not feature <strong>in</strong> <strong>the</strong> model. However,unlike previous studies by Hillier & Shu and Jones & Fanek, local <strong>in</strong>tegration was positivelycorrelated with crime rates. In <strong>the</strong> model, local <strong>in</strong>tegration was significant at <strong>the</strong> 1%level (P = 0.0001). To elaborate on this f<strong>in</strong>d<strong>in</strong>g, street spaces that had low <strong>in</strong>tegrationvalues were safer. That is to say neighborhoods that <strong>of</strong>fered highly accessible routes to<strong>the</strong>ir residents apparently also <strong>of</strong>fered crim<strong>in</strong>als easy routes <strong>of</strong> escape. Table <strong>in</strong> figure 197summarizes <strong>the</strong>se results.More <strong>in</strong>terest<strong>in</strong>gly, additional f<strong>in</strong>d<strong>in</strong>gs showed that <strong>the</strong> effect <strong>of</strong> connectivity on crimecount was moderated by levels <strong>of</strong> youth concentration and <strong>the</strong> percentage <strong>of</strong> owners at <strong>the</strong>block group level. In <strong>the</strong> model, connectivity was significant at <strong>the</strong> 1% level (P= 0002). <strong>The</strong>product <strong>of</strong> both connectivity and youth concentration on crime was negative. This is tosay that <strong>the</strong> higher <strong>the</strong> percentage <strong>of</strong> youth concentration, <strong>the</strong> more negative <strong>the</strong> relationshipbetween connectivity and crime (Figure 198). <strong>The</strong> same is true for connectivity andpercentage <strong>of</strong> home owners. <strong>The</strong> higher <strong>the</strong> percentage <strong>of</strong> people who own <strong>the</strong>ir residencesat a block group level, <strong>the</strong> more negative <strong>the</strong> relationship between connectivity and crime(Figure 198). Perhaps <strong>the</strong>se results can be related to <strong>the</strong> effects <strong>of</strong> ‘eyes on <strong>the</strong> street’.If <strong>the</strong>re are higher levels <strong>of</strong> home ownership (<strong>in</strong>dicat<strong>in</strong>g a more stable population), underconditions <strong>of</strong> high connectivity (support<strong>in</strong>g neighbor<strong>in</strong>g and ‘eyes on <strong>the</strong> street’), crimeis lower, while under conditions <strong>of</strong> low connectivity, crime is higher. Similarly, with highlevels <strong>of</strong> youths <strong>in</strong> <strong>the</strong> neighborhood, high levels <strong>of</strong> connectivity (support<strong>in</strong>g neighbor<strong>in</strong>gand ‘eyes on <strong>the</strong> street’), are associated with lower levels <strong>of</strong> crime.
<strong>The</strong> <strong>Role</strong> <strong>of</strong> <strong>Space</strong> <strong>Syntax</strong> <strong>in</strong> Identify<strong>in</strong>g <strong>the</strong> <strong>Relationship</strong><strong>Between</strong> <strong>Space</strong> and Crime 4215. Conclusions and future workOur review <strong>of</strong> past work on <strong>the</strong> crime-design l<strong>in</strong>k, toge<strong>the</strong>r with our space syntax analysis<strong>of</strong> crime <strong>in</strong> <strong>the</strong> Ypsilanti area suggest fur<strong>the</strong>r opportunities for future work. In summary,some variables suggested by previous research were not significant <strong>in</strong> this study. <strong>The</strong>se aremedian <strong>in</strong>come, racial composition, and <strong>of</strong> level <strong>of</strong> education. Interest<strong>in</strong>gly, both youthconcentration and percentage <strong>of</strong> owners <strong>in</strong>fluenced crime rates only through <strong>the</strong>ir <strong>in</strong>teractionwith connectivity. However, careful explorations <strong>in</strong>to <strong>the</strong> nature <strong>of</strong> <strong>the</strong>se <strong>in</strong>teractionsat each <strong>of</strong> <strong>the</strong> 21 block groups are needed.<strong>The</strong> o<strong>the</strong>r recommendation for future research is to exam<strong>in</strong>e <strong>the</strong> differences between<strong>the</strong> f<strong>in</strong>d<strong>in</strong>gs <strong>of</strong> this study and o<strong>the</strong>r similar work by Hillier and Shu. In <strong>the</strong>ir study,Hillier and Shu (2000) expla<strong>in</strong>ed that highly <strong>in</strong>tegrated streets encouraged more pedestrianmovement, which <strong>in</strong> turn added more eyes on <strong>the</strong> street. Thus, <strong>in</strong>tegrated streets are morelikely to be safer. However, this explanation is more likely to hold true <strong>in</strong> places wherewalk<strong>in</strong>g behavior is part <strong>of</strong> <strong>the</strong> lifestyle. Unfortunately, <strong>in</strong> <strong>the</strong> United States, particularly<strong>in</strong> Michigan, people are more automobile dependent and walk<strong>in</strong>g is rarely used as a modeto commute to work or to grocery stores. Needless to say, <strong>the</strong> unit <strong>of</strong> analysis <strong>in</strong> bothstudies is different. Hillier and Shu (2000) looked at <strong>the</strong> mean <strong>in</strong>tegration and <strong>the</strong> meanconnectivity <strong>of</strong> neighborhoods while this study considered axial l<strong>in</strong>es as <strong>the</strong> unit <strong>of</strong> analysis.F<strong>in</strong>ally, a careful <strong>in</strong>vestigation <strong>in</strong>to <strong>the</strong> effect <strong>of</strong> space syntax measures on differenttypes <strong>of</strong> crime is also important. Build<strong>in</strong>g on previous literature, some <strong>of</strong> <strong>the</strong>se crimesshare different objectives and crim<strong>in</strong>als have different motives for committ<strong>in</strong>g a crimewhe<strong>the</strong>r it is to burglarize a property or snatch a purse on <strong>the</strong> street (Davidson, 1993).Time is also <strong>of</strong> a critical factor. To conclude, space syntax techniques appear to add apromis<strong>in</strong>g new tool to exam<strong>in</strong>e <strong>the</strong> implications <strong>of</strong> spatial layout characteristics on crimeoutcomes. However, this is a complex issue that will require multi-faceted analyses todevelop tenable solutions.6. AcknowledgementsWe would like to credit Brady West, computer systems consultant at <strong>the</strong> Center forStatistical Consultation and Research at <strong>the</strong> University <strong>of</strong> Michigan, for his assistance <strong>in</strong><strong>the</strong> statistical analysis.LiteratureBennett, T., (1989) Burglars’ choice <strong>of</strong> targets, <strong>in</strong>: Evans, D. & Herbert, D. (eds.),<strong>The</strong> Geography <strong>of</strong> Crime, New York, Routledge.Bennett, T. and Wright, R.,(1984) Burglars on Burglary: Prevention and <strong>the</strong> Offender,Brookfield, Gower.Davidson, N, (1993) New Directions <strong>in</strong> Environmental Crim<strong>in</strong>ology, <strong>in</strong>: Jones, H (ed.),Crime and <strong>the</strong> Urban Environment: <strong>The</strong> Scottish Experience, Aveburg, Ashgate Publish<strong>in</strong>gLimited.Colquhoun, I., (2004) Design Out Crime: Creat<strong>in</strong>g Safe and Susta<strong>in</strong>able Communities,Oxford, Architectural Press.Crowe, T. D., (2000) Crime Prevention Through Environmental Design: Applications<strong>of</strong> Architectural Design and <strong>Space</strong> Management Concepts (2nd ed.), Oxford,Butterworth-He<strong>in</strong>emann.
422 L<strong>in</strong>da Nubani and Jean W<strong>in</strong>emanDunn, C., (1980) Crime Area Research, <strong>in</strong>: Georges, D., and Harris, K., (eds.), Crime:A Spatial Perspective, New York, Columbia Press.FBI Uniform Crime Report, (1998) http : //www.fbi.gov/ucr/Cius 9 8/98crime/98cius02.pdfGosnells W<strong>in</strong>s <strong>the</strong> Fight Aga<strong>in</strong>st Crime, (2003) Australia’sNationalGovernment Newspaper Onl<strong>in</strong>e. http : //www.loc − gov −focus.aus.net/editions/2003/april/gosnells.shtmlHill, G., & Hill, K., (1995) <strong>The</strong> Real Life Dictionary <strong>of</strong> <strong>the</strong> Law, Los Angeles, GeneralPublish<strong>in</strong>g Group.Hillier, B., & Hanson, J., (1984)] <strong>The</strong> social logic <strong>of</strong> space, Cambridge, CambridgeUniversity Press.Hillier, B. and Shu, S., (2000) Crime and Urban Layout: <strong>The</strong> Need for Evidence, <strong>in</strong>:Ball<strong>in</strong>tyne, S., Pease, K. and McLaren, V., Secure Foundations: Key Issues <strong>in</strong> CrimePrevention, Crime Reduction and Community Safety, London, IPPR.Jacobs, J., (1961) <strong>The</strong> death and life <strong>of</strong> great American cities, New York, V<strong>in</strong>tageBooks.Jones, M. & Fanek, M., (1997) Crime <strong>in</strong> <strong>the</strong> Urban Environment, Proceed<strong>in</strong>gs <strong>of</strong><strong>Space</strong> <strong>Syntax</strong> First International Symposium, London.Klaus, P., (1994) <strong>The</strong> Costs <strong>of</strong> Crime to Victims, U.S. Department <strong>of</strong> Justice, http ://www.ojp.usdoj.gov/bjs/pub/ascii/coctv.txtNewman, O., (1973) Defensible <strong>Space</strong>; Crime Prevention through Urban Design, NewYork, Collier Books.Reid, S. T., (2002) Crime and Crim<strong>in</strong>ology, New York, McGraw Hill.Rengert, G., (1980) Spatial Aspects <strong>of</strong> Crim<strong>in</strong>al Behavior, <strong>in</strong>: Georges, D., and Harris,K., (eds.), Crime: A Spatial Perspective, New York, Columbia Press.Rubenste<strong>in</strong>, H., (1981) <strong>The</strong> l<strong>in</strong>k between crime and <strong>the</strong> built environment: <strong>the</strong> currentstate <strong>of</strong> knowledge, Wash<strong>in</strong>gton, U.S. Department <strong>of</strong> Justice, National Institute <strong>of</strong>Justice.Shu, S., (2000) ”Hous<strong>in</strong>g Layout and Crime Vulnerability”, Urban Design International,(5.3-4), p.177-188.Shu, S. & Huang, J., (2003) Spatial Configuration and Vulnerability <strong>of</strong> residentialburglary: A case study <strong>of</strong> a city <strong>in</strong> Taiwan, <strong>in</strong>: Proceed<strong>in</strong>gs <strong>of</strong> <strong>the</strong> 4th International<strong>Space</strong> <strong>Syntax</strong> Symposium, London.Taylor, R. B., (2002) Crime prevention through environmental design: Yes, No,Maybe, Unknowable, and All <strong>of</strong> <strong>the</strong> Above, <strong>in</strong>: Bechtel, R. and Churchman, A.(eds.), Handbook <strong>of</strong> Environmental Psychology, New York, John Wiley and Sons, p.413-426.Victim Characteristics, (2003) Bureau <strong>of</strong> Justice Statistics,www.ojp.usdoj.gov/bjs/Ypsilanti MI Crime Statistics, (2002) AreaConnect, http ://www.ypsilanti.areaconnect.com/crime1.htm