CANADIAN MEDICAL DEVICES INDUSTRY - LifeSciences BC
CANADIAN MEDICAL DEVICES INDUSTRY - LifeSciences BC
CANADIAN MEDICAL DEVICES INDUSTRY - LifeSciences BC

You also want an ePaper? Increase the reach of your titles
YUMPU automatically turns print PDFs into web optimized ePapers that Google loves.
<strong>CANADIAN</strong> <strong>MEDICAL</strong> DEVICE <strong>INDUSTRY</strong><br />
The medical device industry consists of firms that produce a wide range of products used for diagnosis and treatment of<br />
ailments, and which include the following: medical, surgical and dental equipment (including electromedical equipment<br />
and related software), furniture, supplies and consumables, orthopaedic appliances, prosthetics and diagnostic kits,<br />
reagents, and equipment. Firms that are active only in distribution are not included in this profile 1 .<br />
Size and Structure of the Industry<br />
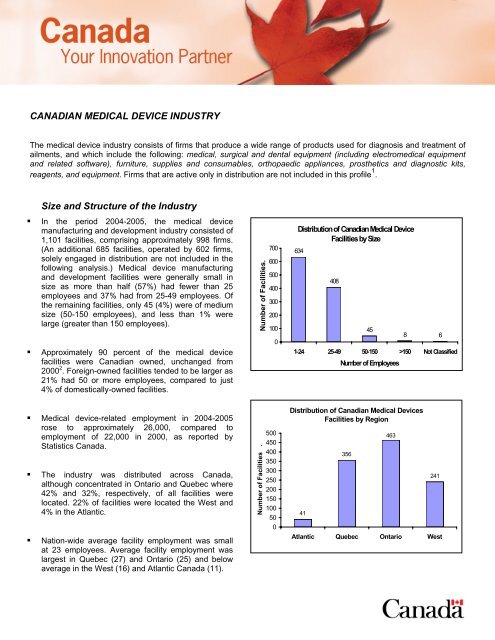
• In the period 2004-2005, the medical device<br />
manufacturing and development industry consisted of<br />
1,101 facilities, comprising approximately 998 firms.<br />
(An additional 685 facilities, operated by 602 firms,<br />
solely engaged in distribution are not included in the<br />
following analysis.) Medical device manufacturing<br />
and development facilities were generally small in<br />
size as more than half (57%) had fewer than 25<br />
employees and 37% had from 25-49 employees. Of<br />
the remaining facilities, only 45 (4%) were of medium<br />
size (50-150 employees), and less than 1% were<br />
large (greater than 150 employees).<br />
• Approximately 90 percent of the medical device<br />
facilities were Canadian owned, unchanged from<br />
2000 2 . Foreign-owned facilities tended to be larger as<br />
21% had 50 or more employees, compared to just<br />
4% of domestically-owned facilities.<br />
Number of Facilities.<br />
700<br />
600<br />
500<br />
400<br />
300<br />
200<br />
100<br />
0<br />
Distribution of Canadian Medical Device<br />
Facilities by Size<br />
634<br />
408<br />
45<br />
8 6<br />
1-24 25-49 50-150 >150 Not Classified<br />
Number of Employees<br />
• Medical device-related employment in 2004-2005<br />
rose to approximately 26,000, compared to<br />
employment of 22,000 in 2000, as reported by<br />
Statistics Canada.<br />
• The industry was distributed across Canada,<br />
although concentrated in Ontario and Quebec where<br />
42% and 32%, respectively, of all facilities were<br />
located. 22% of facilities were located the West and<br />
4% in the Atlantic.<br />
• Nation-wide average facility employment was small<br />
at 23 employees. Average facility employment was<br />
largest in Quebec (27) and Ontario (25) and below<br />
average in the West (16) and Atlantic Canada (11).<br />
Number of Facilities .<br />
500<br />
450<br />
400<br />
350<br />
300<br />
250<br />
200<br />
150<br />
100<br />
50<br />
0<br />
Distribution of Canadian Medical Devices<br />
Facilities by Region<br />
41<br />
356<br />
463<br />
241<br />
Atlantic Quebec Ontario West
Industry Revenues Depend Significantly on<br />
Exports<br />
• In 2003, Canadian firms generated approximately<br />
$4.0 billion 3 from medical device sales in Canada<br />
and abroad, of which over half ($2.1 billion) were due<br />
to exports. With $3.8 billion in medical device<br />
imports, the size of the Canadian apparent medical<br />
device domestic market was just under $6.0 billion.<br />
• Canada’s exports of medical devices increased at a<br />
solid compound annual growth rate (CAGR) of 10.5%<br />
from 2000-2005 as exports increased from $1.6<br />
billion in 2000 to $2.4 billion in 2005. During the<br />
same period, import growth was also strong although<br />
lower at a CAGR of 6.5%. Despite the higher CAGR<br />
of exports compared to imports, the significantly<br />
higher level of imports resulted in the medical device<br />
trade deficit having increased slightly from $1.8 billion<br />
in 2000 to $1.9 billion in 2005.<br />
• The United States remains overwhelmingly the<br />
primary market for Canadian medical device exports<br />
and the destination for 76% of all medical device<br />
exports in 2005. However, there is an increasing<br />
diversification of destination markets for Canadian<br />
medical devices as the export share destined for the<br />
United States has decreased in each of the last three<br />
years and is down sharply from 87% in 2002. In<br />
2005, the other growing export markets for Canada<br />
were the United Kingdom, a destination for 4% of<br />
Canadian medical device exports, Germany (3%)<br />
and China (2%). Since 2000, the most rapidly<br />
expanding export markets, as measured by sales<br />
CAGR, were China (168%), Singapore (93%), South<br />
Africa (83%) and South Korea (79%).<br />
• Since 2000, there has also been a shift in the source<br />
of Canada’s medical device imports. Although the<br />
United States still accounted for over half of all<br />
imports in 2005 at 54%, the share is down from 68%<br />
in 2000. During this period, both Germany (8%) and<br />
China (6%) have doubled their share of the Canadian<br />
market by way of sales CAGRs of 27% and 29%,<br />
respectively. Higher average growth rates were also<br />
posted by imports from Ireland (65%), Mexico (36%)<br />
and Australia (29%), although their shares of total<br />
imports remain at 3% or less.<br />
• Canada’s trade in medical device products is<br />
categorized using the Harmonized System (HS). The<br />
accompanying tables list the top ten exports (using<br />
2<br />
$ Billions<br />
the 8-digit classification) and the top ten imports<br />
(using the 10-digit classification) according to dollar<br />
value and share of total dollar value.<br />
5.0<br />
4.0<br />
3.0<br />
2.0<br />
1.0<br />
0.0<br />
Canadian Medical Devices Exports and<br />
Imports<br />
1.6<br />
3.4<br />
1.8<br />
3.9 3.8 3.9 4.0<br />
1.9<br />
2.1 2.2<br />
2000 2001 2002 2003 2004 2005<br />
Exports<br />
Imports<br />
Canadian Exports of Medical Devices by HS Code, 2005<br />
Billions $<br />
Total Exports 2.40<br />
2.4<br />
4.3<br />
Share of Total<br />
Exports<br />
Top Ten Exports by HS code (8-Digit Level)<br />
Sanitary articles of paper, incl sanit towels & napkins (diapers) for babies 0.56 23%<br />
Mechano-therapy appl; massage app; psychological aptitude-testing apparatus 0.19 8%<br />
Opacifying prep, x-ray; diagnostic reagents, designed for admin to patients 0.19 8%<br />
Electro-diagnostic apparatus, nes 0.16 7%<br />
Composite diagnostic or laboratory reagents, nes, 0.15 6%<br />
Instruments and appliances used in medical or veterinary sciences, nes 0.12 5%<br />
Medical, surgical, dental or veterinary furniture and parts nes 0.11 5%<br />
Electro-cardiographs 0.10 4%<br />
Parts and accessories for app based on the use of X-rays or other radiations 0.07 3%<br />
Oxygen therapy, artificial respiration or other therapeutic respiration app 0.06 2%<br />
Top Ten Exports by HS Code 1.70 71%<br />
All other HS codes 0.69 29%<br />
Source: Statistics Canada, World Trade Atlas<br />
Canadian Imports of Medical Devices by HS Code, 2005<br />
Billions $<br />
Total Imports 4.33<br />
Share of Total<br />
Imports<br />
Top Ten Imports by HS code (10-Digit Level)<br />
Diagnostic reagent,w/n on a backing,for med diagnosis/mfr semi condu device/etc 0.36 8%<br />
Instruments & appliances used in medical,surgical,dental/veterinary science,nes 0.34 8%<br />
Bougies, catheters, drains and sondes, and parts and accessories thereof 0.24 5%<br />
Mechano-therapy appl; pwr-op message appl; psychological aptitude-testing app 0.18 4%<br />
Cannulae and the like, nes 0.16 4%<br />
Instruments and appliances, used in dental science, nes 0.15 3%<br />
Appliances which are worn or carried or implanted in the body nes 0.15 3%<br />
App based on the use of x-rays, for medical, surgical or veterinary uses, nes 0.13 3%<br />
Contact lenses 0.13 3%<br />
Pacemakers for stimulating heart muscles, excluding parts and accessories 0.11 2%<br />
Top Ten Imports by HS code 1.95 45%<br />
All other HS codes 2.38 55%<br />
Source: Statistics Canada, World Trade Atlas
Canadian Technology Strength Supports<br />
Innovation<br />
• The manufacturing of medical devices involves the<br />
application of diverse biomedical and engineering<br />
disciplines. The Canadian medical device industry<br />
benefits from the strengths of associated Canadian<br />
industries including biotechnology, advanced<br />
materials, microelectronics, telecommunications, and<br />
software and informatics.<br />
• In addition, the industry is able to draw on worldclass<br />
innovative research being conducted in<br />
Canadian universities, research institutes and<br />
hospitals. Nearly 10 percent of Canadian medical<br />
device firms are spin-offs of universities, other firms<br />
or laboratories 4 . A number of medical device firms<br />
work in collaboration with other organizations<br />
(universities, hospitals, smaller or larger firms,<br />
government departments, etc.).<br />
Medical Device Manufacturing Costs Lowest in G7<br />
• Total annual costs to establish and operate a medical<br />
device manufacturing facility in Canada are the<br />
lowest in the G7. (Source: Competitive Alternatives:<br />
KPMG’s Guide to International Business Costs, 2006<br />
Edition) Canada holds a 4.1 percent cost advantage<br />
over the United States in medical device<br />
manufacturing.<br />
• Canada’s lowest labour costs in the G7 contribute to<br />
this advantage. KPMG estimates that labour cost<br />
accounts for over 50% of location-sensitive cost in<br />
manufacturing and over 75% location-sensitive cost<br />
in services operations.<br />
Low R&D Costs<br />
• Canada offers the most favourable tax treatment for<br />
R&D among the G7 with a system of tax credits and<br />
accelerated tax deductions for a wide variety of R&D<br />
expenditures (including salaries, overhead, capital<br />
equipment and materials). (Source: Warda, Jacek,<br />
Rating Canada’s R&D Tax Treatment: A 2003<br />
Update, October 2003).<br />
• The federal and provincial tax-based incentives<br />
permit firms to significantly reduce R&D costs<br />
through direct investment or subcontracting in<br />
Canada.<br />
3<br />
Biotechnology<br />
Software and<br />
Informatics<br />
United Kingdom<br />
United States<br />
Canada<br />
Canada<br />
France<br />
Italy<br />
Japan<br />
Germany<br />
Telecommunications<br />
Medical Devices<br />
Advanced Materials<br />
Microelectronics<br />
G7 Medical Device Business Costs,<br />
(Index: US = 100)<br />
95.9<br />
96.6<br />
98.4<br />
98.5<br />
100<br />
106.1<br />
107.2<br />
90 95 100 105 110<br />
Source: Competitive Alternatives: KPMG's Guide to International Business Costs, 2006<br />
Edition<br />
U.S.<br />
Japan<br />
U.K.<br />
France<br />
Italy<br />
Germany<br />
Relative Generosity of R&D Tax Incentives*<br />
(Index: Canada = 100)<br />
0 20 40 60 80 100 120<br />
* Does not include Ontario's 2003 cuts to corporate income tax rates.<br />
Source: Warda, Jacek, Rating Canada's R&D Tax Treatment: A 2003 Update , October 2003.<br />
71<br />
71<br />
77<br />
80<br />
85<br />
84<br />
100
Regulatory Process Emphasizes Harmonization<br />
• Canada’s regulatory process for medical devices<br />
increasingly emphasizes harmonization and<br />
reciprocity. Canada has a risk-based system of<br />
regulation in keeping with international trends.<br />
• The Food and Drugs Act permits Canadian<br />
manufacturers to export product in accordance with<br />
the receiving country's laws, irrespective of domestic<br />
approval status. This export provision has prompted<br />
some foreign-owned companies to establish export<br />
manufacturing from a Canadian base.<br />
Supportive Network of Industry Associations<br />
• Companies in Canada’s medical device industry<br />
are supported by a number of national and regional<br />
associations, including: MEDEC - Canada’s Medical<br />
Device Technology Companies; Alberta Health<br />
Industry Alliance; Association of Health<br />
Technologies Industry (Quebec); BioNova (Nova<br />
Scotia); <strong>BC</strong> MedTech (British Columbia); Health<br />
Care Products Association of Manitoba; Ottawa Life<br />
Sciences Council; and Trillium Medical Technology<br />
Association (Ontario).<br />
Federally Funded Research Support Programs<br />
• Several federally-funded research programs and<br />
councils support health-related research in Canada:<br />
the Canadian Institutes for Health Research (CIHR);<br />
Networks of Centres of Excellence; National<br />
Research Council (NRC); and the Natural Sciences<br />
and Engineering Research Council (NSERC).<br />
Commercialization Initiatives<br />
• Sectoral initiatives to facilitate technology<br />
commercialization include efforts by organizations<br />
such as the Health Technology Exchange (HTX)<br />
(www.htx.ca), Westlink Innovation Network Ltd.<br />
(www.westlink.ca), and NRC’s Centre for<br />
Commercialization of Biomedical Technology<br />
(http://ibd.nrc-cnrc.gc.ca/ibd_external/ccbt/index.html).<br />
2 Statistics Canada, Medical Device Industry Survey 2000.<br />
3 Based on the average of estimates by Rozinski ($3.7 billion) and E&B<br />
Data ($4.5 billion).<br />
4 Statistics Canada, Medical Device Industry Survey 2000.<br />
<br />
<br />
<br />
<br />
<br />
Hot Links of Interest<br />
Industry Canada - Life Sciences Branch<br />
www.strategis.gc.ca/lsb<br />
Invest in Canada<br />
www.investincanada.gc.ca<br />
The Canadian Trade Commissioner Service<br />
www.infoexport.gc.ca<br />
Innovation in Canada<br />
www.innovation.gc.ca<br />
Medical Device Companies and Associations<br />
http://strategis.ic.gc.ca/epic/internet/inlsgpdsv.nsf/en/h_hn00041e.html<br />
Contacts: Mary Boreskie boreskie.mary@ic.gc.ca<br />
Robert Squires squires.robert2@ic.gc.ca<br />
1 Source of data unless otherwise specified: E&B Data collected in 2004 and<br />
2005 and Canadian International Merchandise Trade Database. The latter<br />
presents data using the Harmonized System (HS), thereby allowing for<br />
detailed analysis on a product/country basis.<br />
4