CANADIAN MEDICAL DEVICES INDUSTRY - LifeSciences BC
CANADIAN MEDICAL DEVICES INDUSTRY - LifeSciences BC
CANADIAN MEDICAL DEVICES INDUSTRY - LifeSciences BC

Create successful ePaper yourself
Turn your PDF publications into a flip-book with our unique Google optimized e-Paper software.
Industry Revenues Depend Significantly on<br />
Exports<br />
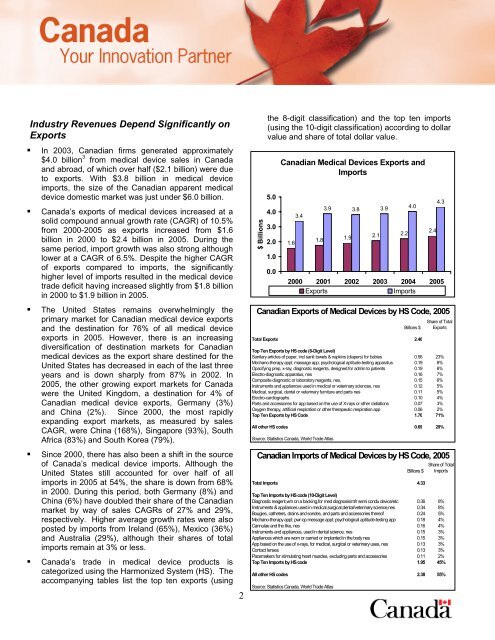
• In 2003, Canadian firms generated approximately<br />
$4.0 billion 3 from medical device sales in Canada<br />
and abroad, of which over half ($2.1 billion) were due<br />
to exports. With $3.8 billion in medical device<br />
imports, the size of the Canadian apparent medical<br />
device domestic market was just under $6.0 billion.<br />
• Canada’s exports of medical devices increased at a<br />
solid compound annual growth rate (CAGR) of 10.5%<br />
from 2000-2005 as exports increased from $1.6<br />
billion in 2000 to $2.4 billion in 2005. During the<br />
same period, import growth was also strong although<br />
lower at a CAGR of 6.5%. Despite the higher CAGR<br />
of exports compared to imports, the significantly<br />
higher level of imports resulted in the medical device<br />
trade deficit having increased slightly from $1.8 billion<br />
in 2000 to $1.9 billion in 2005.<br />
• The United States remains overwhelmingly the<br />
primary market for Canadian medical device exports<br />
and the destination for 76% of all medical device<br />
exports in 2005. However, there is an increasing<br />
diversification of destination markets for Canadian<br />
medical devices as the export share destined for the<br />
United States has decreased in each of the last three<br />
years and is down sharply from 87% in 2002. In<br />
2005, the other growing export markets for Canada<br />
were the United Kingdom, a destination for 4% of<br />
Canadian medical device exports, Germany (3%)<br />
and China (2%). Since 2000, the most rapidly<br />
expanding export markets, as measured by sales<br />
CAGR, were China (168%), Singapore (93%), South<br />
Africa (83%) and South Korea (79%).<br />
• Since 2000, there has also been a shift in the source<br />
of Canada’s medical device imports. Although the<br />
United States still accounted for over half of all<br />
imports in 2005 at 54%, the share is down from 68%<br />
in 2000. During this period, both Germany (8%) and<br />
China (6%) have doubled their share of the Canadian<br />
market by way of sales CAGRs of 27% and 29%,<br />
respectively. Higher average growth rates were also<br />
posted by imports from Ireland (65%), Mexico (36%)<br />
and Australia (29%), although their shares of total<br />
imports remain at 3% or less.<br />
• Canada’s trade in medical device products is<br />
categorized using the Harmonized System (HS). The<br />
accompanying tables list the top ten exports (using<br />
2<br />
$ Billions<br />
the 8-digit classification) and the top ten imports<br />
(using the 10-digit classification) according to dollar<br />
value and share of total dollar value.<br />
5.0<br />
4.0<br />
3.0<br />
2.0<br />
1.0<br />
0.0<br />
Canadian Medical Devices Exports and<br />
Imports<br />
1.6<br />
3.4<br />
1.8<br />
3.9 3.8 3.9 4.0<br />
1.9<br />
2.1 2.2<br />
2000 2001 2002 2003 2004 2005<br />
Exports<br />
Imports<br />
Canadian Exports of Medical Devices by HS Code, 2005<br />
Billions $<br />
Total Exports 2.40<br />
2.4<br />
4.3<br />
Share of Total<br />
Exports<br />
Top Ten Exports by HS code (8-Digit Level)<br />
Sanitary articles of paper, incl sanit towels & napkins (diapers) for babies 0.56 23%<br />
Mechano-therapy appl; massage app; psychological aptitude-testing apparatus 0.19 8%<br />
Opacifying prep, x-ray; diagnostic reagents, designed for admin to patients 0.19 8%<br />
Electro-diagnostic apparatus, nes 0.16 7%<br />
Composite diagnostic or laboratory reagents, nes, 0.15 6%<br />
Instruments and appliances used in medical or veterinary sciences, nes 0.12 5%<br />
Medical, surgical, dental or veterinary furniture and parts nes 0.11 5%<br />
Electro-cardiographs 0.10 4%<br />
Parts and accessories for app based on the use of X-rays or other radiations 0.07 3%<br />
Oxygen therapy, artificial respiration or other therapeutic respiration app 0.06 2%<br />
Top Ten Exports by HS Code 1.70 71%<br />
All other HS codes 0.69 29%<br />
Source: Statistics Canada, World Trade Atlas<br />
Canadian Imports of Medical Devices by HS Code, 2005<br />
Billions $<br />
Total Imports 4.33<br />
Share of Total<br />
Imports<br />
Top Ten Imports by HS code (10-Digit Level)<br />
Diagnostic reagent,w/n on a backing,for med diagnosis/mfr semi condu device/etc 0.36 8%<br />
Instruments & appliances used in medical,surgical,dental/veterinary science,nes 0.34 8%<br />
Bougies, catheters, drains and sondes, and parts and accessories thereof 0.24 5%<br />
Mechano-therapy appl; pwr-op message appl; psychological aptitude-testing app 0.18 4%<br />
Cannulae and the like, nes 0.16 4%<br />
Instruments and appliances, used in dental science, nes 0.15 3%<br />
Appliances which are worn or carried or implanted in the body nes 0.15 3%<br />
App based on the use of x-rays, for medical, surgical or veterinary uses, nes 0.13 3%<br />
Contact lenses 0.13 3%<br />
Pacemakers for stimulating heart muscles, excluding parts and accessories 0.11 2%<br />
Top Ten Imports by HS code 1.95 45%<br />
All other HS codes 2.38 55%<br />
Source: Statistics Canada, World Trade Atlas