Appl, Phys. Lett. 77, 4272
Appl, Phys. Lett. 77, 4272
Appl, Phys. Lett. 77, 4272

You also want an ePaper? Increase the reach of your titles
YUMPU automatically turns print PDFs into web optimized ePapers that Google loves.
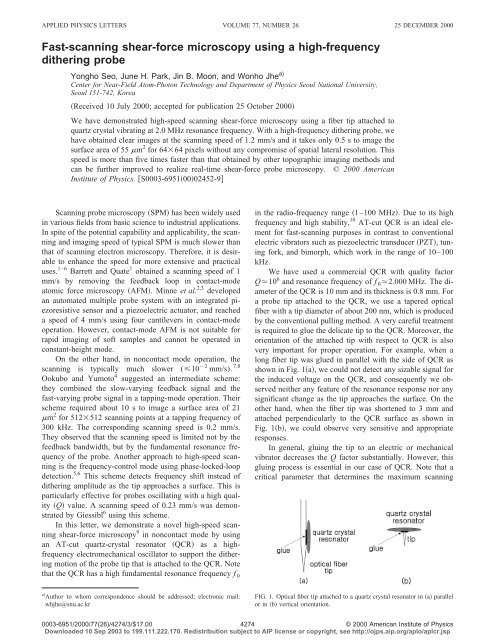
APPLIED PHYSICS LETTERS VOLUME <strong>77</strong>, NUMBER 26 25 DECEMBER 2000<br />
Fast-scanning shear-force microscopy using a high-frequency<br />
dithering probe<br />
Yongho Seo, June H. Park, Jin B. Moon, and Wonho Jhe a)<br />
Center for Near-Field Atom-Photon Technology and Department of <strong>Phys</strong>ics Seoul National University,<br />
Seoul 151-742, Korea<br />
Received 10 July 2000; accepted for publication 25 October 2000<br />
We have demonstrated high-speed scanning shear-force microscopy using a fiber tip attached to<br />
quartz crystal vibrating at 2.0 MHz resonance frequency. With a high-frequency dithering probe, we<br />
have obtained clear images at the scanning speed of 1.2 mm/s and it takes only 0.5 s to image the<br />
surface area of 55 m 2 for 6464 pixels without any compromise of spatial lateral resolution. This<br />
speed is more than five times faster than that obtained by other topographic imaging methods and<br />
can be further improved to realize real-time shear-force probe microscopy. © 2000 American<br />
Institute of <strong>Phys</strong>ics. S0003-69510002452-9<br />
Scanning probe microscopy SPM has been widely used<br />
in various fields from basic science to industrial applications.<br />
In spite of the potential capability and applicability, the scanning<br />
and imaging speed of typical SPM is much slower than<br />
that of scanning electron microscopy. Therefore, it is desirable<br />
to enhance the speed for more extensive and practical<br />
uses. 1–6 Barrett and Quate 1 obtained a scanning speed of 1<br />
mm/s by removing the feedback loop in contact-mode<br />
atomic force microscopy AFM. Minne et al. 2,3 developed<br />
an automated multiple probe system with an integrated piezoresistive<br />
sensor and a piezoelectric actuator, and reached<br />
a speed of 4 mm/s using four cantilevers in contact-mode<br />
operation. However, contact-mode AFM is not suitable for<br />
rapid imaging of soft samples and cannot be operated in<br />
constant-height mode.<br />
On the other hand, in noncontact mode operation, the<br />
scanning is typically much slower (10 2 mm/s). 7,8<br />
Ookubo and Yumoto 4 suggested an intermediate scheme:<br />
they combined the slow-varying feedback signal and the<br />
fast-varying probe signal in a tapping-mode operation. Their<br />
scheme required about 10 s to image a surface area of 21<br />
m 2 for 512512 scanning points at a tapping frequency of<br />
300 kHz. The corresponding scanning speed is 0.2 mm/s.<br />
They observed that the scanning speed is limited not by the<br />
feedback bandwidth, but by the fundamental resonance frequency<br />
of the probe. Another approach to high-speed scanning<br />
is the frequency-control mode using phase-locked-loop<br />
detection. 5,6 This scheme detects frequency shift instead of<br />
dithering amplitude as the tip approaches a surface. This is<br />
particularly effective for probes oscillating with a high quality<br />
Q value. A scanning speed of 0.23 mm/s was demonstrated<br />
by Giessibl 6 using this scheme.<br />
In this letter, we demonstrate a novel high-speed scanning<br />
shear-force microscopy 9 in noncontact mode by using<br />
an AT-cut quartz-crystal resonator QCR as a highfrequency<br />
electromechanical oscillator to support the dithering<br />
motion of the probe tip that is attached to the QCR. Note<br />
that the QCR has a high fundamental resonance frequency f 0<br />
in the radio-frequency range 1–100 MHz. Due to its high<br />
frequency and high stability, 10 AT-cut QCR is an ideal element<br />
for fast-scanning purposes in contrast to conventional<br />
electric vibrators such as piezoelectric transducer PZT, tuning<br />
fork, and bimorph, which work in the range of 10–100<br />
kHz.<br />
We have used a commercial QCR with quality factor<br />
Q10 6 and resonance frequency of f 0 2.000 MHz. The diameter<br />
of the QCR is 10 mm and its thickness is 0.8 mm. For<br />
a probe tip attached to the QCR, we use a tapered optical<br />
fiber with a tip diameter of about 200 nm, which is produced<br />
by the conventional pulling method. A very careful treatment<br />
is required to glue the delicate tip to the QCR. Moreover, the<br />
orientation of the attached tip with respect to QCR is also<br />
very important for proper operation. For example, when a<br />
long fiber tip was glued in parallel with the side of QCR as<br />
shown in Fig. 1a, we could not detect any sizable signal for<br />
the induced voltage on the QCR, and consequently we observed<br />
neither any feature of the resonance response nor any<br />
significant change as the tip approaches the surface. On the<br />
other hand, when the fiber tip was shortened to 3 mm and<br />
attached perpendicularly to the QCR surface as shown in<br />
Fig. 1b, we could observe very sensitive and appropriate<br />
responses.<br />
In general, gluing the tip to an electric or mechanical<br />
vibrator decreases the Q factor substantially. However, this<br />
gluing process is essential in our case of QCR. Note that a<br />
critical parameter that determines the maximum scanning<br />
a Author to whom correspondence should be addressed; electronic mail:<br />
whjhe@snu.ac.kr<br />
FIG. 1. Optical fiber tip attached to a quartz crystal resonator in a parallel<br />
or in b vertical orientation.<br />
4274<br />
0003-6951/2000/<strong>77</strong>(26)/4274/3/$17.00 © 2000 American Institute of <strong>Phys</strong>ics<br />
Downloaded 10 Sep 2003 to 199.111.222.170. Redistribution subject to AIP license or copyright, see http://ojps.aip.org/aplo/aplcr.jsp
<strong>Appl</strong>. <strong>Phys</strong>. <strong>Lett</strong>., Vol. <strong>77</strong>, No. 26, 25 December 2000<br />
Seo et al.<br />
4275<br />
FIG. 3. a Topographic and b dithering-amplitude images of aluminumcoated<br />
data pits of a commercial compact disk. The scanning speed is 0.5<br />
mm/s and total scanning time is 1.9 s.<br />
FIG. 2. Schematic of experimental setup including feedback loop. Inset<br />
shows a photograph of the QCR probe.<br />
speed is the decay time-constant given by )Q/ f 0 . 5 In<br />
a conventional tuning-fork probe, the settling time down to<br />
1% is 5100 ms. Since one cannot increase detection<br />
bandwidth much beyond the inverse of the settling time of<br />
the slowest system element that is, either actuator or sensor,<br />
we have to use low Q and high f 0 values to achieve a<br />
high scanning speed.<br />
We have found that the initial high Q value of the QCR<br />
decreases drastically depending on the amount of glue used<br />
to fix the fiber tip. With a high-Q probe (Q10 4 ), its dithering<br />
amplitude becomes unstable near the surface and thus<br />
no reliable control of the tip-sample separation was obtained.<br />
On the other hand, when Q is reduced down to 10 3 and f 0 is<br />
adjusted to 1.997 MHz, we could obtain reliable control and<br />
the settling time is now 51.4 ms. Note that this time constant<br />
is only 1% of that of a conventional tuning fork.<br />
Figure 2 shows a schematic of experimental setup. The<br />
QCR is mounted on an xyz-translation stage for coarse adjustment<br />
of the QCR position, whereas fine movement of the<br />
sample is controlled by a PZT tube that supports the sample<br />
stage. An ac-voltage v 0 from a frequency synthesizer is applied<br />
to a QCR electrode and an induced voltage v is produced<br />
on the other electrode of QCR, which is then amplified<br />
and rectified. The resulting dc signal a, which is proportional<br />
to the amplitude of v, is sent to an integrator that has an<br />
offset-reference voltage a 0 . For the integrator output-voltage<br />
V PZT that is, error signal, the integration time-constant or<br />
response time is given by RC45 s and this is 100 times<br />
longer than the oscillation period of QCR(T0.5 s).<br />
Note that the dithering frequency of QCR is much higher<br />
than the fiber-tip resonance. Therefore, instead of flexural<br />
motion, translational motion of the tip occurs, making the<br />
dithering amplitude same as the shear distortion of the QCR<br />
itself. Since the distortion is very small e.g., 10 2 Å for<br />
v 0 1V), v 0 can be increased enough to obtain a large induced<br />
signal v without any compromise in spatial resolution.<br />
Consequently, the dithering amplitude can be easily measured<br />
by directly rectifying the signal v without using<br />
lock-in detection. This not only simplifies feedback loop, but<br />
also facilitates high-speed scanning.<br />
For a test sample, we have used a commercial compact<br />
disk that has data pits with 1.2 m pitch. Figure 3a shows<br />
a topographic image obtained from integrator output V PZT ,<br />
whereas Fig. 3b provides a corresponding ditheringamplitude<br />
image. The pixel size is 128128, the scanned<br />
area is 55 m 2 , and the total scanning time is 1.9 s. The<br />
scanning speed is found to be 0.5 mm/s, which is twice faster<br />
than the result in Ref. 3. As can be seen, pits are clearly<br />
observable and well resolved in detail. In addition, from the<br />
insets showing cross-sectional profiles along the white line in<br />
each image, the spatial resolution can be estimated to be<br />
around 200 nm, which is in good agreement with the diameter<br />
of the probe tip itself.<br />
In principle, the achieved spatial resolution of shearforce<br />
microscopy is not sacrificed by fast scanning speed and<br />
is mainly determined by tip diameter and dithering amplitude.<br />
However, tip diameter obtained by the pulling method<br />
100 nm is typically much larger than the dithering amplitude<br />
1 nm. Therefore, the resolution is mainly determined<br />
by the tip diameter. In the inset, the distance between<br />
measured points is about 130 nm, which is smaller than the<br />
tip radius. Consequently, 128128 points of measurement<br />
are enough to achieve full imaging resolution without any<br />
loss of resolution due to fast scanning.<br />
If shear-force distance control is perfect, the dithering<br />
amplitude a should be equal to a 0 . However, a typically<br />
exhibits variations that correspond to sample topography that<br />
comes from error signal. This means that the scanning time<br />
is slightly faster than the response time of feedback loop. As<br />
mentioned before, this is equivalent to the intermediate<br />
scheme presented in Ref. 3. We find that the time interval of<br />
120 s taken per pixel is three times longer than the RC time<br />
constant and 200 times longer than the dithering period. In<br />
other words, during scanning of each pixel, the probe is dithered<br />
200 times.<br />
This may be quite redundant and there is a certain possibility<br />
to reduce the amount of dithering for faster scanning.<br />
Consequently, we could obtain images taken at a faster scanning<br />
speed, as presented in Figs. 4a and 4b. The same<br />
surface area is now scanned at a speed of 1.2 mm/s for 64<br />
64 pixels. Note that this scanning speed is even faster than<br />
that of nonfeedback scanning scheme. 1 Moreover, pits of the<br />
sample are clearly observed with reasonable quality of image<br />
as well as similar lateral resolution. While we obtain a clear<br />
topographic image as in Fig. 4a, the error-signal image in<br />
Fig. 4b shows slight footprints of the pits. This indicates<br />
that the bandwidth of the feedback control is sufficient to<br />
Downloaded 10 Sep 2003 to 199.111.222.170. Redistribution subject to AIP license or copyright, see http://ojps.aip.org/aplo/aplcr.jsp
4276 <strong>Appl</strong>. <strong>Phys</strong>. <strong>Lett</strong>., Vol. <strong>77</strong>, No. 26, 25 December 2000 Seo et al.<br />
images at the fastest scanning speed of 1.2 mm/s. We emphasize<br />
that the resolving power of shear-force microscopy is<br />
not compromised by the fast scanning speed. Furthermore,<br />
with the increase of feedback bandwidth, we expect to improve<br />
further our scanning system so that real-time optical<br />
imaging using a high-speed near-field optical microscopy<br />
may be feasible work is under progress.<br />
FIG. 4. Same as Fig. 3 except that the scanning speed is 1.2 mm/s. The total<br />
scanning time is 0.5 s.<br />
follow the surface topograph. In particular, it should be emphasized<br />
that only 0.5 s is taken to take such an almost<br />
real-time image. Note that the inset in Fig. 4a shows a<br />
cross-sectional profile where the distance between each measurement<br />
point is 140 nm. This is similar to that obtained at<br />
a lower scanning speed of 0.5 mm/s, as shown in Fig. 3.<br />
In summary, we have demonstrated a general use of<br />
QCR as a high-frequency dithering probe in SPM. Because<br />
of its high resonance frequency and small dithering amplitude,<br />
a QCR probe facilitates high-speed scanning as well as<br />
high lateral resolution. We have obtained clear topographic<br />
The authors are grateful to M. R. Kim for helpful discussions.<br />
This work was supported by the Creative Research<br />
Initiatives of the Korean Ministry of Science and Technology.<br />
1 R. C. Barrett and C. F. Quate, J. Vac. Sci. Technol. B 9, 3021991.<br />
2 S. C. Minne, S. R. Manalis, and C. F. Quate, <strong>Appl</strong>. <strong>Phys</strong>. <strong>Lett</strong>. 67, 3918<br />
1995.<br />
3 S. C. Minne, G. Yaralioglu, S. R. Manalis, J. D. Adams, J. Zesch, A.<br />
Atalar, and C. F. Quate, <strong>Appl</strong>. <strong>Phys</strong>. <strong>Lett</strong>. 72, 2340 1998.<br />
4 N. Ookubo and S. Yumoto, <strong>Appl</strong>. <strong>Phys</strong>. <strong>Lett</strong>. 74, 2149 1999.<br />
5 W. A. Atia and C. C. Davis, <strong>Appl</strong>. <strong>Phys</strong>. <strong>Lett</strong>. 70, 4051997.<br />
6 F. J. Giessibl, <strong>Appl</strong>. <strong>Phys</strong>. <strong>Lett</strong>. 73, 39561998.<br />
7 K. Karrai and R. D. Grober, <strong>Appl</strong>. <strong>Phys</strong>. <strong>Lett</strong>. 66, 1842 1995.<br />
8 K. H. Kim, S. K. Eah, B. Lee, C. H. Cho, and W. Jhe, Rev. Sci. Instrum.<br />
68, 2783 1997.<br />
9 E. Betzig, P. L. Finn, and J. S. Weiner, <strong>Appl</strong>. <strong>Phys</strong>. <strong>Lett</strong>. 60, 24841992;<br />
R. Toledo-Crow, P. C. Yang, Y. Chen, and M. Vaez-Iravani, ibid. 60,<br />
2957 1992.<br />
10 V. E. Bottom, Introduction to Quartz Crystal Unit Design Van Nostrand<br />
Reinhold, New York, 1997, p.62.<br />
Downloaded 10 Sep 2003 to 199.111.222.170. Redistribution subject to AIP license or copyright, see http://ojps.aip.org/aplo/aplcr.jsp