Future Society in 2024: 21st Century 'Good Life' - Rural Economy ...
Future Society in 2024: 21st Century 'Good Life' - Rural Economy ...
Future Society in 2024: 21st Century 'Good Life' - Rural Economy ...

Create successful ePaper yourself
Turn your PDF publications into a flip-book with our unique Google optimized e-Paper software.
So, for example for the driver ‘the proportion of people work<strong>in</strong>g <strong>in</strong> agriculture’ we gave three possible<br />
outcomes for <strong>2024</strong> – to <strong>in</strong>crease, to stay the same or to decrease. If the proportion <strong>in</strong> agricultural<br />
employment decreased then we felt, <strong>in</strong> terms of the relative importance of the typologies, that deep<br />
rural, peripheral amenity and dynamic rural would decl<strong>in</strong>e while retirement retreats, transient rural,<br />
dynamic commuter, and settled commuter would all ga<strong>in</strong>, <strong>in</strong> relative terms. The model ensured that<br />
the result was a zero sum game i.e. the ga<strong>in</strong>s and losses for the various typologies would be offset<br />
each other.<br />
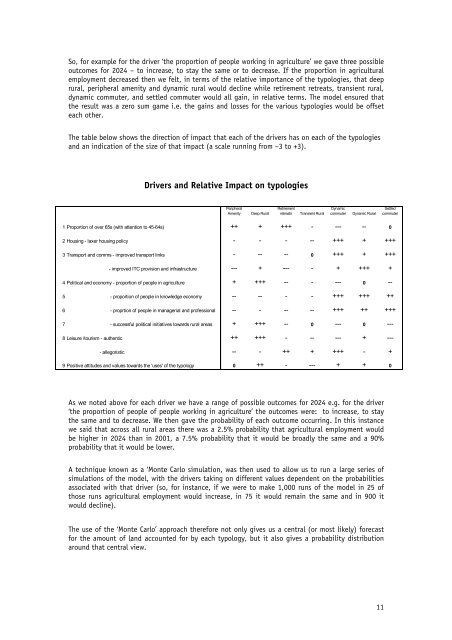
The table below shows the direction of impact that each of the drivers has on each of the typologies<br />
and an <strong>in</strong>dication of the size of that impact (a scale runn<strong>in</strong>g from –3 to +3).<br />
Drivers and Relative Impact on typologies<br />
Peripheral<br />
Amenity<br />
Deep <strong>Rural</strong><br />
Retirement<br />
retreats<br />
Transient <strong>Rural</strong><br />
Dynamic<br />
commuter<br />
Dynamic <strong>Rural</strong><br />
Settled<br />
commuter<br />
1 Proportion of over 65s (with attention to 45-64s) ++ + +++ - --- -- 0<br />
2 Hous<strong>in</strong>g - laxer hous<strong>in</strong>g policy - - - -- +++ + +++<br />
3 Transport and comms - improved transport l<strong>in</strong>ks - -- -- 0 +++ + +++<br />
- improved ITC provision and <strong>in</strong>frastructure --- + --- - + +++ +<br />
4 Political and economy - proportion of people <strong>in</strong> agriculture + +++ -- - --- 0 --<br />
5 - proportion of people <strong>in</strong> knowledge economy -- -- - - +++ +++ ++<br />
6 - proprtion of people <strong>in</strong> managerial and professional -- - -- -- +++ ++ +++<br />
7 - successful political <strong>in</strong>itiatives towards rural areas + +++ -- 0 --- 0 ---<br />
8 Leisure /tourism - authentic ++ +++ - -- --- + ---<br />
- allegoristic -- - ++ + +++ - +<br />
9 Positive attitudes and values towards the 'uses' of the typology 0 ++ - --- + + 0<br />
As we noted above for each driver we have a range of possible outcomes for <strong>2024</strong> e.g. for the driver<br />
‘the proportion of people of people work<strong>in</strong>g <strong>in</strong> agriculture’ the outcomes were: to <strong>in</strong>crease, to stay<br />
the same and to decrease. We then gave the probability of each outcome occurr<strong>in</strong>g. In this <strong>in</strong>stance<br />
we said that across all rural areas there was a 2.5% probability that agricultural employment would<br />
be higher <strong>in</strong> <strong>2024</strong> than <strong>in</strong> 2001, a 7.5% probability that it would be broadly the same and a 90%<br />
probability that it would be lower.<br />
A technique known as a ‘Monte Carlo simulation, was then used to allow us to run a large series of<br />
simulations of the model, with the drivers tak<strong>in</strong>g on different values dependent on the probabilities<br />
associated with that driver (so, for <strong>in</strong>stance, if we were to make 1,000 runs of the model <strong>in</strong> 25 of<br />
those runs agricultural employment would <strong>in</strong>crease, <strong>in</strong> 75 it would rema<strong>in</strong> the same and <strong>in</strong> 900 it<br />
would decl<strong>in</strong>e).<br />
The use of the ‘Monte Carlo’ approach therefore not only gives us a central (or most likely) forecast<br />
for the amount of land accounted for by each typology, but it also gives a probability distribution<br />
around that central view.<br />
11