Ch. 3: pt 2 - Mathematical Sciences Home Pages
Ch. 3: pt 2 - Mathematical Sciences Home Pages
Ch. 3: pt 2 - Mathematical Sciences Home Pages

You also want an ePaper? Increase the reach of your titles
YUMPU automatically turns print PDFs into web optimized ePapers that Google loves.
<strong>Ch</strong>a<strong>pt</strong>er 3: DISCRETE<br />
RANDOM VARIABLES AND<br />
PROBABILITY DISTRIBUTIONS<br />
Part 2: Mean and Variance of a<br />
Discrete Random Variable<br />
Section 3-4<br />
In a random experiment, there are a variety of<br />
possible outcomes.<br />
What outcome do we expect to see?<br />
Some outcomes may be more likely than others.<br />
Note: an expectation or expected value<br />
has a specific mathematical meaning...<br />
1
• Mean of a Discrete Random Variable<br />
The mean or expected value of a discrete random<br />
variable X, denoted as µ or E(X), is<br />
µ = E(X) = ∑ x<br />
x · f(x) = ∑ x<br />
x · P (X = x)<br />
Example: Consider the random variable X<br />
and associated probability mass function defined<br />
by P (X = 0) = 0.20, P (X = 1) = 0.30, and<br />
P (X = 2) = 0.50.<br />
The expected value of X or E(X) by the definition<br />
above is<br />
E(X) = 0 · P (X = 0) + 1 · P (X = 1) + 2 · P (X = 2)<br />
= 0 · 0.20 + 1 · 0.30 + 2 · 0.50 = 1.30 ∗<br />
∗ Note that eventhough X can only take on a value of 0, 1, or 2,<br />
the expected value can fall anywhere on the real number line.<br />
2
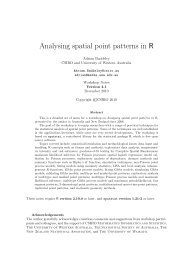
E(X) = 1.30<br />
Though the possible values for X are 0, 1, and<br />
2, the expected value is closer to 2 because 2 is<br />
more ‘heavily weighted’, or more likely to occur.<br />
The mean of a discrete random variable X is<br />
a weighted average of the possible values of X,<br />
with weights equal to the probabilities.<br />
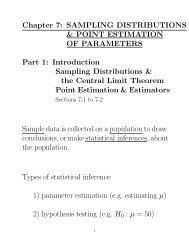
A probability distribution can be viewed as a<br />
loading with a mean equal to the balance point<br />
(shown as dark triangles). Parts (a) and (b)<br />
above illustrate equal means from very different<br />
loadings (or distributions).<br />
3
In statistics, the mean is a measure of center<br />
for a distribution.<br />
• Example: Cylinders in the engine of a car<br />
Let X be the number of cylinders in the engine<br />
of the next car to be tuned up at a certain<br />
facility. Based on past data, the probability<br />
mass function for X is the following:<br />
x 4 6 8<br />
f(x) 0.55 0.25 0.20<br />
The cost, h, of a tune-up is a function of X.<br />
Specifically, we let the cost be represented as<br />
the function h(X), and<br />
h(X) = 20 + 3X + 0.5X 2<br />
{ cars with more cylinders cost more to tune-up }<br />
Find the expected cost of the next tune-up,<br />
or E[h(X)].<br />
4
Find E[h(X)].<br />
5
• Expected Value of a Function of a<br />
Discrete Random Variable<br />
- If X is a discrete random variable with<br />
probability mass function f(x),<br />
E[(h(X)] = ∑ x<br />
= ∑ x<br />
h(x) · f(x)<br />
h(x) · P (X = x)<br />
You can use this formula to find the expected<br />
value of any function of a discrete random<br />
variable X.<br />
In statistics, a very special function of X for<br />
which we take the expected value is (X −µ) 2<br />
where µ was defined earlier as E[X].<br />
We use E[(X − µ) 2 ] to quantify the spread<br />
in a distribution. And this value is called the<br />
variance of a distribution...<br />
6
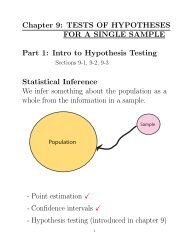
As mentioned earlier, the mean is measure of<br />
center for a distribution.<br />
But what about the spread?<br />
The two probability mass functions shown above<br />
(viewed as a loading on a beam) have the same<br />
mean, but not the same spread.<br />
There are a variety of ways to quantify spread<br />
or dispersion. Consider a simple one..<br />
Range: x max − x min<br />
This one is minimally informative.<br />
7
Better yet, we could relate the values in a distribution<br />
to a measure of center (then all values<br />
contribute to the measure of spread).<br />
For example...<br />
Expected absolute distance from the mean:<br />
Expected value of |x i − EX|<br />
{ On average, how far from center are the values?}<br />
But probably the most often used variability<br />
measure is the variance of a distribution.<br />
8
• Variance<br />
The variance of X, denoted as σ 2 or V (X),<br />
is<br />
σ 2 = V (X) = E(X − µ) 2<br />
It is the expected squared distance of X from<br />
the mean (or expected value) of the random<br />
variable.<br />
Since X is a discrete random variable,<br />
E(X−µ) 2 = ∑ x<br />
(x−µ) 2 f(x) = ∑ x<br />
x 2 f(x)−µ 2<br />
where f(x) is the probability mass function<br />
for X.<br />
To use either of the summation formulas you<br />
must first compute EX = µ.<br />
9
• Standard Deviation<br />
Variance is in units 2 , so we often work with<br />
standard deviation instead which is in the<br />
original units of the data.<br />
The standard deviation of X is denoted as<br />
σ where σ = √ σ 2 = √ V (X).<br />
The standard deviation of X is just the square<br />
root of the variance of X.<br />
∗ Though the ‘average absolute distance from center’ is in<br />
the origin units and may be more easily interpreted, it<br />
turns out that the squared distance function is nicer to<br />
deal with than the absolute value function mathematically.<br />
10
Remember, variance is a measure of spread or<br />
dispersion.<br />
• Example: Flaws in a piece of wire.<br />
Let X represent the number of flaws in a randomly<br />
chosen piece of wire.<br />
x f(x)<br />
0 0.48<br />
1 0.39<br />
2 0.12<br />
3 0.01<br />
Compute the variance and standard deviation<br />
of X.<br />
ANS:<br />
11
e.g. (cont.)<br />
12
• Example: Coin toss game.<br />
You and a friend play a game where you each<br />
toss a balanced coin. If the upper faces on<br />
the coins are both tails, you win $1; if the<br />
faces are both heads, you win $2; if the coins<br />
do not match (one shows a head the other a<br />
tail), you lose $1.<br />
Let X represent the amount won.<br />
1. What is the probability distribution for<br />
X?<br />
13
2. Find the mean and variance of X.<br />
14
e.g. (cont.)<br />
15