2012 Rail Trends - Railway Association of Canada
2012 Rail Trends - Railway Association of Canada
2012 Rail Trends - Railway Association of Canada

Create successful ePaper yourself
Turn your PDF publications into a flip-book with our unique Google optimized e-Paper software.
www.railcan.ca<br />
<strong>2012</strong> <strong>Rail</strong> <strong>Trends</strong>
Yukon Territory<br />
Northwest Territories<br />
C a n a d a<br />
British Columbia<br />
Hay River<br />
Nunavut<br />
Churchill<br />
Prince<br />
Rupert<br />
CN<br />
RMR<br />
Alberta<br />
CN<br />
Edmonton<br />
Saskatchewan<br />
HBRY<br />
Manitoba<br />
Vancouver<br />
RMR<br />
WCE<br />
SRY<br />
RMR<br />
CP<br />
KPR<br />
KFR<br />
APR<br />
Calgary<br />
GSR<br />
CP<br />
CTRW<br />
CP<br />
GWR<br />
Saskatoon<br />
Regina<br />
CN<br />
BNML<br />
CEMR<br />
Winnipeg<br />
BNSF<br />
BNSF<br />
Rapid City<br />
CP<br />
Minneapolis<br />
Minneapolis<br />
St. Paul<br />
CN<br />
www.railcan.ca ISBN: 978-1-927520-00-0<br />
BNSF<br />
Kansas City<br />
U n i t e d S<br />
BN
99 Bank Street<br />
Suite 901<br />
Ottawa, ON K1P 6B9<br />
Telephone: (613) 567-8591<br />
Fax: (613) 567-6726<br />
Email: rac@railcan.ca<br />
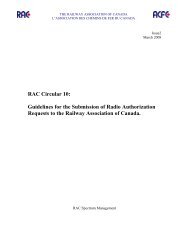
Canadian railway network as <strong>of</strong> Dec. 31, 2011.<br />
Please see the most recent edition <strong>of</strong> the Canadian <strong>Rail</strong> Atlas<br />
for an up-to-date version <strong>of</strong> the network.<br />
Ontario<br />
CP<br />
CN<br />
CN<br />
CP<br />
Moosonee<br />
ONR<br />
Thunder Bay Sudbury<br />
HCRY<br />
Detroit<br />
Chicago<br />
GEXR<br />
NCR<br />
OVR<br />
BCRY<br />
SSR GO<br />
VIA<br />
ETL<br />
Quebec<br />
CN<br />
PCHR<br />
CFQG<br />
CFO<br />
VIA<br />
CR<br />
Toronto<br />
STER<br />
OSRSOR<br />
NS<br />
TSH<br />
Labrador City<br />
Montréal<br />
AMMC<br />
RS<br />
CFC<br />
Québec<br />
CSX<br />
AMT<br />
Schefferville<br />
WLR<br />
SLQ<br />
CP<br />
Newfoundland and<br />
Labrador<br />
MMA<br />
QNSL<br />
CFA<br />
New<br />
Brunswick<br />
NBSR<br />
EMRY<br />
Sherbrooke<br />
Albany<br />
CFRR<br />
Sept-Îles<br />
CFG<br />
Prince<br />
Edward<br />
Island<br />
Moncton<br />
CN<br />
Nova<br />
Scotia<br />
SCR<br />
CBNS<br />
Halifax<br />
i2 012<br />
NS<br />
CSX<br />
SF<br />
NS<br />
t a t e s<br />
CN<br />
CSX<br />
NS<br />
CSX
Member Companies<br />
December 2011<br />
ii2 012<br />
6970184 <strong>Canada</strong> Ltd<br />
AMT Agence métropolitaine de transport<br />
APR Alberta Prairie <strong>Rail</strong>way Excursions<br />
AMTK Amtrak<br />
AMMC ArcelorMittal Mines <strong>Canada</strong><br />
CFA Arnaud <strong>Rail</strong>way Company<br />
BCRY Barrie-Collingwood <strong>Rail</strong>way<br />
BNSF BNSF <strong>Rail</strong>way Company<br />
BNML Burlington Northern (Manitoba) Ltd.<br />
CP Canadian Pacific<br />
CBNS Cape Breton & Central Nova Scotia<br />
<strong>Rail</strong>way<br />
CT Capital <strong>Rail</strong>way<br />
CTRW Carlton Trail <strong>Rail</strong>way<br />
CEMR Central Manitoba <strong>Rail</strong>way Inc.<br />
CFC Charlevoix <strong>Rail</strong>way Company Inc.<br />
CN CN<br />
CSX CSX Transportation Inc.<br />
EMRY Eastern Maine <strong>Rail</strong>way Company<br />
ETL Essex Terminal <strong>Rail</strong>way Company<br />
GEXR Goderich-Exeter <strong>Rail</strong>way Company<br />
Limited<br />
RMR Great Canadian <strong>Rail</strong>tour Company<br />
Ltd.<br />
GSR Great Sandhills <strong>Rail</strong>way Ltd.<br />
GWR Great Western <strong>Rail</strong>way Ltd.<br />
HBRY Hudson Bay <strong>Rail</strong>way<br />
HCRY Huron Central <strong>Rail</strong>way Inc.<br />
KPR Kelowna Pacific <strong>Rail</strong>way Ltd.<br />
KFR Kettle Falls International <strong>Rail</strong>way,<br />
LLC<br />
GO Metrolinx<br />
MMA Montréal, Maine & Atlantic <strong>Rail</strong>way,<br />
Ltd.<br />
NBSR New Brunswick Southern <strong>Rail</strong>way<br />
NCR<br />
NS<br />
ONR<br />
OSR<br />
OVR<br />
Company Limited<br />
Nipissing Central <strong>Rail</strong>way Company<br />
Norfolk Southern <strong>Rail</strong>way<br />
Ontario Northland Transportation<br />
Commission<br />
Ontario Southland <strong>Rail</strong>way Inc.<br />
Orangeville Brampton <strong>Rail</strong>way<br />
Ottawa Valley <strong>Rail</strong>way<br />
CFQG Québec Gatineau <strong>Rail</strong>way Inc.<br />
QNSL Québec North Shore and Labrador<br />
RS<br />
CFRR<br />
CFG<br />
SSR<br />
SOR<br />
SRY<br />
<strong>Rail</strong>way Company Inc.<br />
Roberval and Saguenay <strong>Rail</strong>way<br />
Company, The<br />
Romaine River <strong>Rail</strong>way Company<br />
Société du chemin de fer de la<br />
Gaspésie<br />
South Simcoe <strong>Rail</strong>way<br />
Southern Ontario <strong>Rail</strong>way<br />
Southern <strong>Rail</strong>way <strong>of</strong><br />
British Columbia Ltd.<br />
QNSL St. Lawrence & Atlantic <strong>Rail</strong>road<br />
(Québec) Inc.<br />
CFO Steam Train HCW<br />
SCR Sydney Coal <strong>Rail</strong>way<br />
TTR Toronto Terminals <strong>Rail</strong>way<br />
Company Limited, The<br />
STER/ Trillium <strong>Rail</strong>way Co. Ltd.<br />
PCHR<br />
TSH Tshiuetin <strong>Rail</strong> Transportation Inc.<br />
VIA VIA <strong>Rail</strong> <strong>Canada</strong> Inc.<br />
WLR Wabush Lake <strong>Rail</strong>way Company,<br />
Limited<br />
WCE West Coast Express Ltd.
Associate Members<br />
December 2011<br />
4 Refuel <strong>Canada</strong> LP<br />
Absopulse Electronics Ltd<br />
Accuworx Inc.<br />
Administration portuaire de Montréal<br />
AECOM<br />
Alexander Holburn Beaudin & Lang LLP<br />
AllTrain – Training Solutions<br />
Amsted <strong>Rail</strong><br />
BMT Fleet Technology Limited<br />
Bombardier Inc.<br />
Canac <strong>Rail</strong>way Services Inc.<br />
Canadian Heartland Training <strong>Rail</strong>way<br />
Canadian <strong>Rail</strong> Collision and<br />
Refurbishing Inc.<br />
Consolidated Logistic Inc.<br />
Davanac Inc.<br />
Dessau<br />
Ecopower Hybrid Systems Inc.<br />
Entretien Ferroviaire JMSR inc.<br />
Envirotec Services Incorporated<br />
Fairplast Industries<br />
(9151 9405 Québec Inc)<br />
GATX <strong>Rail</strong> <strong>Canada</strong> Corporation<br />
HDR Engineering<br />
Hewitt Equipment Ltd.<br />
IBI Group<br />
Itech Environmental Remediation<br />
Kenneth R. Peel, Barrister & Solicitor<br />
MD-UN Inc.<br />
Mecfor Inc.<br />
MMM Group Ltd<br />
NARSTCO<br />
Neptec Design Group Ltd.<br />
Newalta Industrial Services Inc.<br />
Ozark Mountain <strong>Rail</strong>car<br />
Peck & Hale L.L.C.<br />
PNR <strong>Rail</strong>works Inc.<br />
Quantum Murray LP<br />
<strong>Rail</strong> Cantech<br />
<strong>Rail</strong>decks (2009) Inc.<br />
<strong>Rail</strong>way 101 Consulting Services<br />
RDG2 Technologies Inc.<br />
Red Giant Oil Company<br />
RTC <strong>Rail</strong> Solutions Ltd<br />
Sandy Cooke Consulting Inc.<br />
Siemens <strong>Canada</strong> Limited<br />
SNC-Lavalin O&M<br />
Soulanges <strong>Rail</strong>way Services Inc.<br />
Stantec Inc.<br />
Stäubli Corporation<br />
Tessco Technologies Inc.<br />
Transportation Certification Services<br />
VIdal Street Industrial Park Inc.<br />
Whiting Equipment <strong>Canada</strong><br />
<strong>2012</strong><br />
iii
Message from the President<br />
<strong>2012</strong><br />
iv<br />
This is our organization’s 20th edition <strong>of</strong> <strong>Rail</strong> <strong>Trends</strong>. The<br />
data in this year’s milestone edition shows the industry’s<br />
continued dedication to growth, safety and sustainability,<br />
and demonstrates why the Canadian rail sector is experiencing<br />
a true renaissance.<br />
The driving force <strong>of</strong> this resurgence has been freight rail<br />
and the positive contributions and investments it has made to<br />
maximize the way goods are moved within North America and<br />
to international markets. Within a globally integrated supply<br />
chain, the country’s railways are working with customers to<br />
ship products in a timely way to new and traditional markets, thereby<br />
enabling them to add value and create more wealth for <strong>Canada</strong>.<br />
In addition to robust freight expansion, there has also been significant<br />
growth in passenger rail. <strong>Rail</strong> moves more than 73 million people<br />
each year and this number is rising. Gas prices and urban sprawl have<br />
boosted the demand for investment in passenger rail infrastructure and<br />
services and <strong>Canada</strong>’s intercity and commuter railways have responded<br />
exceptionally well.<br />
As <strong>Canada</strong>’s rail renaissance continues to gain steam, the country’s<br />
railway sector has garnered very positive impressions among the<br />
Canadian public. Public opinion research has found the overwhelming<br />
majority <strong>of</strong> Canadians view rail to be safe, environmentally friendly and<br />
the best mode <strong>of</strong> transportation for society.<br />
With the recession in the rearview mirror, the <strong>Rail</strong>way <strong>Association</strong><br />
<strong>of</strong> <strong>Canada</strong> and its members are thrilled to see the data in <strong>Rail</strong> <strong>Trends</strong><br />
reflecting a growing and prosperous future for rail in <strong>Canada</strong>. I hope you<br />
find this edition informative and useful. We welcome your feedback.<br />
Sincerely,<br />
Michael Bourque<br />
President and Chief Executive Officer<br />
<strong>Rail</strong>way <strong>Association</strong> <strong>of</strong> <strong>Canada</strong>
We dedicate this issue <strong>of</strong> <strong>Rail</strong> <strong>Trends</strong> to the memory <strong>of</strong><br />
Clifford J. Mackay, President and Chief Executive Officer<br />
<strong>of</strong> the <strong>Rail</strong>way <strong>Association</strong> <strong>of</strong> <strong>Canada</strong>, who passed away<br />
in January <strong>2012</strong>. Cliff spent more than five years at<br />
the helm <strong>of</strong> the RAC, where he worked collaboratively<br />
with various government and regulatory agencies to<br />
improve safety in the industry. A staunch advocate<br />
<strong>of</strong> freight and passenger rail, Cliff spent the twilight<br />
<strong>of</strong> his career ensuring Canadian regulatory agencies,<br />
as well as elected and non-elected <strong>of</strong>ficials, gained<br />
a better understanding <strong>of</strong> the strategic economic role<br />
railways play in <strong>Canada</strong>. His decades <strong>of</strong> experience<br />
and contributions improved the rail sector and <strong>Canada</strong>’s<br />
transportation industry as a whole. Moreover, he<br />
believed this work is good for business, the environment<br />
and our great country’s future.<br />
v2 012
Table <strong>of</strong> Contents<br />
<strong>2012</strong><br />
vi<br />
1 Introduction<br />
2 Economy<br />
4 Revenue ton-miles (Revenue tonne-kilometres)<br />
5 Employment<br />
6 Financial highlights<br />
8 Carloads originated by commodity grouping<br />
9 Passenger and tourist service statistics<br />
10 Infrastructure Investment and Productivity<br />
11 Additions to property<br />
12 Productivity<br />
13 Overview <strong>of</strong> taxes provided by rail sector<br />
14 Safety<br />
15 <strong>Rail</strong> accidents<br />
17 Operation Lifesaver<br />
18 Environment<br />
19 Carbon reporting<br />
20 Fuel and efficiency measures<br />
21 Locomotive fleet inventory<br />
21 Spills performance and response data<br />
22 Public Perception<br />
23 Appendix A – <strong>Rail</strong> Operations in <strong>Canada</strong><br />
35 Appendix B – Financial Highlights<br />
39 Glossary<br />
Conversion factors<br />
40 List <strong>of</strong> acronyms
Introduction<br />
This is the <strong>Rail</strong>way <strong>Association</strong> <strong>of</strong> <strong>Canada</strong>’s<br />
(RAC) 20th edition <strong>of</strong> <strong>Rail</strong> <strong>Trends</strong>, an<br />
annual report on the performance <strong>of</strong><br />
<strong>Canada</strong>’s freight and passenger railway sector.<br />
The publication contains a rolling 10-year<br />
review <strong>of</strong> financial and statistical results,<br />
reflecting multiple aspects <strong>of</strong> rail performance.<br />
This year’s edition provides an overview<br />
<strong>of</strong> 2011 performance and highlights some<br />
clear trends taking place in the Canadian rail<br />
business. The most obvious indication is that<br />
there is a rail renaissance underway. <strong>Canada</strong>’s<br />
integrated global supply chain is relying on rail<br />
more than ever, and this year’s data shows<br />
freight and passenger rail activity is increasing<br />
across the country.<br />
Despite a swell in rail traffic, this year’s data indicates the industry<br />
is improving its environmental and safety records. In fact, Canadian<br />
railways shipped more than 337 millions tons in 2011, a 0.8 per cent<br />
increase from the previous year, while reducing emissions, spills and<br />
accidents. This record <strong>of</strong> improvement is a testament to the sector’s<br />
commitment to sustainability and safety and is one <strong>of</strong> the reasons why<br />
the Canadian public has expressed clear support for rail.<br />
As <strong>Canada</strong>’s vast rail network moves increasingly more goods and<br />
people while getting greener and safer, it is clear the sector is going in a<br />
positive direction and that the resurgence <strong>of</strong> rail is in full force.<br />
This year’s data is categorized into five sections:<br />
••<br />
Economy;<br />
••<br />
Infrastructure Investment and Productivity;<br />
••<br />
Safety;<br />
••<br />
Environment; and<br />
••<br />
Public Perception.<br />
In addition to these sections, Appendix A and B provide details on rail<br />
operations and financial highlights from 2002 to 2011.<br />
12 012
Economy<br />
22 012<br />
Despite financial uncertainty in key<br />
markets around the globe, <strong>Canada</strong><br />
stood out among leading (global)<br />
industrialized countries with a relatively healthy,<br />
export-rich economy in 2011. <strong>Rail</strong>ways were<br />
instrumental in solidifying this status.<br />
As <strong>Canada</strong>’s economy continues to rally<br />
towards pre-recession levels, the nation’s<br />
railways are relied upon more heavily than ever<br />
before to facilitate growth and trade. In recent<br />
years, rail has become the preferred mode <strong>of</strong><br />
ground transportation, facilitating more than<br />
$75 billion in trade, and reinforcing its role as<br />
the backbone <strong>of</strong> an integrated supply chain that<br />
has helped move <strong>Canada</strong>’s resources to global<br />
markets.<br />
The most common barometer for measuring rail workload performance<br />
is revenue ton-miles (revenue tonne-kilometres) or RTM (RTK),<br />
which is the movement <strong>of</strong> one revenue-producing ton <strong>of</strong> freight the<br />
distance <strong>of</strong> one mile (kilometre). It is calculated by multiplying the<br />
weight <strong>of</strong> paid tonnage by the total distance (in miles or kilometres) it<br />
has been transported.<br />
This section highlights the statistical data <strong>of</strong> key areas that point to<br />
the current growth <strong>of</strong> rail in relation to the Canadian economy.
Economy<br />
2011 economic highlights:<br />
••<br />
Member railways’ workload increased by 3.2 per cent to a<br />
record 255 billion revenue ton-miles (372 billion revenue tonnekilometres)<br />
or RTM (RTK), and has climbed 20.6 per cent over the<br />
past 10 years.<br />
••<br />
The sector employed an average <strong>of</strong> 33,624 people, a 3.3 per cent<br />
increase from 2010, marking the second consecutive year-overyear<br />
rise.<br />
••<br />
Total industry operating revenue hit a record $11.5 billon,<br />
surpassing last year’s total by 7.1 per cent, and operating<br />
expenses climbed 6.5 per cent to a record $9.8 billion.<br />
••<br />
Canadian freight rates continue to be some <strong>of</strong> the most<br />
competitive in the world.<br />
••<br />
Originated freight carloads increased 4.5 per cent compared to<br />
2010.<br />
••<br />
Total revenue from passenger transportation services, representing<br />
combined intercity, tourist train and commuter rail services, has<br />
climbed 71.4 per cent over 10 years to $667 million.<br />
32 012
Economy<br />
Revenue ton-miles<br />
(Revenue tonne-kilometres)<br />
In 2011, member railways’ workload<br />
totalled a record 255 billion RTM (372 RTK),<br />
an increase <strong>of</strong> 3.2 per cent from last year<br />
and 20.6 per cent over the past 10 years.<br />
The graph below indicates the RTM <strong>of</strong><br />
current member companies throughout the<br />
last decade.<br />
275,000<br />
REVENUE TON-MILES (millions)<br />
250,000<br />
225,000<br />
42 012<br />
200,000<br />
2002 2002 2003 2004 2005 2006 2007 2008 2009 2011<br />
250000
Economy<br />
Employment<br />
<strong>Rail</strong> delivers services that provide shippers<br />
access to domestic and international markets<br />
and connects passengers to destinations near<br />
and far. The increasing demand for services<br />
has prompted a boost in employment across<br />
the industry. In 2011, <strong>Canada</strong>’s rail business<br />
continued to serve as an economic driver<br />
by way <strong>of</strong> employment, both in terms <strong>of</strong><br />
number <strong>of</strong> employees and average annual<br />
wage.<br />
In 2011, the sector employed an average<br />
<strong>of</strong> 33,624 people, a 3.3 per cent increase<br />
from 2010 and the second consecutive yearover-year<br />
rise. The average salary in the sector also rose by 4.8 per<br />
cent from a year ago, outpacing the 2.6 per cent average annual<br />
increase since 2002. The figure below points to the sector’s year-by-year<br />
employment trends throughout the last decade.<br />
90,000<br />
EMPLOYMENT<br />
70,000<br />
52 012<br />
50,000<br />
30,000<br />
2002 2002 2003 2004 2005 2006 2007 2008 2009 2011<br />
Average annual wage<br />
Employees
Economy<br />
Financial highlights<br />
In 2011, year-over-year total industry operating revenue climbed 7.1 per<br />
cent to a record $11.5 billon. There are three components to operating<br />
revenue: freight, passenger and other revenue. Other revenue is largely<br />
composed <strong>of</strong> revenue for services provided to passenger and commuter<br />
rail companies, as well as switching, demurrage and miscellaneous<br />
rentals.<br />
The sector also hit a record $9.8 billion in total operating expenses,<br />
which includes costs <strong>of</strong> fuel, equipment maintenance and administrative<br />
expenditures. The new high was a 6.5 per cent jump from the previous<br />
year.<br />
12,000<br />
Operating REVENUE & expenses (millions)<br />
10,000<br />
8,000<br />
62 012<br />
6,000<br />
2002 2002 2003 2004 2005 2006 2007 2008 2009 2011<br />
Operating income<br />
Operating Expenses<br />
12000
Economy<br />
It’s worth noting that while railways increased their overall operating<br />
revenue in 2011, they did so <strong>of</strong>fering some <strong>of</strong> the lowest freight rates<br />
in the world.<br />
The graph below shows <strong>Canada</strong>’s freight rates throughout the last<br />
five years compared to most <strong>of</strong> the world’s largest economies.<br />
9 ¢<br />
CANADA IS A LEADER WITH LOW RAIL RATES<br />
8 ¢<br />
7 ¢<br />
6 ¢<br />
5 ¢<br />
4 ¢<br />
3 ¢<br />
2 ¢<br />
1 ¢<br />
0 ¢<br />
2006 2007 2008 2009 2010<br />
<strong>Canada</strong><br />
China<br />
France<br />
Germany<br />
India<br />
Japan<br />
Russia<br />
U.S.<br />
Revenue per ton-mile in U.S. dollars, Purchasing Power Parity adjusted<br />
Source: RAC, <strong>2012</strong><br />
72 012
Economy<br />
Carloads originated by commodity<br />
grouping<br />
Another measurement <strong>of</strong> industry workload<br />
that demonstrates rail’s renaissance in<br />
2011 is originated freight carloads by<br />
the sector, which increased 4.5 per cent<br />
compared to 2010. To get a better sense<br />
<strong>of</strong> the freight being carried, the industry<br />
tracks its carloads originated by commodity<br />
grouping. This set <strong>of</strong> data is indicative <strong>of</strong><br />
the products <strong>Canada</strong>’s trains are shipping<br />
across the country and to international<br />
markets.<br />
The chart below illustrates carloads originated by commodity<br />
grouping as a percent <strong>of</strong> all commodity carloads originated among<br />
member railways. Some categories have been grouped together.<br />
Carloads originated by commodity grouping<br />
82 012<br />
14% Agricultural Goods<br />
& Food<br />
10% Pulp &<br />
Wood Products<br />
25% Metals & Minerals<br />
23% Intermodal<br />
7% Machinery & Manufactured<br />
21% Hydrocarburants & Chemicals
Economy<br />
Passenger and tourist service statistics<br />
The 2011 data shows more and more people are choosing rail<br />
transportation as a means to commute and travel. In the same year,<br />
total revenue from passenger transportation services, representing<br />
combined intercity, tourist train and rail commuter services decreased<br />
1.0 per cent to $667 million, but climbed 71.4 per cent over 10 years.<br />
The number <strong>of</strong> rail commuters in British Columbia, Ontario and Quebec<br />
also jumped 36.5 per cent over the decade.<br />
The rise across passenger and tourist service statistics reflects<br />
Canadians’ mounting attraction to intercity and commuter rail. <strong>Rail</strong><br />
is safe, convenient and green and this year’s findings indicate rail is<br />
a preferred method <strong>of</strong> travel among Canadians. The RAC’s member<br />
railways understand the demand for increased passenger rail service<br />
and are effectively adapting in order to meet the needs <strong>of</strong> Canadians by<br />
providing more passenger services more <strong>of</strong>ten.<br />
92 012
Infrastructure Investment<br />
and Productivity<br />
<strong>2012</strong><br />
10<br />
To improve service and increase the value<br />
and performance <strong>of</strong> the supply chain, RAC<br />
member railways continued their substantial<br />
investment in the maintenance and development<br />
<strong>of</strong> infrastructure in 2011. These companies are in<br />
the distinctive position <strong>of</strong> financing the near entirety<br />
<strong>of</strong> the network that forms the backbone <strong>of</strong> the<br />
Canadian supply chain. Their investment is measured<br />
by the industry term “additions to property,” which<br />
includes purchasing rolling stock, improving bridges<br />
and replacing rail and other track materials.<br />
In order to keep pace with shipper demands and<br />
maintain exceptional service at the lowest possible<br />
rates, member railways ensure the existing network<br />
is well-maintained and includes modernized facilities<br />
and information technology systems. This concerted effort to uphold and<br />
improve the efficiency <strong>of</strong> the rail network allows the railways to enhance<br />
their productivity and attract new business. Not only did Canadian railways<br />
keep up with growth in all areas <strong>of</strong> rail in 2011, but they did so while<br />
improving operating efficiencies and <strong>of</strong>fering better service to customers.<br />
The RAC represents effectively all rail companies operating in<br />
<strong>Canada</strong> – the large Class 1s, the regional and short lines railways, intercity<br />
passenger, commuter rail and tourist train operators.<br />
2011 investment and productivity highlights:<br />
••<br />
<strong>Canada</strong>’s rail sector invested $1.8 billion in additions to<br />
property in 2011, a year-over-year rise <strong>of</strong> 7.6 per cent.<br />
••<br />
Employee productivity increased by 2.5 per cent to a record<br />
8.5 million RTM (12.4 million RTK) per employee.<br />
••<br />
<strong>Canada</strong>’s railways contributed a record $158 million in tax<br />
revenue, 7.5 per cent more than the previous year.
Infrastructure Investment and Productivity<br />
Additions to property<br />
The figure below shows the industry invested<br />
$1.8 billion in additions to property in 2011, a<br />
year-over-year increase <strong>of</strong> 6.5 per cent. Compared<br />
to 10 years ago, Canadian railways committed<br />
80.7 per cent more to capital spending, reflecting<br />
the desire among rail companies to expand<br />
and maintain their network to improve service,<br />
facilitate the movement <strong>of</strong> trade and support<br />
the growth <strong>of</strong> the Canadian economy. The graph<br />
below shows the sector’s additions to property<br />
over the last 10 years.<br />
2,000<br />
ADDITIONS TO PROPERTY (MILLIONS CAD)<br />
1,000<br />
<strong>2012</strong><br />
0<br />
2002 2003 2004 2005 2006 2007 2008 2009 2010 2011<br />
11<br />
Today, rail is experiencing a renaissance. Cities are implementing<br />
LRT systems. Metropolitan areas are expanding the reach <strong>of</strong><br />
commuter rail service. And at VIA <strong>Rail</strong>, we are working at<br />
improving inter-city rail transportation. We strive to have a<br />
positive and meaningful impact on the lives <strong>of</strong> millions <strong>of</strong><br />
Canadians.”<br />
Marc Laliberté<br />
President and Chief Executive Officer, VIA <strong>Rail</strong> <strong>Canada</strong>
Infrastructure Investment and Productivity<br />
Productivity<br />
The output <strong>of</strong> the rail business only goes<br />
as far as the efficiency <strong>of</strong> its employees.<br />
Employee productivity is measured in<br />
terms <strong>of</strong> RTM (RTK) per employee, which<br />
gives a sense <strong>of</strong> how well the sector is<br />
allocating its resources.<br />
From a year ago, employee productivity<br />
increased 2.5 per cent to a record 8.5 million<br />
RTM (12.4 million RTK) per employee in<br />
2011. While this figure suggests only a<br />
slight step forward in productivity, it is a<br />
robust long-term improvement from the<br />
6.3 million RTM (9.2 RTK) per employee recorded in 2002. The graph<br />
below illustrates the sector’s efficiency in terms <strong>of</strong> RTM per employee<br />
over the past 10 years.<br />
9,000<br />
REVENUE TON-MILES PER EMPLOYEE (000)<br />
8,000<br />
<strong>2012</strong><br />
12<br />
7,000<br />
6,000<br />
2002 2003 2004 2005 2006 2007 2008 2009 2010 2011
Infrastructure Investment and Productivity<br />
Overview <strong>of</strong> taxes provided by rail sector<br />
While <strong>Canada</strong>’s railways drive the economy by transferring goods across<br />
a vast integrated global supply chain, the taxes the sector pays each<br />
year are <strong>of</strong>ten overlooked as a form <strong>of</strong> substantial economic contribution<br />
to Canadians.<br />
The table below provides a snapshot <strong>of</strong> the taxes by category that<br />
member railways contributed in 2011.<br />
TAXES BY CATEGORY<br />
21% Locomotive fuel<br />
& Excise tax<br />
16% Property tax<br />
7% Other Sales tax<br />
17% Payroll tax<br />
39% Income tax<br />
<strong>2012</strong><br />
13
Safety<br />
<strong>Canada</strong>’s railways run an average <strong>of</strong> 1,100 passenger and freight<br />
trains every day, <strong>of</strong>ten over some <strong>of</strong> the world’s most rugged<br />
terrain and in some <strong>of</strong> the most inclement weather conditions.<br />
Yet, the performance <strong>of</strong> Canadian freight railways in terms <strong>of</strong> safety has<br />
steadily improved over the last decade and <strong>Canada</strong>’s passenger railways<br />
remain among the safest in the world. While rail traffic is increasing<br />
to meet customer demand, the sector continues to be committed to<br />
safety and furthering its reputation as the safest means <strong>of</strong> ground<br />
transportation in <strong>Canada</strong>.<br />
2011 safety highlights:<br />
••<br />
While the sector moved a record 473.3 billion gross ton-miles<br />
(BGTM), it maintained a rate <strong>of</strong> 2.41 total accidents per BGTM,<br />
the lowest rate in the last 10 years.<br />
••<br />
Accidents at railway crossings were down 6.6 per cent yearover-year,<br />
while serious injuries fell 25 per cent over the same<br />
period.<br />
••<br />
Trespasser accidents and fatalities dropped 17.3 and 18.2 per<br />
cent year-over-year, respectively.<br />
<strong>2012</strong><br />
14
Safety<br />
<strong>Rail</strong> accidents<br />
Canadian railways celebrated a banner year <strong>of</strong> reportable railway<br />
accident 1 reduction in 2011. While the sector moved a record<br />
473.3 billion gross ton-miles (BGTM) in 2011, it maintained a rate <strong>of</strong><br />
2.41 total accidents per BGTM, the lowest rate in the last 10 years. In<br />
addition, the industry recorded 1,143 total freight and passenger train<br />
accidents in 2011, the lowest total over the same period.<br />
<strong>Canada</strong>’s railways take measures to reduce technical accidents and<br />
continually enhance the safety <strong>of</strong> rail operations. Work is also being<br />
done in collaboration with Transport <strong>Canada</strong> to improve safety where the<br />
public interacts with rail activities by closing rail crossings and improving<br />
public awareness by promoting accident prevention.<br />
The data collected in order to analyze the safety performance <strong>of</strong> rail<br />
comes from the Canadian Transportation Safety Board (TSB) and the<br />
RAC. The TSB maintains a database <strong>of</strong> safety performance statistics on<br />
federally-regulated railways 2 and the RAC collects similar statistics on<br />
provincially-regulated operations.<br />
1 “Reportable railway accident” means an accident resulting directly from the operation<br />
<strong>of</strong> rolling stock, where:<br />
• (a) (i) a person sustains a serious injury or is killed as a result <strong>of</strong> being on board or<br />
getting on or <strong>of</strong>f the rolling stock, or (ii) coming into contact with any part <strong>of</strong> the<br />
rolling stock or its contents, or<br />
• (b) the rolling stock (i) is involved in a grade-crossing collision, (ii) is involved in a<br />
collision or derailment and is carrying passengers, (iii) is involved in a collision or<br />
derailment and is carrying dangerous goods, or is known to have last contained<br />
dangerous goods the residue <strong>of</strong> which has not been purged from the rolling stock,<br />
(iv) sustains damage that affects its safe operation, or (v) causes or sustains a fire or<br />
explosion, or causes damage to the railway, that poses a threat to the safety <strong>of</strong> any<br />
person, property or the environment.<br />
<strong>2012</strong><br />
15<br />
2 The database is available at http://www.tsb.gc.ca/eng/rail/index.asp.
Safety<br />
The graph below shows the number <strong>of</strong> rail-related accidents over<br />
the previous 10 years, along with the rate <strong>of</strong> freight train accidents per<br />
billion gross ton-miles, which points to the number <strong>of</strong> accidents as they<br />
relate to rail activity.<br />
<strong>Rail</strong> Accidents and Accident Rate<br />
1,800<br />
4.5<br />
1,600<br />
3.4<br />
1,400<br />
2.3<br />
1,200<br />
1.1<br />
1,000<br />
2005 2006 2007 2008 2009 2010<br />
0<br />
Freight train accidents<br />
Freight train accidents per billion gross ton-miles<br />
<strong>2012</strong><br />
16
Safety<br />
Operation Lifesaver<br />
One <strong>of</strong> the programs committed to preventing collisions between trains<br />
and motor vehicles, as well as trespassing incidents that lead to serious<br />
injury or death, is Operation Lifesaver, 3 a joint initiative <strong>of</strong> the RAC<br />
and Transport <strong>Canada</strong>. The program aims to save lives by educating<br />
Canadians about the hazards surrounding public activity near rail<br />
property and trains. Operation Lifesaver works in tandem with the rail<br />
sector, government, police, labour unions, the media and the public to<br />
spread education and prevent tragedies.<br />
In 2011, accidents at railway crossings were down 6.6 per cent yearover-year,<br />
while serious injuries fell 25 per cent over the same period.<br />
Moreover, 2011 trespasser accidents and fatalities were also down<br />
17.3 and 18.2 per cent, respectively, year-over-year.<br />
“Year-over-year we continue to see a decline in both crossing<br />
and trespassing incidents thanks in part to the dedication <strong>of</strong> our<br />
partners, staff and volunteers. That’s definitely a trend worth<br />
repeating.”<br />
Daniel (Dan) Di Tota,<br />
National Director, Operation Lifesaver<br />
Source: Transportation Safety Board, <strong>Rail</strong>way <strong>Association</strong> <strong>of</strong> <strong>Canada</strong>, <strong>2012</strong><br />
<strong>2012</strong><br />
17<br />
3 http://www.operationlifesaver.ca.
Environment<br />
<strong>Canada</strong>’s legacy <strong>of</strong> pr<strong>of</strong>ound scenic beauty is<br />
recognized around the world, and rail is part <strong>of</strong><br />
maintaining the country’s natural splendour. In<br />
addition to moving people, goods and the economy,<br />
<strong>Canada</strong>’s railways boast a first-rate environmental<br />
record and commitment to sustainability. While the<br />
country’s rail sector <strong>of</strong>ten moves more than 70 per<br />
cent <strong>of</strong> all surface goods each year, it only accounts for<br />
3.4 per cent <strong>of</strong> the transportation sector’s Greenhouse<br />
Gas Emissions (GHG) and less than 1 per cent<br />
<strong>of</strong> <strong>Canada</strong>’s overall GHGs. 4 Since 1995, <strong>Canada</strong>’s<br />
freight and passenger rail sectors have participated<br />
in a Memorandum <strong>of</strong> Understanding (MOU) with<br />
the Government <strong>of</strong> <strong>Canada</strong> to voluntarily reduce<br />
GHGs and Criteria Air Contaminants (CAC). Under this<br />
initiative, the sector has committed to GHG and CAC reduction targets for<br />
freight, short line, intercity and commuter railways, and it will continue to<br />
work with governments, communities and other private sector partners to<br />
increase the sustainability <strong>of</strong> the Canadian supply chain.<br />
<strong>2012</strong><br />
18<br />
2011 environmental highlights:<br />
••<br />
The sector reduced fuel consumption by 3.1 per cent compared<br />
to 2010.<br />
••<br />
The industry’s number <strong>of</strong> freight car inventory was basically<br />
unchanged from a year before and its locomotive fleet increased<br />
by 23 locomotives. However, Canadian railways managed to<br />
lower the miles (kilometres) <strong>of</strong> road operated (road over which<br />
a railway has operating rights) by 1.8 per cent from 2010.<br />
••<br />
Dangerous goods (DG) leaker incidents accounted for 25 per<br />
cent <strong>of</strong> all reportable incidents, the lowest share to date.<br />
4 Source: United Nations Framework Convention on Climate Change (UNFCCC), 2010.
Environment<br />
Carbon reporting<br />
The Locomotive Emissions<br />
Monitoring (LEM) data is<br />
compiled in accordance with<br />
the terms <strong>of</strong> the MOU between<br />
the RAC, Environment <strong>Canada</strong><br />
and Transport <strong>Canada</strong>. It<br />
concerns the emissions <strong>of</strong> GHGs<br />
and CACs from locomotives<br />
operating in <strong>Canada</strong>. 5 An<br />
updated MOU covering the<br />
period 2011-2015 is being<br />
developed by the RAC and<br />
TC, and will ensure Canadian<br />
railways continue to monitor<br />
their emissions and strive to<br />
become more efficient.<br />
In addition to this initiative,<br />
both Canadian National <strong>Rail</strong>way<br />
and Canadian Pacific <strong>Rail</strong>way<br />
participate in the Carbon<br />
Disclosure Project (CDP) – an<br />
independent not-for-pr<strong>of</strong>it organization that works with the world’s<br />
largest investors, businesses and governments to reduce GHGs and<br />
promote sustainable water use through the measurement, disclosure,<br />
management and sharing <strong>of</strong> environmental information. To date, the<br />
CDP holds the largest collection <strong>of</strong> self-reported climate change data in<br />
the world. 6<br />
<strong>2012</strong><br />
19<br />
5 To see the RAC’s Locomotive Emissions Monitoring program,<br />
visit http://www.railcan.ca/publications/emissions.<br />
6 Additional information is available at: www.cdproject.net.
Environment<br />
Fuel and efficiency measures<br />
The rail sector has been faced with the challenge <strong>of</strong> dealing with rising<br />
diesel fuel prices. In 2011, diesel fuel prices hit $4.25 per gallon, a record<br />
high and a 30.8 per cent jump from the previous year. To cope, Canadian<br />
railways have faced pressure to optimize fuel consumption productivity,<br />
and have answered the call. The sector reduced fuel consumption by<br />
3.1 per cent in 2011 compared to 2010, and the graph below illustrates<br />
RTM (RTK) per gallon (litre) <strong>of</strong> fuel consumed grew 10.5 per cent during<br />
the same period and improved 25.5 per cent since 2002. This result<br />
speaks to the industry-wide efforts being made to improve efficiency<br />
while keeping pace with demand.<br />
Because <strong>of</strong> high diesel fuel prices, member railways have strived<br />
to adopt new sustainability measures and implement initiatives that<br />
will cut costs by improving fuel efficiency. These improvements<br />
include scheduling trains based on capacity to minimize congestion,<br />
better matching <strong>of</strong> horsepower to tonnage, enhancing train handling<br />
techniques and standardizing fuel-saving devices on locomotives. The<br />
most effective fuel efficiency initiative continues to be locomotive fleet<br />
renewal, the process in which older, less fuel-efficient locomotives are<br />
replaced by new and improved higher-horsepower locomotives.<br />
650<br />
RTM PER GALLON OF FUEL CONSUMED (000)<br />
<strong>2012</strong><br />
20<br />
550<br />
450<br />
2002 2003 2004 2005 2006 2007 2008 2009 2010 2011
Environment<br />
Locomotive fleet inventory<br />
While freight, passenger and<br />
rail commuter workloads have<br />
been increasing steadily over<br />
the last decade, the sector<br />
has made a conscious effort<br />
to improve efficiency via<br />
asset utilization. In 2011, the<br />
industry’s freight car inventory<br />
was basically unchanged<br />
from a year before and its<br />
locomotive fleet increased<br />
by 23 locomotives. However,<br />
Canadian railways managed to<br />
lower the miles (kilometres)<br />
<strong>of</strong> road operated (road over which a railway has operating rights) by<br />
1.8 per cent from 2010. By replacing older locomotives, adding more<br />
fuel-efficient versions and reallocating resources, railways saved fuel by<br />
doing more with less.<br />
Spills performance and response data<br />
The TSB collects data on spills, or “dangerous good (DG) leaker”<br />
incidents – occurrences involving the unintentional release <strong>of</strong> a hazardous<br />
material while in transit. This type <strong>of</strong> incident does not involve an<br />
accident and <strong>of</strong>ten concern small quantities <strong>of</strong> products. In 2011, DG<br />
leaker incidents accounted for 25 per cent <strong>of</strong> all reportable incidents, the<br />
lowest share to date. Over the last five years, on average, DG leakers<br />
accounted for 33.8 per cent <strong>of</strong> incidents. Furthermore, reported DG<br />
leaker incidents totalled 51 in 2011, a 28 per cent decrease from the<br />
five-year average <strong>of</strong> 70.<br />
One <strong>of</strong> the primary functions <strong>of</strong> the RAC is to promote and continually<br />
improve the safe handling <strong>of</strong> dangerous goods. This means ensuring rail<br />
cars carrying dangerous goods meet strict standards, the consignments<br />
are properly packaged, labeled, placarded and documented, and that<br />
carriers handle the rail cars safely.<br />
<strong>2012</strong><br />
21
Public Perception<br />
As <strong>Canada</strong>’s rail industry<br />
ex periences a renaissance,<br />
the sector continues to<br />
garner very positive impressions<br />
among the Canadian public.<br />
Polling conducted by the RAC in<br />
2011 found the vast majority <strong>of</strong><br />
Canadians view freight, commuter<br />
and intercity rail options to be the<br />
safest, greenest and the best for<br />
society overall. Canadians also have a positive view <strong>of</strong> the railway sector<br />
as a source <strong>of</strong> employment in the near future.<br />
Canadians have expressed the want and need for more rail. From<br />
an economical, environmental and social standpoint, the widespread<br />
sentiment is that there needs to be more money and resources put<br />
toward the sector as a whole. Between limiting pollution and dramatically<br />
reducing congestion, Canadians agree that allocating resources to rail as a<br />
mode <strong>of</strong> transportation makes the most sense going forward.<br />
<strong>2012</strong><br />
22<br />
2011 public perception highlights:<br />
••<br />
When asked which mode <strong>of</strong> transportation should be the<br />
highest transportation priority in <strong>Canada</strong>, 56 per cent choose<br />
rail, which is more than five times any other means <strong>of</strong><br />
transportation. Cars rank a distant second at 11 per cent,<br />
followed by buses and planes at 10 per cent each.<br />
••<br />
Two-thirds <strong>of</strong> Canadians (67 per cent) agree with the statement<br />
that “rail transportation should be the highest transportation<br />
priority in <strong>Canada</strong>.”<br />
••<br />
A full 85 per cent <strong>of</strong> Canadians believe the government should<br />
invest to improve tracks for commuter and inter-city train travel.<br />
••<br />
Nearly three-quarters (72 per cent) would recommend jobs in<br />
the railway sector to their friends or family members.
Appendix A <strong>Rail</strong> Operations in <strong>Canada</strong><br />
Title<br />
Ten-year comparison<br />
Percentage change<br />
2011 versus:<br />
2002 2010 2011 2002 2010<br />
Revenue ton-miles (billions) 211.5 247 255.0 20.6 3.2<br />
Revenue tonne-kilometres (billions) 308.8 361 372.3 20.6 3.2<br />
Miles <strong>of</strong> road operated (1) 29,087 27,652 27,167 -6.6 -1.8<br />
Kilometres <strong>of</strong> road operated (1) 46,811 44,501 43,721 -6.6 -1.8<br />
Locomotives 3,129 2,954 2,955 -5.6 0.0<br />
Freight cars (000) 98 72 72 -26.8 -0.1<br />
Gallons <strong>of</strong> fuel (millions) 451 451 437 -3.2 -3.2<br />
Litres <strong>of</strong> fuel (millions) 2,051 2,049 1,984 -3.3 -3.2<br />
Employees 37,296 32,549 33,624 -9.9 3.3<br />
Annual wage per employee ($) 64,229 79,346 83,176 29.5 4.8<br />
1. Miles (kilometres) <strong>of</strong> road operated include road over which a railway has operating rights.<br />
Freight revenue ($) per ton (tonne)<br />
Freight revenue per ton (tonne) is calculated by dividing freight revenue by total tons<br />
(tonnes) originated.<br />
Revenue per Index Consumer Price<br />
ton tonne 2001 = 100 Index<br />
2002 22.89 25.23 102.1 102.2<br />
2003 22.53 24.83 100.4 105.1<br />
2004 23.47 25.87 104.6 107.1<br />
2005 25.60 28.22 114.1 109.4<br />
2006 27.78 30.63 123.9 111.6<br />
2007 28.16 31.04 125.5 114.0<br />
2008 31.24 34.44 139.3 116.7<br />
2009 31.34 34.55 139.7 117.1<br />
2010 30.59 33.71 136.4 119.1<br />
2011 30.57 33.70 136.3 122.6<br />
<strong>2012</strong><br />
23
Appendix A<br />
Freight revenue (cents) per ton-mile (tonne-kilometre)<br />
Revenue per<br />
Index<br />
ton-mile tonne-kilometre 2001 = 100<br />
2002 3.44 2.35 105.2<br />
2003 3.32 2.28 101.5<br />
2004 3.37 2.31 103.1<br />
2005 3.64 2.49 111.3<br />
2006 3.87 2.65 118.3<br />
2007 3.84 2.63 117.4<br />
2008 4.20 2.87 128.4<br />
2009 4.00 2.74 122.3<br />
2010 3.99 2.74 122.0<br />
2011 4.04 2.77 123.5<br />
Freight transportation<br />
Intermodal traffic originated (2)<br />
Trailers Containers Total<br />
(000) (000) (000)<br />
<strong>2012</strong><br />
24<br />
2002 214 1,820 2,034<br />
2003 217 1,937 2,154<br />
2004 149 2,010 2,159<br />
2005 112 2,134 2,246<br />
2006 106 2,251 2,357<br />
2007 102 2,334 2,436<br />
2008 101 2,396 2,497<br />
2009 83 2,033 2,116<br />
2010 81 2,361 2,442<br />
2011 80 2,424 2,504<br />
2. Reflects both Canadian and U.S. operations <strong>of</strong> Canadian Class 1 railways. Intermodal units<br />
are actual counts <strong>of</strong> trailers and containers, regardless <strong>of</strong> size, and are not “twenty-foot<br />
equivalent units (TEUs)”.
Appendix A<br />
Freight transportation<br />
Carload traffic<br />
Carloads Tons Tonnes Tons Tonnes<br />
originated originated originated per per<br />
(000) (000) (000) carload (3) carload (3)<br />
2002 3,992 317,432 287,974 80 73<br />
2003 4,092 327,126 296,768 80 73<br />
2004 4,212 337,923 306,563 80 73<br />
2005 4,290 343,464 311,590 80 73<br />
2006 4,260 339,394 307,897 80 73<br />
2007 4,196 337,989 306,623 81 73<br />
2008 3,984 318,688 289,114 80 73<br />
2009 3,367 269,028 244,062 80 73<br />
2010 3,872 334,264 303,258 86 78<br />
2011 4,044 337,074 305,793 83 76<br />
3. Tons (tonnes) per carload: Tons (tonnes) originated divided by carloads originated.<br />
Freight transportation<br />
Freight train Freight train Revenue Revenue<br />
miles kilometres ton-miles tonne-kilometres<br />
(000) (000) (millions) (millions)<br />
2002 72,194 116,185 211,500 308,759<br />
2003 72,873 117,278 221,653 323,581<br />
2004 74,284 119,548 235,114 343,232<br />
2005 76,400 122,953 241,745 352,912<br />
2006 76,451 123,035 243,744 355,831<br />
2007 74,100 119,253 247,709 361,619<br />
2008 71,712 115,409 237,323 346,457<br />
2009 59,576 95,877 210,898 307,880<br />
2010 65,157 104,859 247,154 360,809<br />
2011 66,082 106,348 255,001 372,264<br />
<strong>2012</strong><br />
25
Appendix A<br />
Freight Transportation<br />
Carloads originated by commodity grouping (4) Forest Machinery &<br />
Agriculture Coal Minerals Products Metals Automotive<br />
2002 364,754 342,432 601,004 403,908 289,619 277,288<br />
2003 345,025 327,182 627,288 430,662 284,718 270,411<br />
2004 412,099 337,592 639,764 442,689 326,020 253,003<br />
2005 416,473 353,197 657,410 433,138 295,022 235,480<br />
2006 453,151 321,266 600,823 388,035 362,000 244,395<br />
2007 454,034 349,983 609,422 317,158 359,982 234,830<br />
2008 430,292 324,931 574,645 253,279 369,475 195,308<br />
2009 474,980 277,048 368,631 182,395 273,800 148,123<br />
2010 462,445 327,419 703,270 205,120 160,895 185,962<br />
2011 466,305 348,556 790,520 228,448 160,827 186,522<br />
Fuels & Paper Food Manufactured &<br />
Chemicals Products Products Miscellaneous Intermodal Total<br />
<strong>2012</strong><br />
26<br />
2002 469,514 274,219 30,391 55,624 691,417 3,800,170<br />
2003 474,342 302,994 32,652 51,652 712,377 3,859,303<br />
2004 485,197 333,061 40,587 63,890 722,412 4,056,314<br />
2005 469,655 333,830 44,169 65,629 769,936 4,073,939<br />
2006 470,833 274,092 41,454 66,333 819,552 4,041,934<br />
2007 470,876 252,150 41,822 65,923 832,663 3,988,843<br />
2008 443,125 228,072 42,365 75,160 847,647 3,784,299<br />
2009 401,141 175,693 42,232 79,445 741,807 3,165,295<br />
2010 419,905 170,823 52,240 92,949 847,832 3,628,860<br />
2011 432,657 157,780 54,948 94,935 890,168 3,811,666<br />
4. Not all member companies record carloads originated by commodity grouping. The Intermodal counts represent<br />
an average load factor that determined the number <strong>of</strong> carloads reported.
Appendix A<br />
Freight transportation<br />
Revenue from carloads originated by commodity grouping ($ millions) (5)<br />
Forest<br />
Machinery &<br />
Agriculture Coal Minerals Products Metals Automotive<br />
2002 732 416 623 619 364 477<br />
2003 761 405 645 615 360 460<br />
2004 875 513 763 798 404 397<br />
2005 948 738 811 969 429 414<br />
2006 1,125 676 764 928 489 433<br />
2007 1,157 709 819 780 476 445<br />
2008 1,161 706 833 646 531 443<br />
2009 1,259 502 525 478 317 337<br />
2010 1,221 598 772 500 381 394<br />
2011 1,297 713 898 564 424 381<br />
Fuels & Paper Food Manufactured &<br />
Chemicals Products Products Miscellaneous Intermodal Total<br />
2002 777 502 55 92 1,679 6,336<br />
2003 739 518 58 96 1,760 6,417<br />
2004 771 595 70 93 1,885 7,164<br />
2005 804 642 74 112 2,152 8,093<br />
2006 836 582 81 114 2,377 8,405<br />
2007 837 541 81 116 2,452 8,413<br />
2008 902 531 89 126 2,702 8,672<br />
2009 818 423 94 113 2,273 7,139<br />
2010 853 437 128 130 2,592 8,006<br />
2011 928 427 146 133 1,893 7,805<br />
5. Not all member companies record revenue from carloads originated by commodity grouping.<br />
<strong>2012</strong><br />
27
Appendix A<br />
Track operated, by provinces and territories (6)<br />
2010 2011<br />
Miles Kilometres Miles Kilometres<br />
Alberta 4,199 6,758 4,094 6,589<br />
British Columbia 4,144 6,669 4,148 6,675<br />
Manitoba 2,724 4,384 2,730 4,394<br />
Nfld. & Labrador 244 393 244 392<br />
New Brunswick 724 1,166 724 1,165<br />
Nova Scotia 409 657 409 658<br />
Ontario 6,549 10,540 6,365 10,244<br />
Quebec 3,695 5,947 3,690 5,938<br />
Saskatchewan 4,889 7,868 4,687 7,543<br />
Northwest Territories 75 121 75 121<br />
Total 27,652 44,501 27,167 43,721<br />
Intercity passenger trains 7,820 12,585 7,820 12,585<br />
Commuter and tourist trains 1,961 3,155 2,746 4,419<br />
Segments terminating in the U.S. 152 245 152 245<br />
Grand total 37,585 60,486 37,884 60,969<br />
6. First main track only. Excludes second and other main track, passing tracks and crossovers, industrial tracks,<br />
spurs and yard tracks.<br />
<strong>2012</strong><br />
28
Appendix A<br />
Plant - track operated (7)<br />
Equipment in service<br />
Index<br />
Freight cars Locomotives<br />
Miles Kilometres 2001 = 100 in service in service<br />
2002 29,087 46,811 100.5 2002 98,001 3,129<br />
2003 29,138 46,893 100.6 2003 97,039 3,170<br />
2004 30,551 49,167 105.5 2004 99,141 3,234<br />
2005 30,380 48,893 104.9 2005 101,606 3,253<br />
2006 29,978 48,243 103.5 2006 99,946 3,271<br />
2007 29,713 47,816 102.6 2007 92,373 3,165<br />
2008 29,366 47,258 101.4 2008 83,984 3,046<br />
2009 28,163 45,323 97.3 2009 75,836 2,742<br />
2010 27,654 44,501 95.5 2010 71,788 2,954<br />
2011 27,167 43,721 93.8 2011 71,750 2,977<br />
7. First main track only. Excludes second and other main track, passing tracks and crossovers, industrial tracks,<br />
spurs and yard tracks. Excludes intercity passenger trains, commuter & tourist trains and segments terminating<br />
in the U.S.<br />
Employment<br />
Employment<br />
Total Average Average<br />
compensation number <strong>of</strong> annual wage<br />
($ millions) (8) employees per employee ($)<br />
2002 2,392 37,296 64,229<br />
2003 2,412 36,599 65,901<br />
2004 2,387 35,736 66,804<br />
2005 2,548 35,389 71,994<br />
2006 2,535 34,558 73,356<br />
2007 2,566 34,938 73,440<br />
2008 2,633 35,208 74,790<br />
2009 2,439 32,337 75,415<br />
2010 2,584 32,565 79,346<br />
2011 2,797 33,624 83,175<br />
<strong>2012</strong><br />
29<br />
8. Compensation includes salaries and compensation paid and excludes company paid benefits such as<br />
<strong>Canada</strong>/Quebec Pension Plan, Unemployment Insurance and health taxes.
Appendix A<br />
Train statistics<br />
Average: Length <strong>of</strong> haul/Cars per train<br />
Miles (kilometres) hauled Miles (kilometres) hauled Average<br />
by transcontinental by regional/short line cars per<br />
railways (CN and CPR) railways freight train<br />
Miles Kilometres Miles Kilometres Cars<br />
2002 795 1,279 150 241 74<br />
2003 794 1,278 151 243 74<br />
2004 787 1,267 161 259 78<br />
2005 789 1,270 149 240 79<br />
2006 803 1,292 159 256 79<br />
2007 807 1,299 151 243 81<br />
2008 (9) 818 1,316 146 235 82<br />
2009 830 1,336 159 256 87<br />
2010 850 1,368 138 163 92<br />
2011 849 1,366 170 274 81<br />
9. 2008 “Miles (kilometres) hauled by regional/short line railways” were restated.<br />
Passenger transportation<br />
Intercity passenger transportation<br />
<strong>2012</strong><br />
30<br />
Passenger cars Number <strong>of</strong> Passenger<br />
in service passengers miles kilometres<br />
(000) (millions) (millions)<br />
2002 473 4,223 992 1,597<br />
2003 505 4,024 931 1,498<br />
2004 465 4,181 894 1,439<br />
2005 538 4,322 919 1,479<br />
2006 537 4,320 906 1,458<br />
2007 538 4,478 912 1,468<br />
2008 (10) 540 4,899 986 1,588<br />
2009 559 4,538 894 1,439<br />
2010 545 4,477 877 1,412<br />
2011 544 4,461 888 1,428<br />
10. 2008 “Passenger kilometres” were restated.
Appendix A<br />
Passenger transportation<br />
Intercity passenger transportation<br />
Passenger train<br />
Passenger car<br />
miles kilometres miles kilometres<br />
(000) (000) (000) (000)<br />
2002 7,406 11,919 50,035 80,523<br />
2003 7,252 11,671 50,087 80,607<br />
2004 7,214 11,611 49,707 79,995<br />
2005 7,415 11,933 49,966 80,412<br />
2006 7,381 11,879 49,400 79,501<br />
2007 7,330 11,796 48,708 78,388<br />
2008 7,414 11,932 49,140 79,083<br />
2009 7,334 11,803 47,290 76,106<br />
2010 7,331 11,799 46,275 74,472<br />
2011 7,273 11,705 48,239 77,633<br />
Average intercity passengers<br />
Average length <strong>of</strong> journey<br />
per train miles kilometres<br />
2002 134 238 383<br />
2003 128 226 364<br />
2004 124 219 352<br />
2005 124 217 349<br />
2006 123 214 344<br />
2007 124 209 336<br />
2008 133 206 332<br />
2009 122 203 327<br />
2010 120 204 328<br />
2011 122 204 328<br />
<strong>2012</strong><br />
31<br />
Average passenger load factor (%) On-time performance (%)<br />
2002 57 84<br />
2003 53 73<br />
2004 53 70<br />
2005 55 81<br />
2006 54 84<br />
2007 55 77<br />
2008 59 75<br />
2009 57 83<br />
2010 57 82<br />
2011 55 84
Appendix A<br />
Passenger transportation<br />
<strong>Rail</strong> commuter<br />
Commuter train<br />
Commuter car<br />
miles kilometres miles kilometres<br />
(000) (000) (000) (000)<br />
2002 199,957 321,801 2,592 4,171<br />
2003 204,198 328,626 2,724 4,384<br />
2004 214,089 344,544 2,749 4,425<br />
2005 224,833 361,834 2,820 4,539<br />
2006 237,781 382,672 2,730 4,394<br />
2007 247,066 397,615 2,808 4,518<br />
2008 256,123 412,190 2,832 4,558<br />
2009 245,942 395,806 2,876 4,628<br />
2010 256,134 412,209 3,008 4,841<br />
2011 278,244 447,791 3,171 5,103<br />
Average rail commuters <strong>Rail</strong> commuters (000)<br />
per train<br />
in British Columbia, Ontario and Quebec<br />
<strong>2012</strong><br />
32<br />
2002 284 50,132<br />
2003 260 52,688<br />
2004 287 54,905<br />
2005 283 58,235<br />
2006 300 60,634<br />
2007 339 63,393<br />
2008 340 67,052<br />
2009 301 65,962<br />
2010 310 68,562<br />
2011 255 68,427
Appendix A<br />
Additions to property<br />
Additions to property ($ millions)<br />
Buildings &<br />
Signals,<br />
Track & related machinery communications Terminals &<br />
roadway & equipment. & power fuel stations<br />
2002 374 310 42 17<br />
2003 333 202 47 24<br />
2004 364 188 38 11<br />
2005 582 189 95 27<br />
2006 613 212 74 37<br />
2007 618 255 44 43<br />
2008 688 189 79 26<br />
2009 706 257 72 24<br />
2010 804 231 109 16<br />
2011 971 314 108 15<br />
Work equipment<br />
Rolling Intermodal & roadway Other Total<br />
stock equipment machines equipment additions<br />
2002 208 16 34 14 1,015<br />
2003 313 25 41 21 1,006<br />
2004 337 30 36 39 1,043<br />
2005 416 39 31 15 1,394<br />
2006 352 48 44 28 1,408<br />
2007 350 30 41 18 1,399<br />
2008 290 29 68 22 1,391<br />
2009 317 34 42 72 1,524<br />
2010 427 15 49 55 1,706<br />
2011 297 11 53 64 1,834<br />
<strong>2012</strong><br />
33
Appendix A<br />
Productivity<br />
Revenue ton-miles per employee<br />
Revenue Revenue Road Road<br />
ton-miles per tonne-kilometres per miles per kilometres per<br />
employee (000) employee (000) employee employee<br />
2002 6,319 9,225 0.87 1.40<br />
2003 6,764 9,874 0.89 1.43<br />
2004 7,352 10,733 0.93 1.50<br />
2005 7,679 11,210 0.96 1.54<br />
2006 7,963 11,625 0.98 1.58<br />
2007 8,045 11,745 0.96 1.54<br />
2008 (11) 7,625 11,132 0.94 1.51<br />
2009 7,404 10,809 0.98 1.58<br />
2010 8,287 12,098 0.96 1.54<br />
2011 8,496 12,402 0.90 1.46<br />
11. 2008 Productivity statistics were restated.<br />
<strong>2012</strong><br />
34
Appendix B Financial Highlights<br />
Operating Income<br />
Operating revenue ($millions)<br />
Freight Passenger (12) Other Total<br />
2002 7,266 389 487 8,142<br />
2003 7,369 364 484 8,217<br />
2004 7,931 386 506 8,823<br />
2005 8,794 576 570 9,940<br />
2006 9,430 622 561 10,613<br />
2007 9,516 624 564 10,704<br />
2008 9,957 661 579 11,197<br />
2009 8,433 627 539 9,599<br />
2010 9,551 673 544 10,768<br />
2011 10,305 667 560 11,532<br />
12. Federal, provincial and municipal funding <strong>of</strong> $435 million in 2009 for Intercity passenger and commuter services<br />
is excluded.<br />
Operating income ($millions)<br />
Income<br />
2002 1,428<br />
2003 1,484<br />
2004 1,704<br />
2005 2,164<br />
2006 2,402<br />
2007 2,209<br />
2008 2,030<br />
2009 1,247<br />
2010 1,598<br />
2011 1,763<br />
<strong>2012</strong><br />
35
Appendix B<br />
Operating expenses<br />
Operating expenses ($millions) (13) Maintenance (14)<br />
Transportation Fuel <strong>of</strong> equipment<br />
2002 2,037 734 1,300<br />
2003 2,086 781 1,280<br />
2004 2,180 862 1,290<br />
2005 2,241 1,159 1,382<br />
2006 2,224 1,367 1,575<br />
2007 2,337 1,513 1,634<br />
2008 2,376 2,032 1,564<br />
2009 2,065 1,212 1,555<br />
2010 2,195 1,464 1,452<br />
2011 2,381 1,854 1,570<br />
Maintenance-<strong>of</strong>-way General and Total operating<br />
and structures administrative expense<br />
<strong>2012</strong><br />
36<br />
2002 1,374 1,269 6,714<br />
2003 1,421 1,165 6,733<br />
2004 1,421 1,366 7,119<br />
2005 1,493 1,501 7,776<br />
2006 1,408 1,637 8,211<br />
2007 1,549 1,462 8,495<br />
2008 1,718 1,477 9,167<br />
2009 1,612 1,908 8,352<br />
2010 1,766 2,294 9,171<br />
2011 1,910 2,054 9,769<br />
13. Charges for restructuring, relocation and write-down <strong>of</strong> assets are excluded.<br />
14. CN restated 2006 Maintenance <strong>of</strong> equipment and Maintenance-<strong>of</strong>-way and structures expenses.<br />
The net impact on 2006 Total operating expense was nil.
Appendix B<br />
Taxes by category ($millions)<br />
Locomotive Other Capital tax<br />
fuel & Property sales & customs Income Payroll<br />
Total excise tax tax tax duties tax taxes<br />
2002 654 168 143 118 42 27 156<br />
2003 742 173 139 101 64 110 155<br />
2004 698 174 141 90 25 118 150<br />
2005 716 180 155 98 31 101 151<br />
2006 1,084 188 155 102 21 471 147<br />
2007 989 188 154 97 15 381 154<br />
2008 930 187 152 99 14 323 155<br />
2009 853 177 152 97 14 265 148<br />
2010 787 195 150 96 14 185 147<br />
2011 958 204 153 70 0 372 158<br />
Payroll taxes ($millions)<br />
<strong>Canada</strong>/Quebec Unemployment Health<br />
Pension Plan Insurance Taxes Total<br />
2002 68 45 43 156<br />
2003 73 42 40 155<br />
2004 71 37 42 150<br />
2005 72 36 43 151<br />
2006 72 32 43 147<br />
2007 75 33 46 154<br />
2008 77 33 45 155<br />
2009 74 30 44 148<br />
2010 73 31 43 147<br />
2011 77 34 47 158<br />
<strong>2012</strong><br />
37
Appendix B<br />
Taxes by jurisdiction ($ 000)<br />
Locomotive fuel Fuel tax per litre<br />
& excise tax (cents) Property tax<br />
2010 2011 2011 2010 2011<br />
Alberta 4,535 4,482 1.5 12,616 13,071<br />
British Columbia 38,949 44,265 10.7 39,520 38,437<br />
Manitoba 9,765 9,877 6.3 13,505 13,773<br />
Nfld. & Labrador 0 0 16.5 53 55<br />
New Brunswick 1,559 1,283 4.3 1,660 1,737<br />
Nova Scotia 17 17 15.4 2,760 2,771<br />
Ontario 24,127 25,413 4.5 34,784 36,930<br />
Quebec 4,852 4,807 17.2 31,012 31,141<br />
Saskatchewan 35,158 36,875 15.0 14,040 14,917<br />
Northwest Territories 0 0 11.4 75 73<br />
Federal 76,436 77,296 4.0 0 0<br />
Total 195,397 204,314 150,025 152,905<br />
Capital tax &<br />
Other sales tax customs duties Income tax<br />
2010 2011 2010 2011 2010 2011<br />
<strong>2012</strong><br />
38<br />
Alberta 44 43 0 124 11,586 22,325<br />
British Columbia 11,507 403 2 0 229 0<br />
Manitoba 11,810 12,378 2,486 169 0 597<br />
Nfld. & Labrador 0 0 0 0 0 0<br />
New Brunswick 0 0 0 0 1,617 1,620<br />
Nova Scotia 0 0 200 171 290 381<br />
Ontario 17,084 1,550 7,747 -130 44,763 38,840<br />
Quebec 12,892 13,080 2,900 81 6,412 13,814<br />
Saskatchewan 7,672 7,598 0 -386 36 -31<br />
Northwest Territories 0 0 0 0 0 0<br />
Federal 35,218 35,311 270 42 119,732 294,341<br />
Total 96,227 70,363 13,605 71 184,665 371,887
Glossary<br />
Average length <strong>of</strong> haul: Calculated by dividing revenue ton-miles by<br />
revenue tons.<br />
Average cars per freight train: Calculated by dividing loaded and empty<br />
car miles by train miles.<br />
Container: A large, weatherpro<strong>of</strong> box designed for shipping and/or<br />
transferring freight between rail, truck or marine modes. Specialized<br />
containers are equipped with heating and cooling capabilities for<br />
perishable products.<br />
Gross ton-miles (Gross tonne-kilometres): The sum <strong>of</strong> ton-miles<br />
handled, calculated using the total weight <strong>of</strong> the trailing tonnage (both<br />
loaded and empty cars) <strong>of</strong> the trains moved. It excludes the weight <strong>of</strong><br />
the locomotives pulling the trains.<br />
Intermodal service: The movement <strong>of</strong> trailers or containers by rail and<br />
at least one other mode <strong>of</strong> transportation. Import and export containers<br />
generally are shipped via marine and rail. Domestic intermodal service<br />
usually involves truck and rail.<br />
On-time performance: The ability to meet customer requirements as to<br />
pick-up and delivery schedules.<br />
Reload centre: A transfer facility enabling the railway to expand market<br />
share through truck-to-rail service.<br />
<strong>2012</strong><br />
39<br />
Revenue ton-miles (Revenue tonne-kilometres): The sum <strong>of</strong> tonmiles<br />
handled, calculated using the total weight <strong>of</strong> the commodities in<br />
the cars <strong>of</strong> the trains moved. It excludes the ton-miles involved in the<br />
movement <strong>of</strong> railway materials or any other non-revenue movement.<br />
Scheduled railroad: A railroad that handles individual car movements<br />
according to a specific plan where possible and manages expectations to<br />
meet agreed upon customer commitments.
Glossary<br />
Track operated: First main track only. Excludes second and other main<br />
track, passing tracks and crossovers, industrial tracks, spurs and yard tracks.<br />
Trip plan: A detailed chain <strong>of</strong> train handling events describing car<br />
handling from shipper’s door to consignee’s door. Trip plans are<br />
expressed in hours and are tailored for each specific customer location.<br />
Unit train: A train with a fixed, coupled consist <strong>of</strong> cars operated<br />
continuously in shuttle service under load from origin and delivered<br />
intact at destination and returning usually for reloading at the same<br />
origin.<br />
CONVERSION FACTORS<br />
miles to kilometres 1.6093<br />
tons (short) to metric tonnes 0.9072<br />
gallons to litres 4.5461<br />
revenue ton-miles to revenue tonne-kilometres 1.4599<br />
kilometres to miles 0.6214<br />
metric tonnes to tons (short) 1.1023<br />
litres to gallons 0.2200<br />
revenue tonne-kilometres to revenue ton-miles 0.6850<br />
<strong>2012</strong><br />
40<br />
LIST OF ACRONYMS<br />
BGTM Billion gross ton-miles<br />
CAC Criteria Air Contaminants<br />
CDP Carbon Disclosure Project<br />
DG Dangerous Goods<br />
GHG Greenhouse Gas Emissions<br />
LEM Locomotive Emissions Monitoring<br />
MOU Memorandum <strong>of</strong> Understanding<br />
RAC <strong>Rail</strong>way <strong>Association</strong> <strong>of</strong> <strong>Canada</strong><br />
RTK Revenue ton-kilometres<br />
RTM Revenue ton-miles<br />
TSB Transportation Safety Board