2012 Rail Trends - Railway Association of Canada
2012 Rail Trends - Railway Association of Canada
2012 Rail Trends - Railway Association of Canada

Create successful ePaper yourself
Turn your PDF publications into a flip-book with our unique Google optimized e-Paper software.
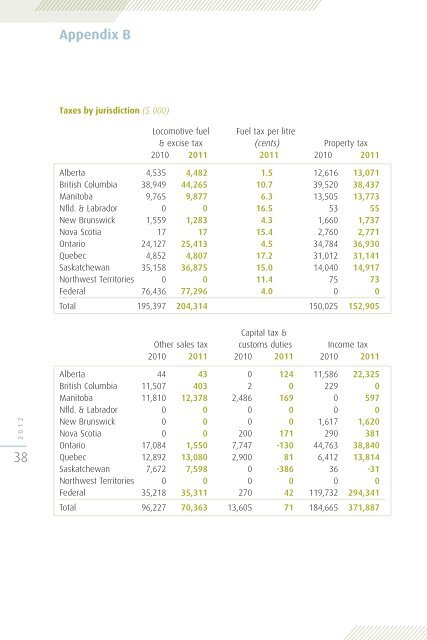
Appendix B<br />
Taxes by jurisdiction ($ 000)<br />
Locomotive fuel Fuel tax per litre<br />
& excise tax (cents) Property tax<br />
2010 2011 2011 2010 2011<br />
Alberta 4,535 4,482 1.5 12,616 13,071<br />
British Columbia 38,949 44,265 10.7 39,520 38,437<br />
Manitoba 9,765 9,877 6.3 13,505 13,773<br />
Nfld. & Labrador 0 0 16.5 53 55<br />
New Brunswick 1,559 1,283 4.3 1,660 1,737<br />
Nova Scotia 17 17 15.4 2,760 2,771<br />
Ontario 24,127 25,413 4.5 34,784 36,930<br />
Quebec 4,852 4,807 17.2 31,012 31,141<br />
Saskatchewan 35,158 36,875 15.0 14,040 14,917<br />
Northwest Territories 0 0 11.4 75 73<br />
Federal 76,436 77,296 4.0 0 0<br />
Total 195,397 204,314 150,025 152,905<br />
Capital tax &<br />
Other sales tax customs duties Income tax<br />
2010 2011 2010 2011 2010 2011<br />
<strong>2012</strong><br />
38<br />
Alberta 44 43 0 124 11,586 22,325<br />
British Columbia 11,507 403 2 0 229 0<br />
Manitoba 11,810 12,378 2,486 169 0 597<br />
Nfld. & Labrador 0 0 0 0 0 0<br />
New Brunswick 0 0 0 0 1,617 1,620<br />
Nova Scotia 0 0 200 171 290 381<br />
Ontario 17,084 1,550 7,747 -130 44,763 38,840<br />
Quebec 12,892 13,080 2,900 81 6,412 13,814<br />
Saskatchewan 7,672 7,598 0 -386 36 -31<br />
Northwest Territories 0 0 0 0 0 0<br />
Federal 35,218 35,311 270 42 119,732 294,341<br />
Total 96,227 70,363 13,605 71 184,665 371,887