2012 Rail Trends - Railway Association of Canada
2012 Rail Trends - Railway Association of Canada
2012 Rail Trends - Railway Association of Canada

Create successful ePaper yourself
Turn your PDF publications into a flip-book with our unique Google optimized e-Paper software.
Appendix A<br />
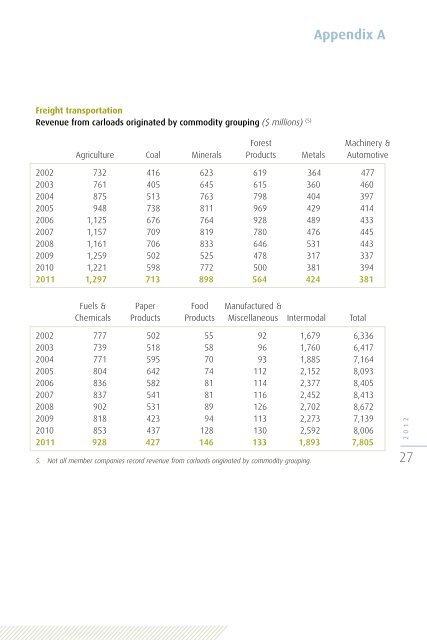
Freight transportation<br />
Revenue from carloads originated by commodity grouping ($ millions) (5)<br />
Forest<br />
Machinery &<br />
Agriculture Coal Minerals Products Metals Automotive<br />
2002 732 416 623 619 364 477<br />
2003 761 405 645 615 360 460<br />
2004 875 513 763 798 404 397<br />
2005 948 738 811 969 429 414<br />
2006 1,125 676 764 928 489 433<br />
2007 1,157 709 819 780 476 445<br />
2008 1,161 706 833 646 531 443<br />
2009 1,259 502 525 478 317 337<br />
2010 1,221 598 772 500 381 394<br />
2011 1,297 713 898 564 424 381<br />
Fuels & Paper Food Manufactured &<br />
Chemicals Products Products Miscellaneous Intermodal Total<br />
2002 777 502 55 92 1,679 6,336<br />
2003 739 518 58 96 1,760 6,417<br />
2004 771 595 70 93 1,885 7,164<br />
2005 804 642 74 112 2,152 8,093<br />
2006 836 582 81 114 2,377 8,405<br />
2007 837 541 81 116 2,452 8,413<br />
2008 902 531 89 126 2,702 8,672<br />
2009 818 423 94 113 2,273 7,139<br />
2010 853 437 128 130 2,592 8,006<br />
2011 928 427 146 133 1,893 7,805<br />
5. Not all member companies record revenue from carloads originated by commodity grouping.<br />
<strong>2012</strong><br />
27