2012 Rail Trends - Railway Association of Canada
2012 Rail Trends - Railway Association of Canada
2012 Rail Trends - Railway Association of Canada

Create successful ePaper yourself
Turn your PDF publications into a flip-book with our unique Google optimized e-Paper software.
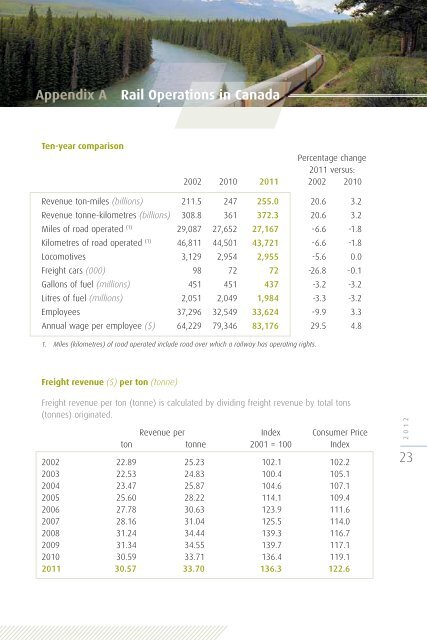
Appendix A <strong>Rail</strong> Operations in <strong>Canada</strong><br />
Title<br />
Ten-year comparison<br />
Percentage change<br />
2011 versus:<br />
2002 2010 2011 2002 2010<br />
Revenue ton-miles (billions) 211.5 247 255.0 20.6 3.2<br />
Revenue tonne-kilometres (billions) 308.8 361 372.3 20.6 3.2<br />
Miles <strong>of</strong> road operated (1) 29,087 27,652 27,167 -6.6 -1.8<br />
Kilometres <strong>of</strong> road operated (1) 46,811 44,501 43,721 -6.6 -1.8<br />
Locomotives 3,129 2,954 2,955 -5.6 0.0<br />
Freight cars (000) 98 72 72 -26.8 -0.1<br />
Gallons <strong>of</strong> fuel (millions) 451 451 437 -3.2 -3.2<br />
Litres <strong>of</strong> fuel (millions) 2,051 2,049 1,984 -3.3 -3.2<br />
Employees 37,296 32,549 33,624 -9.9 3.3<br />
Annual wage per employee ($) 64,229 79,346 83,176 29.5 4.8<br />
1. Miles (kilometres) <strong>of</strong> road operated include road over which a railway has operating rights.<br />
Freight revenue ($) per ton (tonne)<br />
Freight revenue per ton (tonne) is calculated by dividing freight revenue by total tons<br />
(tonnes) originated.<br />
Revenue per Index Consumer Price<br />
ton tonne 2001 = 100 Index<br />
2002 22.89 25.23 102.1 102.2<br />
2003 22.53 24.83 100.4 105.1<br />
2004 23.47 25.87 104.6 107.1<br />
2005 25.60 28.22 114.1 109.4<br />
2006 27.78 30.63 123.9 111.6<br />
2007 28.16 31.04 125.5 114.0<br />
2008 31.24 34.44 139.3 116.7<br />
2009 31.34 34.55 139.7 117.1<br />
2010 30.59 33.71 136.4 119.1<br />
2011 30.57 33.70 136.3 122.6<br />
<strong>2012</strong><br />
23