2012 Rail Trends - Railway Association of Canada
2012 Rail Trends - Railway Association of Canada
2012 Rail Trends - Railway Association of Canada

You also want an ePaper? Increase the reach of your titles
YUMPU automatically turns print PDFs into web optimized ePapers that Google loves.
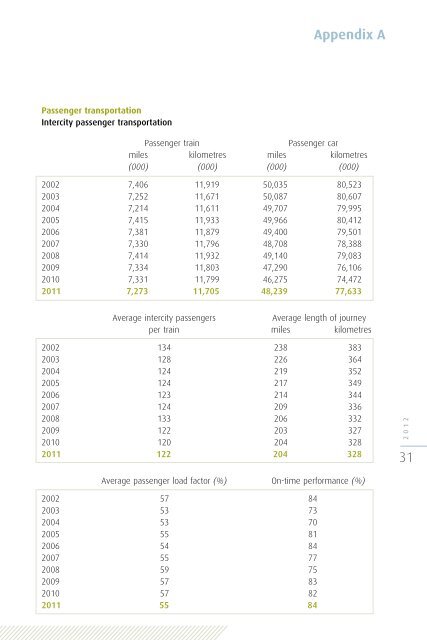
Appendix A<br />
Passenger transportation<br />
Intercity passenger transportation<br />
Passenger train<br />
Passenger car<br />
miles kilometres miles kilometres<br />
(000) (000) (000) (000)<br />
2002 7,406 11,919 50,035 80,523<br />
2003 7,252 11,671 50,087 80,607<br />
2004 7,214 11,611 49,707 79,995<br />
2005 7,415 11,933 49,966 80,412<br />
2006 7,381 11,879 49,400 79,501<br />
2007 7,330 11,796 48,708 78,388<br />
2008 7,414 11,932 49,140 79,083<br />
2009 7,334 11,803 47,290 76,106<br />
2010 7,331 11,799 46,275 74,472<br />
2011 7,273 11,705 48,239 77,633<br />
Average intercity passengers<br />
Average length <strong>of</strong> journey<br />
per train miles kilometres<br />
2002 134 238 383<br />
2003 128 226 364<br />
2004 124 219 352<br />
2005 124 217 349<br />
2006 123 214 344<br />
2007 124 209 336<br />
2008 133 206 332<br />
2009 122 203 327<br />
2010 120 204 328<br />
2011 122 204 328<br />
<strong>2012</strong><br />
31<br />
Average passenger load factor (%) On-time performance (%)<br />
2002 57 84<br />
2003 53 73<br />
2004 53 70<br />
2005 55 81<br />
2006 54 84<br />
2007 55 77<br />
2008 59 75<br />
2009 57 83<br />
2010 57 82<br />
2011 55 84