2012 Rail Trends - Railway Association of Canada
2012 Rail Trends - Railway Association of Canada
2012 Rail Trends - Railway Association of Canada

You also want an ePaper? Increase the reach of your titles
YUMPU automatically turns print PDFs into web optimized ePapers that Google loves.
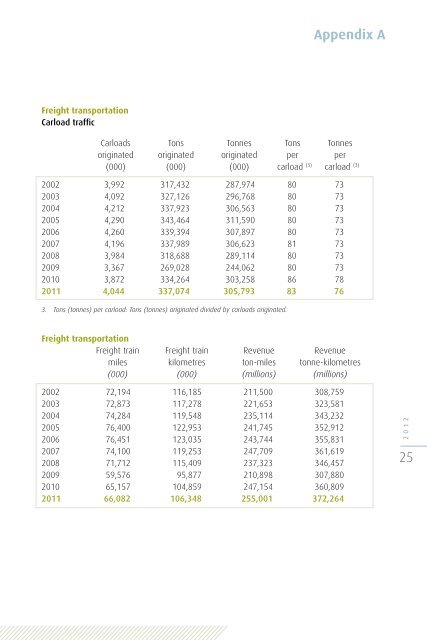
Appendix A<br />
Freight transportation<br />
Carload traffic<br />
Carloads Tons Tonnes Tons Tonnes<br />
originated originated originated per per<br />
(000) (000) (000) carload (3) carload (3)<br />
2002 3,992 317,432 287,974 80 73<br />
2003 4,092 327,126 296,768 80 73<br />
2004 4,212 337,923 306,563 80 73<br />
2005 4,290 343,464 311,590 80 73<br />
2006 4,260 339,394 307,897 80 73<br />
2007 4,196 337,989 306,623 81 73<br />
2008 3,984 318,688 289,114 80 73<br />
2009 3,367 269,028 244,062 80 73<br />
2010 3,872 334,264 303,258 86 78<br />
2011 4,044 337,074 305,793 83 76<br />
3. Tons (tonnes) per carload: Tons (tonnes) originated divided by carloads originated.<br />
Freight transportation<br />
Freight train Freight train Revenue Revenue<br />
miles kilometres ton-miles tonne-kilometres<br />
(000) (000) (millions) (millions)<br />
2002 72,194 116,185 211,500 308,759<br />
2003 72,873 117,278 221,653 323,581<br />
2004 74,284 119,548 235,114 343,232<br />
2005 76,400 122,953 241,745 352,912<br />
2006 76,451 123,035 243,744 355,831<br />
2007 74,100 119,253 247,709 361,619<br />
2008 71,712 115,409 237,323 346,457<br />
2009 59,576 95,877 210,898 307,880<br />
2010 65,157 104,859 247,154 360,809<br />
2011 66,082 106,348 255,001 372,264<br />
<strong>2012</strong><br />
25