Pilot Study, Fault Identification and Effect of Maintenance
Pilot Study, Fault Identification and Effect of Maintenance
Pilot Study, Fault Identification and Effect of Maintenance

Create successful ePaper yourself
Turn your PDF publications into a flip-book with our unique Google optimized e-Paper software.
Diesel Vehicle Emissions – In-Service Emissions Testing – <strong>Pilot</strong> <strong>Study</strong>, <strong>Fault</strong> <strong>Identification</strong> <strong>and</strong> <strong>Effect</strong> <strong>of</strong> <strong>Maintenance</strong> - Appendices<br />
Original<br />
Test No<br />
Rank<br />
NOx<br />
(g/km.t)<br />
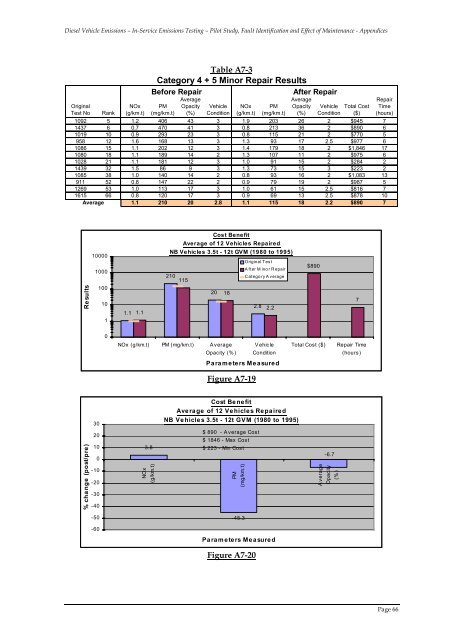
Table A7-3<br />
Category 4 + 5 Minor Repair Results<br />
Before Repair<br />
After Repair<br />
PM<br />
(mg/km.t)<br />
Average<br />
Opacity<br />
(%)<br />
Vehicle<br />
Condition<br />
NOx<br />
(g/km.t)<br />
PM<br />
(mg/km.t)<br />
Average<br />
Opacity<br />
(%)<br />
Vehicle<br />
Condition<br />
Total Cost<br />
($)<br />
1092 5 1.2 406 43 3 1.9 203 26 2 $945 7<br />
1437 6 0.7 470 41 3 0.8 213 36 2 $890 6<br />
1019 10 0.9 293 23 3 0.8 115 21 2 $770 5<br />
958 12 1.6 168 13 3 1.3 93 17 2.5 $977 6<br />
1086 15 1.1 202 12 3 1.4 179 18 2 $1,846 17<br />
1080 18 1.1 189 14 2 1.3 107 11 2 $975 6<br />
1028 21 1.1 181 12 3 1.0 91 15 2 $284 2<br />
1439 32 1.5 86 9 3 1.3 73 15 3 $223 2<br />
1085 38 1.0 140 14 2 0.8 93 16 2 $1,083 13<br />
911 52 0.8 147 22 2 0.9 79 19 2 $987 5<br />
1269 53 1.0 113 17 3 1.0 61 15 2.5 $816 7<br />
1615 66 0.8 120 17 3 0.9 69 13 2.5 $878 10<br />
Average 1.1 210 20 2.8 1.1 115 18 2.2 $890 7<br />
Repair<br />
Time<br />
(hours)<br />
Results<br />
10000<br />
1000<br />
100<br />
10<br />
1<br />
1.1<br />
1.1<br />
Cost Benefit<br />
Average <strong>of</strong> 12 Vehicles Repaired<br />
NB Vehicles 3.5t - 12t GVM (1980 to 1995)<br />
Original Test<br />
A fter M inor Repair<br />
210<br />
Catego ry A verage<br />
115<br />
20 18<br />
2.8 2.2<br />
$890<br />
7<br />
0<br />
NOx (g/km.t) PM (mg/km.t) Average<br />
Opacity (%)<br />
Vehicle<br />
Condition<br />
Total Cost ($)<br />
Repair Time<br />
(hours)<br />
Parameters Measured<br />
Figure A7-19<br />
% change (post/pre)<br />
30<br />
20<br />
10<br />
0<br />
-10<br />
-20<br />
-30<br />
-40<br />
3.8<br />
NOx<br />
(g/km.t)<br />
Cost Benefit<br />
Average <strong>of</strong> 12 Vehicles Repaired<br />
NB Vehicles 3.5t - 12t GVM (1980 to 1995)<br />
$ 890 - Average Cost<br />
$ 1846 - Max Cost<br />
$ 223 - Min Cost<br />
PM<br />
(mg/km.t)<br />
-6.7<br />
Average<br />
Opacity<br />
(%)<br />
-50<br />
-45.3<br />
-60<br />
Parameters Measured<br />
Figure A7-20<br />
Page 66