Pilot Study, Fault Identification and Effect of Maintenance
Pilot Study, Fault Identification and Effect of Maintenance
Pilot Study, Fault Identification and Effect of Maintenance

Create successful ePaper yourself
Turn your PDF publications into a flip-book with our unique Google optimized e-Paper software.
Diesel Vehicle Emissions – In-Service Emissions Testing – <strong>Pilot</strong> <strong>Study</strong>, <strong>Fault</strong> <strong>Identification</strong> <strong>and</strong> <strong>Effect</strong> <strong>of</strong> <strong>Maintenance</strong> - Appendices<br />
Original<br />
Test No<br />
Rank<br />
NOx<br />
(g/km.t)<br />
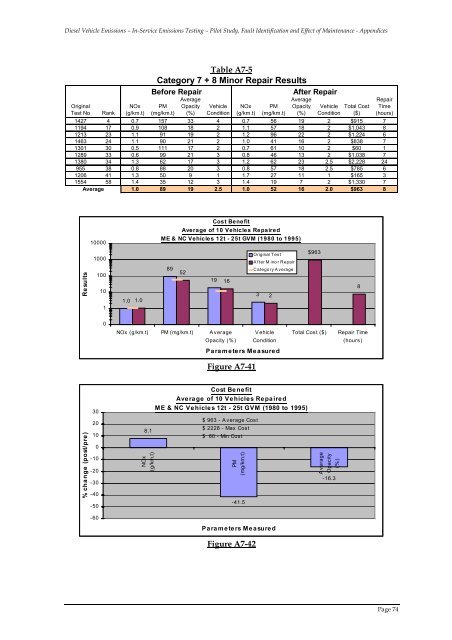
Table A7-5<br />
Category 7 + 8 Minor Repair Results<br />
Before Repair<br />
After Repair<br />
PM<br />
(mg/km.t)<br />
Average<br />
Opacity<br />
(%)<br />
Vehicle<br />
Condition<br />
NOx<br />
(g/km.t)<br />
PM<br />
(mg/km.t)<br />
Average<br />
Opacity<br />
(%)<br />
Vehicle<br />
Condition<br />
Total Cost<br />
($)<br />
1427 4 0.7 157 33 4 0.7 56 19 2 $915 7<br />
1194 17 0.9 108 18 2 1.1 57 18 2 $1,043 8<br />
1213 23 1.1 91 19 2 1.2 96 22 2 $1,224 6<br />
1463 24 1.1 90 21 2 1.0 41 16 2 $838 7<br />
1301 30 0.5 111 17 2 0.7 61 10 2 $60 1<br />
1289 33 0.6 99 21 3 0.8 46 13 2 $1,038 7<br />
1380 34 1.3 62 17 3 1.2 62 23 2.5 $2,228 24<br />
955 38 0.8 88 20 3 0.8 57 18 2.5 $785 6<br />
1206 41 1.3 50 9 1 1.7 27 11 1 $165 3<br />
1554 58 1.4 35 12 3 1.4 19 7 2 $1,330 7<br />
Average 1.0 89 19 2.5 1.0 52 16 2.0 $963 8<br />
Repair<br />
Time<br />
(hours)<br />
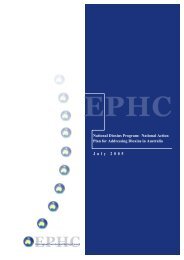
10000<br />
Cost Benefit<br />
Average <strong>of</strong> 10 Vehicles Repaired<br />
ME & NC Vehicles 12t - 25t GVM (1980 to 1995)<br />
Results<br />
1000<br />
100<br />
10<br />
1<br />
1.0<br />
1.0<br />
89<br />
52<br />
19<br />
16<br />
Original Test<br />
After M inor Repair<br />
Category Average<br />
3 2<br />
$963<br />
8<br />
0<br />
NOx (g/km.t) PM (mg/km.t) Average<br />
Opacity (%)<br />
Vehicle<br />
Condition<br />
Total Cost ($)<br />
Repair Time<br />
(hours)<br />
Parameters Measured<br />
Figure A7-41<br />
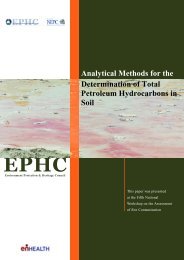
% change (post/pre)<br />
30<br />
20<br />
10<br />
0<br />
-10<br />
-20<br />
-30<br />
-40<br />
-50<br />
-60<br />
8.1<br />
NOx<br />
(g/km.t)<br />
Cost Benefit<br />
Average <strong>of</strong> 10 Vehicles Repaired<br />
ME & NC Vehicles 12t - 25t GVM (1980 to 1995)<br />
$ 963 - Average Cost<br />
$ 2228 - Max Cost<br />
$ 60 - Min Cost<br />
PM<br />
(mg/km.t)<br />
-41.5<br />
Parameters Measured<br />
Figure A7-42<br />
Average<br />
Opacity<br />
(%)<br />
-16.3<br />
Page 74