Use of COMSOL In Aerodynamic Optimization of the ... - COMSOL.com
Use of COMSOL In Aerodynamic Optimization of the ... - COMSOL.com
Use of COMSOL In Aerodynamic Optimization of the ... - COMSOL.com

Create successful ePaper yourself
Turn your PDF publications into a flip-book with our unique Google optimized e-Paper software.
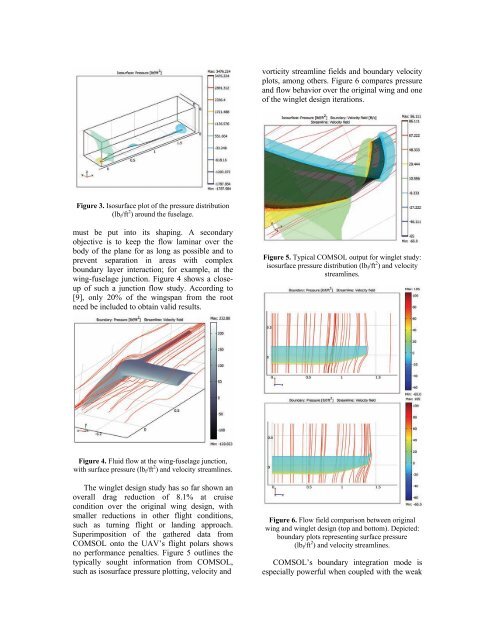
vorticity streamline fields and boundary velocity<br />
plots, among o<strong>the</strong>rs. Figure 6 <strong>com</strong>pares pressure<br />
and flow behavior over <strong>the</strong> original wing and one<br />
<strong>of</strong> <strong>the</strong> winglet design iterations.<br />
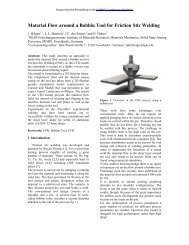
Figure 3. Isosurface plot <strong>of</strong> <strong>the</strong> pressure distribution<br />
(lb f /ft 2 ) around <strong>the</strong> fuselage.<br />
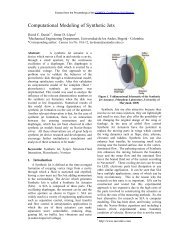
must be put into its shaping. A secondary<br />
objective is to keep <strong>the</strong> flow laminar over <strong>the</strong><br />
body <strong>of</strong> <strong>the</strong> plane for as long as possible and to<br />
prevent separation in areas with <strong>com</strong>plex<br />
boundary layer interaction; for example, at <strong>the</strong><br />
wing-fuselage junction. Figure 4 shows a closeup<br />
<strong>of</strong> such a junction flow study. According to<br />
[9], only 20% <strong>of</strong> <strong>the</strong> wingspan from <strong>the</strong> root<br />
need be included to obtain valid results.<br />
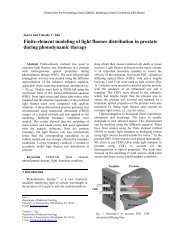
Figure 5. Typical <strong>COMSOL</strong> output for winglet study:<br />
isosurface pressure distribution (lb f /ft 2 ) and velocity<br />
streamlines.<br />
Figure 4. Fluid flow at <strong>the</strong> wing-fuselage junction,<br />
with surface pressure (lb f /ft 2 ) and velocity streamlines.<br />
The winglet design study has so far shown an<br />
overall drag reduction <strong>of</strong> 8.1% at cruise<br />
condition over <strong>the</strong> original wing design, with<br />
smaller reductions in o<strong>the</strong>r flight conditions,<br />
such as turning flight or landing approach.<br />
Superimposition <strong>of</strong> <strong>the</strong> ga<strong>the</strong>red data from<br />
<strong>COMSOL</strong> onto <strong>the</strong> UAV’s flight polars shows<br />
no performance penalties. Figure 5 outlines <strong>the</strong><br />
typically sought information from <strong>COMSOL</strong>,<br />
such as isosurface pressure plotting, velocity and<br />
Figure 6. Flow field <strong>com</strong>parison between original<br />
wing and winglet design (top and bottom). Depicted:<br />
boundary plots representing surface pressure<br />
(lb f /ft 2 ) and velocity streamlines.<br />
<strong>COMSOL</strong>’s boundary integration mode is<br />
especially powerful when coupled with <strong>the</strong> weak