Use of COMSOL In Aerodynamic Optimization of the ... - COMSOL.com
Use of COMSOL In Aerodynamic Optimization of the ... - COMSOL.com
Use of COMSOL In Aerodynamic Optimization of the ... - COMSOL.com

You also want an ePaper? Increase the reach of your titles
YUMPU automatically turns print PDFs into web optimized ePapers that Google loves.
constraint variables. The boundary integration<br />
mode itself allows us to quickly find changes in<br />
overall drag. The weak constraint variables <strong>of</strong>fer<br />
an easy way <strong>of</strong> <strong>com</strong>puting <strong>the</strong> coefficients <strong>of</strong><br />
drag and lift, if desired. This feature was used in<br />
numerous instances during <strong>the</strong> fluid flow<br />
analysis, both as a way to benchmark <strong>the</strong><br />
accuracy <strong>of</strong> <strong>the</strong> models against known values and<br />
<strong>the</strong> obtained results against predicted data using<br />
various panel methods.<br />
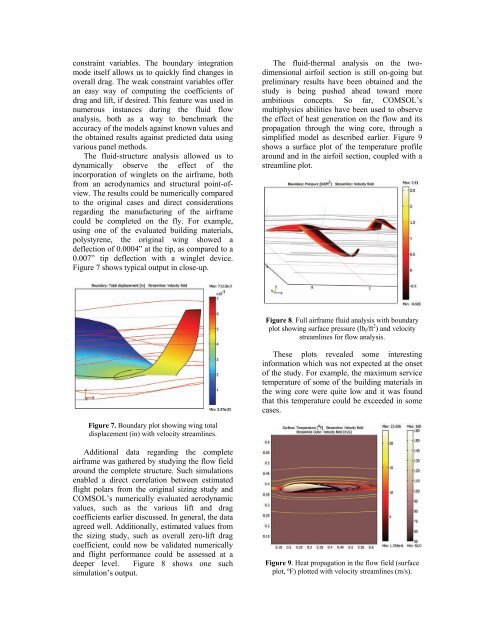
The fluid-structure analysis allowed us to<br />
dynamically observe <strong>the</strong> effect <strong>of</strong> <strong>the</strong><br />
incorporation <strong>of</strong> winglets on <strong>the</strong> airframe, both<br />
from an aerodynamics and structural point-<strong>of</strong>view.<br />
The results could be numerically <strong>com</strong>pared<br />
to <strong>the</strong> original cases and direct considerations<br />
regarding <strong>the</strong> manufacturing <strong>of</strong> <strong>the</strong> airframe<br />
could be <strong>com</strong>pleted on <strong>the</strong> fly. For example,<br />
using one <strong>of</strong> <strong>the</strong> evaluated building materials,<br />
polystyrene, <strong>the</strong> original wing showed a<br />
deflection <strong>of</strong> 0.0004” at <strong>the</strong> tip, as <strong>com</strong>pared to a<br />
0.007” tip deflection with a winglet device.<br />
Figure 7 shows typical output in close-up.<br />
The fluid-<strong>the</strong>rmal analysis on <strong>the</strong> twodimensional<br />
airfoil section is still on-going but<br />
preliminary results have been obtained and <strong>the</strong><br />
study is being pushed ahead toward more<br />
ambitious concepts. So far, <strong>COMSOL</strong>’s<br />
multiphysics abilities have been used to observe<br />
<strong>the</strong> effect <strong>of</strong> heat generation on <strong>the</strong> flow and its<br />
propagation through <strong>the</strong> wing core, through a<br />
simplified model as described earlier. Figure 9<br />
shows a surface plot <strong>of</strong> <strong>the</strong> temperature pr<strong>of</strong>ile<br />
around and in <strong>the</strong> airfoil section, coupled with a<br />
streamline plot.<br />
Figure 8. Full airframe fluid analysis with boundary<br />
plot showing surface pressure (lb f /ft 2 ) and velocity<br />
streamlines for flow analysis.<br />
These plots revealed some interesting<br />
information which was not expected at <strong>the</strong> onset<br />
<strong>of</strong> <strong>the</strong> study. For example, <strong>the</strong> maximum service<br />
temperature <strong>of</strong> some <strong>of</strong> <strong>the</strong> building materials in<br />
<strong>the</strong> wing core were quite low and it was found<br />
that this temperature could be exceeded in some<br />
cases.<br />
Figure 7. Boundary plot showing wing total<br />
displacement (in) with velocity streamlines.<br />
Additional data regarding <strong>the</strong> <strong>com</strong>plete<br />
airframe was ga<strong>the</strong>red by studying <strong>the</strong> flow field<br />
around <strong>the</strong> <strong>com</strong>plete structure. Such simulations<br />
enabled a direct correlation between estimated<br />
flight polars from <strong>the</strong> original sizing study and<br />
<strong>COMSOL</strong>’s numerically evaluated aerodynamic<br />
values, such as <strong>the</strong> various lift and drag<br />
coefficients earlier discussed. <strong>In</strong> general, <strong>the</strong> data<br />
agreed well. Additionally, estimated values from<br />
<strong>the</strong> sizing study, such as overall zero-lift drag<br />
coefficient, could now be validated numerically<br />
and flight performance could be assessed at a<br />
deeper level. Figure 8 shows one such<br />
simulation’s output.<br />
Figure 9. Heat propagation in <strong>the</strong> flow field (surface<br />
plot, ºF) plotted with velocity streamlines (m/s).