Kuwait Economic Brief - National Bank of Kuwait
Kuwait Economic Brief - National Bank of Kuwait
Kuwait Economic Brief - National Bank of Kuwait

Create successful ePaper yourself
Turn your PDF publications into a flip-book with our unique Google optimized e-Paper software.
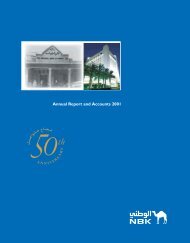
April 2012<br />
Real estate sales strong to start year...<br />
Credit jump in February...Government<br />
spending still lagging<br />
An update <strong>of</strong> recent developments<br />
in select sectors in <strong>Kuwait</strong><br />
published by <strong>Economic</strong> Research<br />
at NBK<br />
<strong>Kuwait</strong> <strong>Economic</strong> <strong>Brief</strong>
<strong>Economic</strong> <strong>Brief</strong> - April 2012<br />
Oil Market...............................................Page 2<br />
Crude prices stable as governments consider<br />
stock release<br />
Consumer Price Inflation......................Page 4<br />
February CPI inflation at 3.8% y/y<br />
Monetary Developments......................Page 5<br />
Credit sees significant gains in February…<br />
portends better credit growth than 2010 and<br />
2011<br />
Public Finance.......................................Page 6<br />
FY 11/12: High oil prices and sluggish spending<br />
to generate a record budget surplus<br />
<strong>Kuwait</strong> Population & Labor...................Page 7<br />
<strong>Kuwait</strong>i employment grows 6% in 2011, for both<br />
the public and private sectors<br />
<strong>Kuwait</strong>’s crude oil price and production<br />
2.75<br />
125<br />
2.65<br />
120<br />
mn barrels/day<br />
115<br />
2.55<br />
110<br />
2.45<br />
105<br />
2.35<br />
100<br />
2.25<br />
95<br />
Mar-11 Jun-11 Sep-11 Dec-11 Mar-12<br />
Oil Output (left)<br />
Oil Price (right)<br />
monetary indicators<br />
(y/y percent growth)<br />
15<br />
10<br />
dollars per barrel<br />
Real Estate.............................................Page 9<br />
Solid sales activity in February despite holiday,<br />
driven by the residential sector<br />
5<br />
0<br />
Corporate Earnings.............................Page 11<br />
Corporate Earnings down slightly on the year,<br />
challenges remain<br />
-5<br />
Feb-11 May-11 Aug-11 Nov-11 Feb-12<br />
Money Supply (M2)<br />
Credit Facilities<br />
<strong>Kuwait</strong> Stock Exchange......................Page 15<br />
KSE rally continues in March<br />
share <strong>of</strong> real estate segments<br />
100%<br />
100%<br />
80%<br />
80%<br />
60%<br />
60%<br />
40%<br />
40%<br />
20%<br />
20%<br />
0%<br />
0%<br />
Feb.11 Apr.11 Jun.11 Aug.11 Oct.11 Dec.11 Feb.12<br />
Commercial Residential Property Apartments (Investment)<br />
KUWAIT STOCK EXCHANGE<br />
50<br />
7000<br />
40<br />
6500<br />
million KD<br />
30<br />
20<br />
6000<br />
index<br />
10<br />
5500<br />
0<br />
Mar-11 Jun-11 Sep-11 Dec-11 Mar-12<br />
5000<br />
Value <strong>of</strong> Traded Shares (left)<br />
KSE Index (right)<br />
1
<strong>Economic</strong> <strong>Brief</strong> - April 2012<br />
Oil Market & Budget Developments<br />
Crude prices stable as governments consider stock<br />
release<br />
• Crude prices were stable through March, with concerns<br />
over the potential loss <strong>of</strong> Iranian crude mitigated by<br />
speculation over a possible release <strong>of</strong> international oil<br />
stocks.<br />
• Global oil demand should grow at a moderate pace this<br />
year, affected by high prices. Oil supply growth should be<br />
stronger, thanks partly to rising output in Iraq and Libya.<br />
• An average oil price <strong>of</strong> $110 pb should have generated<br />
a budget surplus <strong>of</strong> KD 11 bn for <strong>Kuwait</strong> in FY11/12. If<br />
oil prices remain high, FY12/13 should see a further large<br />
surplus.<br />
Oil Prices<br />
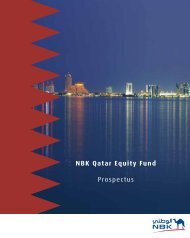
Oil prices had a steady month in March, holding on to<br />
the gains made in February which saw them reach postfinancial<br />
crisis highs. The price <strong>of</strong> <strong>Kuwait</strong> Export Crude<br />
(KEC) began and ended the month at $120 per barrel (pb).<br />
The average price during the month was also $120, the<br />
highest since July 2008. Brent crude, meanwhile, enjoyed<br />
a similarly stable month, holding at around $125. The main<br />
US crude benchmark – West Texas Intermediate (WTI)<br />
– continues to trade at a substantial discount to other<br />
blends, averaging $106 in March.<br />
Two opposing supply-side factors have vied for influence<br />
over oil prices in recent weeks. On the upside, markets<br />
remain pressured by the potential loss <strong>of</strong> Iranian oil<br />
exports as the July 1st start date for EU embargo on Iran<br />
oil draws nearer. Estimates suggest that Iran could lose up<br />
to 1 million barrels per day (mbpd) <strong>of</strong> crude, worth around<br />
1% <strong>of</strong> world output, which would need to be made up by<br />
other producers. Iranian production is estimated to have<br />
already fallen to a 10-year low <strong>of</strong> 3.4 mbpd this year, as<br />
buyers look to pre-empt supply chain disruption.<br />
On the downside, speculation has intensified over a<br />
possible release <strong>of</strong> government-controlled strategic oil<br />
stocks to cap further upward pressure on prices. Aside<br />
from questions over the legality and timing <strong>of</strong> the move,<br />
few analysts expect it would have a lasting impact. Last<br />
summer’s release <strong>of</strong> 60 million barrels over 2 months<br />
saw prices drop 5% on the announcement, but quickly<br />
recover. This may <strong>of</strong> course lead to speculation that any<br />
release will need to be bigger this time around.<br />
These two forces are linked and may be <strong>of</strong>fsetting: rising<br />
concerns about supply shortages only generate a stronger<br />
likelihood <strong>of</strong> an emergency supply release. Note, however,<br />
that futures markets see the price <strong>of</strong> Brent crude falling to<br />
below $100 pb by the end <strong>of</strong> 2015. The premium for spot<br />
over futures prices can be partly interpreted as a measure<br />
<strong>of</strong> current nervousness over the Iranian issue.<br />
Oil demand outlook<br />
Analysts’ Analysts’ expectations for oil demand growth in<br />
2012 were little changed over the past month, the global<br />
economic environment having calmed down somewhat.<br />
Global oil demand growth is seen in the range <strong>of</strong> 0.8–1.1<br />
mbpd, or 0.9–1.2%, similar to 2011 levels. Demand<br />
growth in non-OECD countries is expected to remain<br />
robust, at up to 1.5 mbpd (3.5%), while demand in<br />
OECD countries may fall by up to 0.4 mbpd (0.7%). If<br />
these trends continue, non-OECD countries will overtake<br />
developed markets as the primary users <strong>of</strong> oil for the first<br />
time next year. They have already contributed all <strong>of</strong> the<br />
increase in world oil demand seen over the past decade.<br />
Oil supply outlook<br />
Crude oil output <strong>of</strong> the OPEC-11 (i.e. excluding Iraq) rose<br />
by a marked 121,000 bpd in February to 28.3 mbpd.<br />
Declines were seen in <strong>Kuwait</strong> (43,000 bpd), Saudi Arabia<br />
(41,000 bpd) and Iran (37,000 bpd). However, these were<br />
more than <strong>of</strong>fset by a continued recovery in Libyan output<br />
which jumped by 181,000 bpd to 1.2 mbpd, closing in on<br />
its 1.6 mbpd pre-war level.<br />
Total OPEC production (including Iraq) reached 31 mbpd<br />
in February, a level not witnessed since October 2008.<br />
Recent cuts in Saudi production do not reflect a desire for<br />
a tighter market. Indeed, Saudi oil minister Al-Naimi has<br />
made a concerted effort to talk prices down, publically<br />
emphasizing that markets are well supplied, that domestic<br />
production could be lifted to its maximum <strong>of</strong> 12.5 mbpd<br />
kuwait export crude<br />
(dollars per barrel)<br />
140<br />
130<br />
120<br />
110<br />
100<br />
90<br />
80<br />
4Q11 1Q12 2Q12F 3Q12F 4Q12F 1Q13F<br />
KEC PRICE SCENARIOS<br />
(dollars per barrel)<br />
Scenario<br />
Low Price Base Case High Price<br />
2011 105.4 105.4 105.4<br />
1Q12 116.7 116.7 116.7<br />
FY11/12 109.7 109.7 109.7<br />
2Q12f 116.3 119.7 125.3<br />
3Q12f 105.8 115.7 130.2<br />
4Q12f 89.9 109.5 136.8<br />
2012f 104.9 112.1 122.8<br />
1Q13f 89.9 109.5 136.8<br />
FY12/13f 100.5 113.6 132.3
if needed and that the kingdom stands ready to meet any<br />
supply shortfall arising from the loss <strong>of</strong> Iranian supplies.<br />
Along with a further recovery in Libyan output, Iraq’s<br />
production could rise in future with the start-up <strong>of</strong> the new<br />
export facility at Basra.<br />
Non-OPEC supplies are projected to rise by 0.5-0.8 mbpd<br />
in 2012, although more than half <strong>of</strong> this increase will come<br />
from OPEC natural gas liquids (NGLs). This is only slightly<br />
above last year’s disappointing growth <strong>of</strong> 0.5 mbpd,<br />
which was held back by a combination <strong>of</strong> geopolitical<br />
and technical issues. In total, if OPEC-12 output were to<br />
remain at its current level (i.e. assuming that any future<br />
loss in Iranian output is compensated for by other OPEC<br />
members); global oil supplies could rise by up to 2.0<br />
mbpd in 2012. Given higher Libyan and Iraqi production,<br />
however, OPEC output should rise further.<br />
Price projections<br />
Oil supply increases are therefore expected to outpace<br />
demand growth this year, and – despite a tight starting<br />
point – it is conceivable that market fundamentals will<br />
s<strong>of</strong>ten. If non-OPEC supply growth comes in at the lower<br />
end <strong>of</strong> expectations at 0.5 mbpd, and OPEC output<br />
increases on average by 1.6 mbpd in 2012, then – based<br />
upon a consensus-looking increase in demand (0.9%)<br />
– we could see a relatively large stock-build <strong>of</strong> 0.7 mbpd<br />
this year, following last year’s stock draw. In this case, the<br />
price <strong>of</strong> KEC could fall steadily in the second half <strong>of</strong> the<br />
year, though remain high at around $110 pb at year-end.<br />
build-up <strong>of</strong> global stocks. Such a scenario could result<br />
from the return <strong>of</strong> South Sudanese output, following<br />
a production shutdown linked to a dispute with North<br />
Sudan. The price <strong>of</strong> KEC could slide to under $90 pb in<br />
the final quarter <strong>of</strong> 2012, likely prompting OPEC members<br />
to make deep significant cuts.<br />
Budget projections<br />
The fiscal year 11/12 just ended saw the price <strong>of</strong> KEC<br />
average $110 pb, up 33% on FY10/11. Although <strong>of</strong>ficial<br />
figures have not yet been released, we expect oil revenues<br />
<strong>of</strong> some KD 28 billion, 45% up on the previous year. If<br />
as we expect, spending comes in at 5-10% below the<br />
government’s forecast, last year’s budget surplus could<br />
end up between KD 11.3 billion and KD 12.3 billion before<br />
allocations to the Reserve Fund for Future Generations<br />
(RFFG). This is lower than the KD 16.1 billion surplus<br />
revealed by <strong>of</strong>ficial figures for the first eleven months <strong>of</strong> the<br />
year, but the surplus usually declines once late spending<br />
data are included.<br />
The outlook for next year is still unclear, but our projections<br />
are based upon oil prices averaging between $101 and<br />
$132 pb. Press reports show budgeted spending for<br />
FY12/13 <strong>of</strong> KD 22 billion, although this number could<br />
subsequently be revised. Using our price scenarios, we<br />
project a surplus <strong>of</strong> between KD 6.5 billion and KD 17.6<br />
billion before allocations to the RFFG.<br />
Alternatively, if oil demand growth proves much stronger<br />
than anticipated (1.3%), oil market fundamentals could<br />
begin to tighten again and prices are likely to rise. In this<br />
scenario, the price <strong>of</strong> KEC accelerates to above $135 pb<br />
by year-end. However, such high prices would hurt global<br />
economic growth, pressing OPEC members to supply<br />
more oil to the market.<br />
If, on the other hand, non-OPEC supplies turn out to be<br />
0.3 mbpd higher than expected, we could see a rapid<br />
BUDGET FORECAST<br />
(million KD, unless otherwise noted)<br />
Under Alternative Oil Price Scenarios<br />
FY 2011/12 FY 2012/13<br />
Official Low Base High Prelim. Low Base High<br />
Budget Case Case Case Budget Case Case Case<br />
Oil Price ($/barrel) 60.0 109.7 109.7 109.7 65.0 100.5 113.6 132.3<br />
Total Revenues 13,445 29,740 29,740 29,841 13,932 27,408 30,988 37,352<br />
Oil Revenues 12,307 28,140 28,140 28,241 12,768 25,808 29,388 35,752<br />
Non-Oil Revenues 1,138 1,600 1,600 1,600 1,164 1,600 1,600 1,600<br />
Expenditures (<strong>of</strong>ficial) 19,435 19,435 19,435 19,435 21,960 21,960 21,960 21,960<br />
Surplus (deficit) -5,990 10,305 10,305 10,406 -8,028 5,448 9,028 15,392<br />
After RFFG -7,335 7,331 7,331 7,422 -9,421 2,707 5,929 11,657<br />
Expenditures (NBK estimate) ... 18,463 17,977 17,492 ... 20,862 20,313 19,764<br />
Surplus (deficit), NBK estimate ... 11,277 11,763 12,349 ... 6,546 10,675 17,588<br />
After RFFG ... 8,303 8,789 9,365 ... 3,805 7,576 13,853
<strong>Economic</strong> <strong>Brief</strong> - April 2012<br />
Consumer Price Inflation (CPI)<br />
February CPI inflation at 3.8% y/y<br />
Inflation in the Consumer Price Index (CPI) rose to 3.8%<br />
year-on-year (y/y) in February from 3.5% the previous<br />
month. The small rise in the rate was driven in February<br />
by the clothing and education segments, in what appear<br />
to be special or one-time factors (see below). Despite the<br />
small rise, there is little sign <strong>of</strong> a significant rise in broader<br />
inflationary pressures and we expect inflation to average<br />
4.0% in 2012.<br />
Our ‘core’ CPI measure, which excludes food and<br />
beverage prices, stood at just 2.5% y/y in February<br />
(chart 1). A combination <strong>of</strong> moderate rates <strong>of</strong> economic<br />
growth and the lagged effects <strong>of</strong> a stronger US dollar<br />
(which affects import prices) have helped to keep inflation<br />
pressures in check.<br />
Food prices were little changed on the month (some<br />
subcomponents saw m/m declines), though inflation in<br />
food prices edged up to 8.6% y/y in February (chart 2).<br />
International food prices have come down from their 2011<br />
highs, which should translate into a deceleration in <strong>Kuwait</strong>i<br />
food price inflation over coming months.<br />
Footwear prices jumped 3.2% in the month, and pressured<br />
inflation in the clothing and footwear segment which<br />
accelerated to 4.9% y/y (footwear makes up make up 16%<br />
<strong>of</strong> this component). Prices in the education and medical<br />
care segment jumped 2.1% on the month, primarily driven<br />
by an 18% jump in tuition at English schools. The latter is<br />
Consumer price inflation, % y/y<br />
unusual and is likely due to a one-time factor or to some<br />
oddity in the data for that item.<br />
Inflation in the household goods and services segment<br />
slowed to 1.4% y/y (chart 3), the lowest among all index<br />
components. Another source <strong>of</strong> downward pressure was<br />
transportation and communication, which nudged down<br />
to 2.6% y/y in February.<br />
Overall, CPI inflation appears in check, with prices in the<br />
categories other than food and clothing all running at<br />
under 3.0% y/y.<br />
CONSUMER PRICE INFLATION - MONTHLY 2011<br />
Index<br />
weight<br />
% m/m % y/y<br />
% Dec Jan Feb Dec Jan Feb<br />
Food 18.3 1.1 0.4 0.1 6.7 8.1 8.6<br />
Beverages and tobacco 0.7 0.0 0.0 0.1 0.4 3.6 7.2<br />
Clothing and footwear 8.9 0.1 -0.1 1.4 2.1 3.2 4.9<br />
Housing services 26.8 0.8 0.0 0.0 2.0 2.0 2.0<br />
Household goods & services 14.7 0.2 0.1 -0.4 1.9 1.8 1.4<br />
Transport & Communication 16.1 0.1 0.1 0.0 2.9 2.7 2.6<br />
Education & medical care 4.7 -1.8 0.1 2.1 0.8 0.9 2.8<br />
Other goods and services 9.9 0.3 0.1 0.1 2.6 2.8 2.8<br />
Core Index 1 81.0 0.3 0.0 0.2 2.1 2.2 2.5<br />
General Index 100.0 0.5 0.1 0.2 3.1 3.5 3.8<br />
Source: CSO/NBK<br />
1<br />
excludes food, beverages and tobacco<br />
Household goods & serv. apparel inflation, %y/y<br />
7<br />
7<br />
7<br />
7<br />
6<br />
6<br />
6<br />
6<br />
5<br />
5<br />
5<br />
5<br />
4<br />
4<br />
4<br />
4<br />
3<br />
3<br />
3<br />
3<br />
2<br />
2<br />
2<br />
2<br />
1<br />
1<br />
1<br />
1<br />
0<br />
0<br />
May-10 Aug-10 Nov-10 Feb-11 May-11 Aug-11 Nov-11 Feb-12<br />
CPI<br />
CPI Core (excl Food and Bev)<br />
0<br />
0<br />
May-10 Aug-10 Nov-10 Feb-11 May-11 Aug-11 Nov-11 Feb-12<br />
CPI clothing & footwear<br />
CPI household goods & Serv.<br />
food & Housing inflation, % y/y<br />
cpi components, %y/y<br />
14<br />
14<br />
10<br />
10<br />
12<br />
12<br />
8<br />
8<br />
10<br />
10<br />
8<br />
8<br />
6<br />
6<br />
6<br />
6<br />
4<br />
4<br />
4<br />
4<br />
2<br />
2<br />
2<br />
2<br />
0<br />
May-10 Aug-10 Nov-10 Feb-11 May-11 Aug-11 Nov-11 Feb-12<br />
CPI Food<br />
CPI Housing<br />
0<br />
0<br />
Food Bev & Clothing H'sing<br />
Tob<br />
serv<br />
Feb 2012<br />
CPI<br />
Q4 2011 Avg<br />
H'hold<br />
G&S<br />
Tran &<br />
com<br />
Edu &<br />
Med<br />
Other<br />
G&S<br />
Source: Ministry <strong>of</strong> Planning / NBK<br />
0
Monetary Developments<br />
Credit sees significant gains in February…portends<br />
better credit growth than 2010 and 2011<br />
Total credit was up KD 242 mn in February, its strongest<br />
monthly gain since September 2009. While household<br />
credit continued to show steady growth, February saw<br />
some good activity in other sectors as well.<br />
Money supply (M1) was up in February (+KD 152 mn).<br />
The broader measure <strong>of</strong> money (M2) was up a stronger<br />
KD 286 mn. Despite the large monthly gain in money<br />
supply, year-on-year (y/y) growth in M1 and M2 slowed in<br />
February to 6.7% and 4.7%, respectively, due to a strong<br />
jump in money in the same period last year. Money supply<br />
had expanded KD 1.6 billion in February 2011 following<br />
the payment <strong>of</strong> the Amiri grant.<br />
million. The sector is up 3% y/y in what seems to reflect<br />
improved real estate activity in <strong>Kuwait</strong>.<br />
Resident deposits were up a strong KD 283 million mostly<br />
in local currency deposits. The increases were exclusively<br />
in sight and saving deposits. Average rates <strong>of</strong>fered on<br />
private KD deposits remained unchanged across all<br />
maturities in February. Rates on maturities <strong>of</strong> one, three,<br />
six and 12 months averaged 0.81%, 1.04%, 1.30%, and<br />
1.54%, respectively.<br />
Total bank assets were up a hefty KD 620 million in<br />
February. Apart from the increase in credit facilities,<br />
banks’ liquid and foreign assets increased noticeably in<br />
February.<br />
The remarkable increase in credit came despite the KD<br />
40 million decline in loans extended to non- bank financial<br />
institutions. Almost all other sectors saw good gains in<br />
February. Personal facilities (ex-securities) were up another<br />
KD 42 million. The sector’s monthly gains averaged KD 60<br />
million in the last 3 months.<br />
February’s gains were led mostly by increases in “other<br />
business credit” (services, telecom, transportation etc.)<br />
and personal facilities extended for the purchase <strong>of</strong><br />
securities, each rising by KD 93 million. Meanwhile,<br />
outstanding loans to real estate were up a good KD 41<br />
monetary indicators<br />
(year-on-year percent growth)<br />
12<br />
10<br />
8<br />
6<br />
4<br />
2<br />
0<br />
-2<br />
Feb-10 Jun-10 Oct-10 Feb-11 Jun-11 Oct-11 Feb-12<br />
Money Supply (M2)<br />
Credit Facilities<br />
KD Resident Deposits<br />
MONETARY HIGHLIGHTS - FEBRUARY 2012<br />
Change<br />
Feb 2012 mom 3-mnth yoy<br />
mn KD % % %<br />
exchange rates<br />
0.32<br />
0.31<br />
0.45<br />
0.43<br />
Local <strong>Bank</strong> Assets 44,608 1.4 2.6 4.8<br />
<strong>of</strong> which:<br />
Claims on Government 1,901 0.0 0.9 1.2<br />
Credit to Residents 25,838 0.9 1.0 2.4<br />
Foreign Assets 8,363 1.6 6.8 14.0<br />
Money Supply (M2) 28,143 1.0 1.3 4.3<br />
Private Deposits 27,144 1.1 1.4 4.7<br />
KD Sight Deposits 5,837 2.6 6.8 9.2<br />
KD Savings Deposits 3,994 2.9 5.4 17.1<br />
KD Time Deposits & CDs 15,061 -0.1 -0.6 1.0<br />
FC Deposits 2,252 1.7 -5.0 0.2<br />
0.30<br />
0.41<br />
0.29<br />
0.39<br />
0.28<br />
0.37<br />
0.27<br />
0.35<br />
0.26<br />
0.33<br />
Mar-10 Jun-10 Sep-10 Jan-11 Apr-11 Aug-11 Nov-11 Mar-12<br />
Dinar/Dollar (LHS)<br />
Dinar/Euro (RHS)
<strong>Economic</strong> <strong>Brief</strong> - April 2012<br />
Public Finance<br />
FY 11/12: High oil prices and sluggish spending to<br />
generate a record budget surplus<br />
<strong>Kuwait</strong>’s public finances data for February, the 11th month<br />
<strong>of</strong> fiscal year 2011/12, show a year-on-year (y/y) decline<br />
in government spending. This is largely due to last year’s<br />
one-time Amiri grant, which was disbursed in February<br />
2011. Government revenues, however, continue to grow<br />
strongly due to high oil prices. This will likely result in a<br />
record budget surplus for the year, which would be the<br />
country’s 13th surplus in a row.<br />
Total government spending reached KD 10.8 billion in<br />
the first 11 months, a small 1% decline compared to the<br />
same period <strong>of</strong> the previous year. Admittedly, this was<br />
skewed by the impact <strong>of</strong> the Amiri grant –without which<br />
spending would have increased 10% y/y. Nevertheless,<br />
the underlying spending pace is still disappointing. For<br />
the 11 months period <strong>of</strong> FY 2011/12, 56% <strong>of</strong> budget had<br />
been spent, compared to 64% for the historic average in<br />
the comparable period.<br />
Current spending was almost unchanged y/y, standing<br />
at KD 9.7 billion. A KD 449 million increase in wages<br />
and salaries spending was <strong>of</strong>fset by a decrease in<br />
miscellaneous expenditures and transfers. The decrease<br />
in the latter was due to the Amiri grant mentioned above.<br />
Current spending was 59% <strong>of</strong> the full year budget, also<br />
below its historic average <strong>of</strong> 68% (for the 11-month<br />
period).<br />
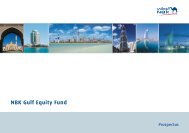
Capital spending was down 14% y/y, reaching KD 1 billion,<br />
11 months in. Spending in this category is still lagging at<br />
38% <strong>of</strong> budget, compared to a 43% historic average (chart<br />
1). The capital-spending pace was projected to pickup, as<br />
this is the second year <strong>of</strong> the development plan and more<br />
projects should have materialized. The expected increase<br />
may still be realized, but not until the closing figures for the<br />
fiscal year are released.<br />
Demand-impacting spending* – our estimate <strong>of</strong> spending<br />
that drives domestic demand – stood at KD 6.6 billion<br />
through the first 11 months, down 9% y/y due to the same<br />
above-mentioned “basis effect”.<br />
Total revenues were KD 26.8 billion, up 44% y/y. High<br />
oil prices have buoyed revenues for FY 2011/12 as the<br />
average oil price for the 11-month period was almost<br />
$109 pb, up 36% y/y. Oil revenues accounted for 95% <strong>of</strong><br />
total revenues 11 months into the fiscal year.<br />
Non-oil revenues reached KD 1.4 billion, up 20% y/y. The<br />
increase originated from miscellaneous revenues and fees,<br />
which is likely related to compensation payments from the<br />
United Nations Compensation Commission (UNCC).<br />
Capital Spending<br />
(actual spending % <strong>of</strong> full year budget)<br />
70<br />
60<br />
50<br />
40<br />
30<br />
20<br />
10<br />
0<br />
Apr May June July Aug Sept Oct Nov Dec Jan Feb Mar<br />
5 year historical average<br />
FY 11/12 FY 10/11<br />
70<br />
60<br />
50<br />
40<br />
30<br />
20<br />
10<br />
0<br />
11 months into FY 2011/12, <strong>Kuwait</strong>’s budget surplus<br />
stood at KD 16 billion (36% <strong>of</strong> 2011 GDP). We maintain<br />
our view that the final figure is likely to be smaller, as<br />
spending typically accelerates late in the year. We forecast<br />
a KD 11-12 billion surplus for FY2011/12 (chart 3), which<br />
would still be 22% <strong>of</strong> GDP.<br />
Note: * Excludes items such as transfers to Public Institute<br />
for Social Security, transfers abroad, spending on military<br />
procurement, fuel costs and subsidies, and housing loan<br />
forgiveness.<br />
REVENUES & EXPENDITURES - 11 MONTHS (TO FEBRUARY) FY2011/12<br />
11 mos: Actual to<br />
Levels Change 1 Y/Y Budget (%)<br />
mn KD mn KD % FY11/12 Average 2<br />
Total Revenues 26,893 8,225 44.1 200.0 184.7<br />
Oil Revenues 25,478 7,999 45.8 207.0 195.2<br />
Non-Oil Revenues 1,414 226 19.0 124.3 102.3<br />
Total Expenditures 10,823 -149 -1.4 55.7 63.9<br />
Current Expenditures 9,748 26 0.3 58.7 67.5<br />
Wages & Salaries 2,509 449 21.8 56.7 58.2<br />
Goods & Services 1,757 125 7.6 57.9 60.9<br />
Misc. Exp. & Transfers 5,482 -548 -9.1 59.9 73.4<br />
Capital Expenditures 1,075 -175 -14.0 38.2 43.1<br />
Vehicles & equipment 69 -8 -10.0 18.0 28.3<br />
Projects, maint. & land purchases 1,006 -167 -14.3 41.4 45.2<br />
Surplus (deficit) 16,070 8,347 ... ... ...<br />
Demand Impacting Expenditures 6,609 -636 -8.8 50.2 58.6<br />
1<br />
Change from comparable period year ago<br />
2<br />
Average for comparable period, last 5 years
<strong>Kuwait</strong> Population & Labor Force<br />
<strong>Kuwait</strong>i employment grows 6% in 2011, for both the<br />
public and private sectors<br />
<strong>Kuwait</strong>’s total population reached 3.69 million at the end<br />
<strong>of</strong> December 2011 according to figures published by the<br />
Public Authority for Civil Information (PACI). The population<br />
grew by 3.2% from a year ago. The number <strong>of</strong> <strong>Kuwait</strong>i<br />
nationals reached nearly 1.18 million, or 32% <strong>of</strong> the total<br />
population. Growth was slightly higher than in recent<br />
years, as the population grew at an annual average <strong>of</strong><br />
2.9% in the previous five years. The expatriate population<br />
represented 68% <strong>of</strong> <strong>Kuwait</strong>’s population at the end <strong>of</strong><br />
2011. Their numbers increased by roughly 80 thousand<br />
(3.3%) over the previous year, in part reflecting a pick up<br />
in economic activity. Growth in the expatriate population<br />
peaked four years ago at 8.6% before dropping to around<br />
0.5% during 2008 and 2009. It has since recovered to a<br />
more moderate pace.<br />
<strong>Kuwait</strong>’s total labor force grew by 3.2% in 2011 to reach<br />
2.18 million. Growth among <strong>Kuwait</strong>i nationals was strong,<br />
exceeding 6% year-on-year. For expatriates, the numbers<br />
were up in both the public and private sectors, though<br />
they fell for domestic workers. Growth for expat workers<br />
was slower at 3.4%.<br />
The number <strong>of</strong> employed <strong>Kuwait</strong>is at the end <strong>of</strong> 2011<br />
rose by over 21,500, better than the 16,200 gain in the<br />
previous year. Seventeen thousand <strong>of</strong> the new jobs were<br />
in the public sector, roughly twice the increase in public<br />
sector employment <strong>of</strong> <strong>Kuwait</strong>is a year ago.<br />
Of the new jobs for <strong>Kuwait</strong>is, 21% were in the private<br />
sector, keeping the public/private shares little changed<br />
from previous years. New employment in the private<br />
sector among <strong>Kuwait</strong>i nationals in 2011 was 4,400. About<br />
half <strong>of</strong> the new jobs in this sector went to women. The<br />
number <strong>of</strong> <strong>Kuwait</strong>is employed in the private sector rose<br />
to 80 thousand.<br />
For <strong>Kuwait</strong>is employed in the public sector, growth<br />
accelerated during 2011 as the government created the<br />
most jobs in more than a decade. The public sector added<br />
more than 17 thousand jobs for nationals in 2011. In fact,<br />
the number <strong>of</strong> <strong>Kuwait</strong>is entrants to the public sector nearly<br />
doubled compared to 2010. There were over 17,000 new<br />
public sector employees compared to 8,800 during the<br />
same period a year before; that figure was the highest<br />
ever. The strong employment performance for <strong>Kuwait</strong>is in<br />
the public sector was likely encouraged by the approval<br />
<strong>of</strong> salary hikes in the government sector that are perhaps<br />
luring some workers from the private sector. The public<br />
sector added 5,500 expatriate jobs, somewhat stronger<br />
than the previous two years.<br />
Since 2000, the share <strong>of</strong> women <strong>of</strong> the <strong>Kuwait</strong>i work<br />
force has steadily increased, from 35% to nearly 46%.<br />
These gains are in part linked to women’s educational<br />
achievements. As much as 61% <strong>of</strong> women aged 25<br />
and older have received a diploma or a higher degree,<br />
compared with 39% <strong>of</strong> men.<br />
Growth in <strong>Kuwait</strong>’s population, %<br />
kuwaiti women’s share in public & Private sector<br />
10<br />
6<br />
60<br />
60<br />
8<br />
5<br />
50<br />
50<br />
40<br />
40<br />
6<br />
4<br />
30<br />
30<br />
4<br />
3<br />
20<br />
20<br />
2<br />
2<br />
10<br />
10<br />
0<br />
0<br />
0<br />
2007 2008 2009 2010 2011<br />
1<br />
Dec-<br />
00<br />
Dec-<br />
01<br />
Dec-<br />
02<br />
Dec-<br />
03<br />
Dec-<br />
04<br />
Dec-<br />
05<br />
Dec-<br />
06<br />
Dec-<br />
07<br />
Dec-<br />
08<br />
Dec-<br />
09<br />
Dec-<br />
10<br />
Dec-<br />
11<br />
<strong>Kuwait</strong>is (RHS) Total (LHS) Non-<strong>Kuwait</strong>is (LHS)<br />
Public Sector Private Sector<br />
POPULATION<br />
Shares <strong>of</strong> <strong>Kuwait</strong>i labor force<br />
Population (‘000)<br />
Percent Growth<br />
80<br />
50<br />
<strong>Kuwait</strong>i<br />
Non-<br />
<strong>Kuwait</strong>i<br />
Total<br />
<strong>Kuwait</strong>i<br />
Non-<br />
<strong>Kuwait</strong>i<br />
Total<br />
70<br />
45<br />
60<br />
40<br />
2006 1,023 2,159.6 3,183.0 3.1 8.0 6.4<br />
2007 1,055 2,345.0 3,399.6 3.1 8.6 6.8<br />
50<br />
35<br />
2008 1,088 2,354.3 3,441.8 3.1 0.4 1.2<br />
40<br />
30<br />
2009 1,119 2,366.0 3,484.9 2.9 0.5 1.3<br />
2010 1,148 2,433.7 3,582.1 2.6 2.9 2.8<br />
30<br />
25<br />
2011 1,183 2,514.1 3,697.3 3.0 3.3 3.2<br />
Source: Public Authority for Civil Information (www.paci.gov.kw).<br />
20<br />
Dec-<br />
00<br />
Dec-<br />
01<br />
Dec-<br />
02<br />
Dec-<br />
03<br />
Dec-<br />
04<br />
Dec-<br />
05<br />
Dec-<br />
06<br />
Dec-<br />
07<br />
Dec-<br />
08<br />
Dec-<br />
09<br />
Dec-<br />
10<br />
Dec-<br />
11<br />
20<br />
Men Women
<strong>Economic</strong> <strong>Brief</strong> - April 2012<br />
In the public sector, the proportion <strong>of</strong> <strong>Kuwait</strong>i women has<br />
risen from 41% in 2005 to 45% at the end <strong>of</strong> December<br />
2011. While the gain in this sector has been gradual,<br />
the private sector has seen a far more dramatic shift<br />
in women’s participation. The proportion <strong>of</strong> women<br />
employees in the private sector has risen from 39% to<br />
51% over the last five years.<br />
The net change in the expatriate labor force (excluding<br />
domestic workers) reached 48,700 at the end <strong>of</strong> 2011.<br />
Public sector hiring <strong>of</strong> non-<strong>Kuwait</strong>is was a relatively small<br />
5,400 while the private sector hired 43,200.<br />
<strong>Kuwait</strong>i empt., public & pvt. as share <strong>of</strong> total, %<br />
100<br />
35<br />
90<br />
30<br />
80<br />
25<br />
70<br />
20<br />
60<br />
50<br />
15<br />
40<br />
10<br />
30<br />
5<br />
Dec-<br />
02<br />
Dec-<br />
03<br />
Dec-<br />
04<br />
Dec-<br />
05<br />
Dec-<br />
06<br />
Dec-<br />
07<br />
Dec-<br />
08<br />
Dec-<br />
09<br />
Dec-<br />
10<br />
Dec-<br />
11<br />
Public Sector (LHS) Private Sector (RHS)<br />
LABOR FORCE BY SECTOR<br />
(in thousands)<br />
<strong>Kuwait</strong>i Non-<strong>Kuwait</strong>i<br />
Public<br />
Sector<br />
Private<br />
Sector<br />
Total<br />
Public<br />
Sector<br />
Private<br />
Sector<br />
Domestic<br />
Sector<br />
Total<br />
2005 276.1 31.9 308.0 93.4 911.4 478.7 1,483.4<br />
2006 285.3 42.3 327.5 96.9 1,010.5 501.0 1,608.4<br />
2007 255.3 49.1 304.4 103.7 1,104.5 544.3 1,752.5<br />
2008 262.7 57.0 319.7 111.8 1,120.6 501.1 1,733.5<br />
2009 270.6 68.2 338.8 114.8 1,086.0 519.3 1,720.1<br />
2010 279.4 75.6 355.0 118.9 1,070.0 569.5 1,758.5<br />
2011 296.5 80.1 376.6 124.4 1,113.3 566.9 1,804.6<br />
Source: Public Authority for Civil Information (www.paci.gov.kw).
Real Estate<br />
Solid sales activity in February despite holiday, driven<br />
by the residential sector<br />
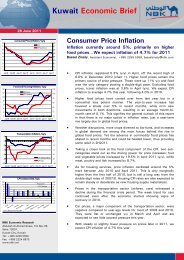
Sales activity was strong in February, totaling KD 255<br />
million in value, an 18% increase year-on-year (y/y). The<br />
residential sector sales continue to be the main driving<br />
force, taking up 58% <strong>of</strong> total transactions value.<br />
Residential sector sales were KD 147.3 million for February,<br />
a KD 56 million y/y jump. In line with January, the reason<br />
behind the increase was the high number <strong>of</strong> transactions<br />
concluded, totaling 722 transactions in February. In terms<br />
<strong>of</strong> value, almost two thirds <strong>of</strong> the transactions went<br />
into buying plots <strong>of</strong> land, with the remaining third going<br />
into purchasing homes. Ahmadi and Mubarak Alkabeer<br />
governorates saw the most activity in plot purchases<br />
(43% and 29% <strong>of</strong> total plot sales respectively). Residential<br />
sales should continue to do well in the near future, as they<br />
appear backed by solid demand.<br />
The investment sector (mainly apartments and buildings<br />
intended for rental), saw KD 97.4 million in sales during<br />
February. Sales for the month were mostly split between<br />
purchasing buildings, plots, and complexes (46, 31, and<br />
19% <strong>of</strong> total sales respectively). Buildings were mostly<br />
purchased in the Hawalli governorate, while Ahmadi and<br />
Mubarak Alkabeer governorates saw the bulk <strong>of</strong> activity<br />
in plot and complex purchases. Total sales for February<br />
were actually a 21% drop y/y, but still strong compared to<br />
a monthly average <strong>of</strong> KD 58 million (past 3 years). Thus<br />
the drop should not be an indication <strong>of</strong> a larger trend, as<br />
February saw fewer available days for transacting (national<br />
holiday).<br />
The commercial sector recorded 5 transactions in February.<br />
They totaled KD 10.4 million in value, an increase <strong>of</strong> KD<br />
7.2 million from last February. Month-to-month volatility in<br />
both monetary value and the number <strong>of</strong> transactions is<br />
common in this sector.<br />
The Savings and Credit <strong>Bank</strong> (SCB) approved 313 housing<br />
loans, totaling KD 17.7 million. Of these loans, the majority<br />
(75%) will go to financing new housing construction (as<br />
opposed to purchasing existing homes), further indicating<br />
healthy demand in the residential sector. Additionally, KD<br />
9.0 million loans were disbursed by the SCB, a 23% y/y<br />
increase.<br />
February somewhat continued the previous month’s<br />
strong start in the real estate sector, despite having fewer<br />
days <strong>of</strong> activity. The pick-up in activity should continue<br />
throughout the year, perhaps with varied momentum.<br />
Residential real estate<br />
Commercial real estate<br />
260<br />
620<br />
80<br />
16<br />
220<br />
540<br />
70<br />
14<br />
60<br />
12<br />
180<br />
460<br />
50<br />
10<br />
140<br />
380<br />
40<br />
8<br />
100<br />
300<br />
30<br />
6<br />
20<br />
4<br />
60<br />
220<br />
10<br />
2<br />
20<br />
140<br />
Aug-09 Jan-10 Jun-10 Nov-10 Apr-11 Sep-11 Feb-12<br />
Sales (KD mn, LHS)<br />
Avg. transaction size (KD 000s, RHS)<br />
0<br />
0<br />
Aug-09 Jan-10 Jun-10 Nov-10 Apr-11 Sep-11 Feb-12<br />
Sales (KDmn, LHS)<br />
Avg. transaction size (KD 000s, RHS)<br />
investment real estate (apts & bldgs)<br />
140<br />
120<br />
1,400<br />
1,200<br />
100<br />
1,000<br />
80<br />
800<br />
60<br />
600<br />
40<br />
400<br />
20<br />
200<br />
Aug-09 Jan-10 Jun-10 Nov-10 Apr-11 Sep-11 Feb-12<br />
Sales (KD mn, LHS)<br />
Avg. transaction size (KD 000s, RHS)<br />
SCB loan approvals<br />
650<br />
300<br />
600<br />
250<br />
550<br />
200<br />
500<br />
450<br />
150<br />
400<br />
100<br />
350<br />
50<br />
300<br />
0<br />
250<br />
200<br />
-50<br />
150<br />
-100<br />
2009 2010 2011 2012<br />
Number <strong>of</strong> loans (LHS)<br />
KD value <strong>of</strong> loans (% y/y, RHS)
<strong>Economic</strong> <strong>Brief</strong> - April 2012<br />
REAL ESTATE SALES & SCB HOUSING LOANS<br />
Monthly Avg. Dec Jan Feb % %<br />
Real Estate Sales 2010 2011 2011 2012 2012 M/M Y/Y<br />
Sales Values (mn KD) 166.1 224.6 160.8 318.1 255.0 -19.8 17.5<br />
Residential Property 91.7 121.1 87.5 170.3 147.3 -13.5 61.4<br />
Apartments 54.4 82.9 61.3 127.3 97.4 -23.5 -20.6<br />
Commercial 20.0 20.5 12.0 20.5 10.4 -49.5 227.7<br />
Number <strong>of</strong> Transactions 561 625 593 980 830 -15.3 103.9<br />
Residential Property 425 494 486 806 722 -10.4 149.0<br />
Apartments 130 124 103 166 103 -38.0 -8.8<br />
Commercial 6 7 4 8 5 -37.5 25.0<br />
Average Transaction Size (000 KD) 302.2 369.7 271.2 324.6 307.2 -5.4 -42.4<br />
Residential Property 215.8 250.8 180.0 211.3 204.0 -3.5 -35.2<br />
Apartments 437.4 685.6 595.6 766.8 945.3 23.3 -12.9<br />
Commercial 3295.2 2809.2 3000.8 2560.8 2070.0 -19.2 162.2<br />
Monthly Avg. Dec Jan Feb % %<br />
SCB Housing Loans 2010 2011 2011 2012 2012 M/M Y/Y<br />
Value <strong>of</strong> Approved Loans (mn KD) 7.8 9.8 12.2 16.2 17.7 8.9 140.3<br />
New Construction 2.3 4.9 6.7 9.6 13.2 36.9 521.2<br />
Purchase <strong>of</strong> Existing Homes 3.9 3.1 3.2 5.0 3.0 -39.8 -9.9<br />
Additions & Renovations 1.6 1.8 2.3 1.6 1.5 -8.0 -22.3<br />
Number <strong>of</strong> Approved Loans 265 220 264 298 313 5.0 57.3<br />
New Construction 44 75 99 141 194 37.6 454.3<br />
Purchase <strong>of</strong> Existing Homes 83 61 59 84 57 -32.1 -18.6<br />
Additions & Renovations 138 85 106 73 62 -15.1 -34.0<br />
Value <strong>of</strong> Disbursed Loans (mn KD) 11.4 8.3 10.1 10.9 9.0 -17.6 23.0<br />
New Construction 5.9 4.3 5.0 6.7 4.8 -29.0 27.5<br />
Purchase <strong>of</strong> Existing Homes 3.7 2.5 3.2 2.5 2.4 -4.3 9.1<br />
Additions & Renovations 1.7 1.5 1.9 1.7 1.8 7.4 33.4<br />
Source: Ministry <strong>of</strong> Justice and the Savings and Credit <strong>Bank</strong><br />
10
Corporate Earnings<br />
Corporate Earnings down slightly on the year,<br />
challenges remain<br />
The reported earnings <strong>of</strong> 166 companies listed on the<br />
<strong>Kuwait</strong> Stock Exchange (KSE) totaled KD 1.4 billion for the<br />
full year 2011. For the sake <strong>of</strong> comparison, throughout our<br />
analysis, we have excluded Zain and Wataniya Telecom’s<br />
non-recurring gains* <strong>of</strong> 1H2010 and 1H2011 respectively.<br />
After making these adjustments, the combined company<br />
earnings were <strong>of</strong>f slightly (-1.7%) compared to 2010,<br />
reflecting further challenges in the operating environment.<br />
Non-<strong>Kuwait</strong>i companies saw the strongest growth in<br />
earnings in 2011 followed by the services sector where<br />
earnings grew 20%. All remaining sectors reported lower<br />
earnings in 2011 compared to 2010, including the banking<br />
sector. At KD 565 million, bank pr<strong>of</strong>its were down 1.7%<br />
on the year. This was despite a noticeable increase in their<br />
pre-provision income (+11%). Provisions were up 30% in<br />
2011 and together with stagnant credit growth during the<br />
year weighed down banks’ pr<strong>of</strong>itability.<br />
Investment companies, after seeing some improvement<br />
in earnings in 2010, went back into negative territory.<br />
2011 was a bad year for stock markets worldwide and<br />
especially for the <strong>Kuwait</strong> stock exchange (KSE) which fell<br />
16%. Investment portfolios were hit by significant losses<br />
as a result. It is worth noting here that out <strong>of</strong> the 47 listed<br />
investment companies; only half announced their earnings<br />
and therefore actual sector losses are likely well above the<br />
reported figure (KD 37 million).<br />
Out <strong>of</strong> the 166 companies that reported their 2011 results,<br />
57 companies incurred losses. Wataniya Telecom was<br />
the top performer in 2011 with KD 362 million (including<br />
its one-time gain), followed by <strong>National</strong> <strong>Bank</strong> <strong>of</strong> <strong>Kuwait</strong><br />
(NBK) and Zain with KD 302 million and KD 285 million<br />
respectively. On the worst performers side, <strong>National</strong> Real<br />
Estate and The Sultan Center topped the list with KD 41<br />
million and KD 38 million in losses respectively.<br />
Note: * Zain’s sale <strong>of</strong> African assets and Wataniya’s asset<br />
revaluation.<br />
CORPORATE Earnings history & GROWTH<br />
(million KD)<br />
5,000<br />
4,500<br />
4,000<br />
3,500<br />
3,000<br />
2,500<br />
2,000<br />
1,500<br />
1,000<br />
500<br />
0<br />
-500 YR06 YR07 YR08 YR09 YR10 YR11<br />
Net Pr<strong>of</strong>its Net pr<strong>of</strong>its excluding Zain and Wataniya's non-recurring pr<strong>of</strong>it<br />
SECTOR PERFORMANCE<br />
(million KD)<br />
Net Pr<strong>of</strong>its<br />
2011 2010<br />
Growth %<br />
<strong>Bank</strong>ing 565 575 -1.7<br />
Investment -37 78 ...<br />
Insurance 19 22 -11.3<br />
Real Estate -44 -33 ...<br />
Industrial 47 85 -44.9<br />
Services 439 367 19.6<br />
Food 48 55 -12.2<br />
Non-<strong>Kuwait</strong>i Companies 91 -1 ...<br />
Total Market 1,128 1,148 -1.7<br />
<strong>Kuwait</strong>i Companies 1,037 1,148 -9.7<br />
COMPANY PROFITS - 2011<br />
Highest Earnings<br />
million KD<br />
1. <strong>National</strong> Mobile Telecommunications 362.1<br />
2. <strong>National</strong> <strong>Bank</strong> <strong>of</strong> <strong>Kuwait</strong> 302.4<br />
3. Zain 284.9<br />
4. Ahli United <strong>Bank</strong> 85.7<br />
5. <strong>Kuwait</strong> Finance House 80.3<br />
Lowest Earnings<br />
million KD<br />
1. <strong>National</strong> Real Estate -40.9<br />
2. The Sultan Center -38.0<br />
3. Al-Mal Investment -31.0<br />
4. <strong>National</strong> Industries -28.8<br />
5. <strong>National</strong> Investments -27.3<br />
11
<strong>Economic</strong> <strong>Brief</strong> - April 2012<br />
CORPORATE EARNINGS - 2011<br />
(thousand KD)<br />
Code Company Name Full Year Growth Second Half Growth<br />
2011 2010 % 2011 2010 %<br />
<strong>Bank</strong>ing<br />
101 <strong>National</strong> <strong>Bank</strong> <strong>of</strong> <strong>Kuwait</strong> 302,406 301,686 0 156,452 155,745 0<br />
102 Gulf <strong>Bank</strong> 30,620 19,059 61 17,077 12,308 39<br />
103 Commercial <strong>Bank</strong> 810 40,452 -98 39,562 -722 …<br />
104 Al-Ahli <strong>Bank</strong> 50,336 53,178 -5 26,943 21,892 23<br />
105 Ahli United <strong>Bank</strong> 31,544 27,444 15 14,699 12,412 18<br />
106 <strong>Kuwait</strong> International <strong>Bank</strong> 10,841 16,754 -35 11,728 5,356 119<br />
107 Burgan <strong>Bank</strong> 50,562 4,655 986 11,888 25,285 -53<br />
108 <strong>Kuwait</strong> Finance House 80,342 105,983 -24 35,185 34,873 1<br />
109 Boubyan <strong>Bank</strong> 8,025 6,110 31 3,086 3,622 -15<br />
Investment<br />
201 <strong>Kuwait</strong> Investment Co. 3,548 -3,053 … -8,365 356 …<br />
202 Commercial Facilities 14,190 17,142 -17 7,152 8,361 -14<br />
203 International Financial Advisors … -18,261 … -6,573 … …<br />
204 <strong>National</strong> Investments -27,316 4,426 … -1,739 -31,238 …<br />
205 <strong>Kuwait</strong> Projects Company (Holding) 30,038 45,027 -33 40,813 13,479 203<br />
206 Al-Ahlia Investment … -21,858 … -17,075 … …<br />
207 Coast Investment & Development … 5,800 … 6,653 … …<br />
208 The International Investor … … … … … …<br />
209 Securities House … … … … … …<br />
210 Industrial & Financial Investments … … … … … …<br />
211 Securities Group … … … … … …<br />
212 International Finance Co. … -6,772 … … … …<br />
213 <strong>Kuwait</strong> Financial Centre -356 8,123 … 6,675 -1,106 …<br />
214 KMEFIC -11,839 -8,912 … -5,379 … …<br />
216 Aref Investment Group … … … … … …<br />
218 Al-Aman Investment … -8,136 … -9,599 … …<br />
219 First Investment Co. 2,066 -10,540 … -7,459 … …<br />
220 Al-Mal Investment -31,015 12,017 … 15,949 -22,096 …<br />
221 Gulf Investment House … … … … … …<br />
222 A’ayan Leasing & Investment Co. … … … … … …<br />
223 Bayan Investment Co. -5,367 -5,367 … 2,302 999 130<br />
224 Global Investment House … -73,206 … -38,778 … …<br />
225 Osoul Leasing & Investment Co. 178 178 0 647 -32 …<br />
227 <strong>Kuwait</strong> Finance & Investments Co. … … … … … …<br />
228 KIPCO Asset Management Co. -6,049 1,820 … 496 -6,493 …<br />
231 <strong>National</strong> International Co. (Holding) -309 -7,056 … -6,296 -703 …<br />
232 Housing Finance … … … … … …<br />
233 Al Madar Finance & Investment … … … … … …<br />
234 Al-Deera Holding Co. -16,541 -12,976 … -3,925 -13,244 …<br />
235 Al Safat Investment … … … … … …<br />
236 Al Salam Group Holding Company 4,048 -2,366 … -1,683 4,069 …<br />
237 EKTTITAB Holding Company -2,924 -5,933 … -1,675 -20 …<br />
238 Al Qurain Holding Company … 559 … 1,759 … …<br />
239 Sokouk Holding … … … … … …<br />
240 Al Madina for Finance & Investment … -8,243 … -4,598 … …<br />
241 Noor Financial Investment … … … … … …<br />
242 Al Tamdeen Investment 3,124 3,440 -9 83 377 -78<br />
243 <strong>Kuwait</strong> Bahrain International Exchange 585 662 -12 256 359 -29<br />
244 DAMAC <strong>Kuwait</strong>i Holding 1,268 -2,765 … 915 -1,210 …<br />
245 KUWAIT SYRIAN HOLDING -2,266 437 … -28 -1,425 …<br />
246 Strategia Investment co. 20 -1,852 … … … …<br />
247 <strong>Kuwait</strong> China Investment Co. -9,854 4,689 … 5,735 -10,911 …<br />
248 Manafae Investment Co. -2,727 -941 … -463 -2,075 …<br />
249 Gulf North Africa Holding Co. -2,460 285 … -119 -2,272 …<br />
250 Amwal International Investment Co. … … … … … …<br />
251 Al-Masar Leasing & Investment Co. K.S.C … … … … … …<br />
252 Al-Imtiaz Investment Co 22,722 41,315 -45 … 3,561 …<br />
Insurance<br />
301 <strong>Kuwait</strong> Insurance 4,350 3,897 12 1,007 1,849 -46<br />
302 Gulf Insurance 7,115 7,692 -8 3,486 3,011 16<br />
303 Al-Ahlia Insurance 7,573 8,275 -8 3,277 … …<br />
304 Warba Insurance 1,062 2,580 -59 770 -310 …<br />
305 <strong>Kuwait</strong> Re-Insurance 383 1,462 -74 -2,376 836 …<br />
306 First Takaful Insurance -1,295 -1,418 … -647 -1,175 …<br />
307 Wethaq Takaful Insurance Co. 0 -866 … 221 -27 …<br />
Real Estate<br />
401 <strong>Kuwait</strong> Real Estate 1,009 -20,712 … -22,128 991 …<br />
402 United Real Estate 10,109 5,553 82 3,000 5,032 -40<br />
403 <strong>National</strong> Real Estate -40,853 -34,449 … -42,849 -42,681 …<br />
12
CORPORATE EARNINGS - 2011<br />
(thousand KD)<br />
Code Company Name Full Year Growth Second Half Growth<br />
2011 2010 % 2011 2010 %<br />
404 Salhia Real Estate 7,174 10,204 -30 3,687 3,610 2<br />
405 Pearl <strong>of</strong> <strong>Kuwait</strong> Real Estate … 57 … … … …<br />
406 Al-Tamdeen Real Estate 3,824 4,625 -17 956 731 31<br />
408 Ajyal Real Estate Entertainment Co. -3,084 -11,025 … -10,313 -2,110 …<br />
409 Al-Massaleh Real Estate Co. 2,231 2,376 -6 1,824 -625 …<br />
410 Arab Real Estate -2,283 484 … 1,156 850 36<br />
411 Union Real Estate 1,459 1,309 11 582 717 -19<br />
412 Enma’a Real Estate 1,102 674 … 177 128 38<br />
413 Mabanee Co. 20,780 18,670 11 8,276 9,159 -10<br />
414 Injazzat Real Estate Development -4,837 1,300 … 1,290 -4,877 …<br />
416 Investors Holding Group … -19,880 … -19,510 … …<br />
417 International Resorts Co. -2,628 -2,513 … -1,474 -1,631 …<br />
418 Commercial Real Estate Co. 10,526 5,551 90 1,339 -247 …<br />
419 Sanam Real Estate Co. -2,505 -6,164 … -6,244 -2,375 …<br />
420 A’ayan Real Estate Co. 67 1,858 -96 1,094 709 54<br />
421 Aqar Real Estate -1,894 119 … 77 -1,270 …<br />
422 <strong>Kuwait</strong> Real Estate Holding -9,996 -4,173 … -3,531 -8,701 …<br />
423 Al Mazaya Holding -15,842 9,629 … 7,064 -12,710 …<br />
424 Al Dar <strong>National</strong> Real Estate 76 129 -42 2,893 … …<br />
425 Al-Themar International Holding … … … … … …<br />
426 Grand Real Estate Projects … … … … … …<br />
427 Tijara & Real Estate Investment -5,952 -2,645 … -2,223 -6,662 …<br />
428 Tameer Real Estate Investment -275 96 … -654 15 …<br />
429 Arkan Al-<strong>Kuwait</strong> Real Estate 1,362 -2,274 … -627 77 …<br />
431 Al-Argan International Real Estate 5,300 3,983 33 209 940 -78<br />
432 Abyarr Real Estate Development Co. 257 -4,997 … -2,582 -1,412 …<br />
433 Munshaat Real Estate Projects Co. … … … … … …<br />
434 First Dubai For Real Estate Development -15,118 -21,763 … -20,456 … …<br />
435 <strong>Kuwait</strong> Business Town real estate … 351 … 2,784 … …<br />
436 Manazel Holding Co. -11,245 -4,912 … -3,703 … …<br />
437 Real Estate Asset Managemnet Co - Ream 521 547 -5 185 124 50<br />
438 Mena Real Estate Co. … … … … … …<br />
439 Al Mudon International Real Estate 50 310 -84 277 -897 …<br />
440 Real Estate Trade Centers -241 5,454 … 4,115 52 7,778<br />
441 <strong>Kuwait</strong> Remal Real Estate 6,731 9,521 -29 … … …<br />
Industrial<br />
501 <strong>National</strong> Industries -28,757 -19,200 … -12,234 -37,470 …<br />
502 Kwt Pipes Industries & Oil Services … 387 … 1,082 … …<br />
503 <strong>Kuwait</strong> Cement 14,266 13,358 7 4,547 5,579 -18<br />
504 Refrigeration Industries -3,558 1,067 … 728 … …<br />
505 Gulf Cable & Electrical Industries 36,300 26,403 … 4,333 3,880 12<br />
506 Heavy Engineering Ind. & Shipbuilding 3,626 4,837 -25 3,096 689 350<br />
507 Contracting & Marine Services 1,660 2,034 -18 493 1,212 -59<br />
508 <strong>Kuwait</strong> Portland Cement 2,538 22,289 -89 11,187 1,430 683<br />
509 Shuaiba Paper Products 1,003 1,200 -16 420 507 -17<br />
510 Metal & Recycling -216 -496 … -552 -422 …<br />
511 <strong>Kuwait</strong> Foundry -3,313 5,872 … 2,783 -4,859 …<br />
512 Aerated Concrete Industries 1,909 3,784 -50 -694 432 …<br />
513 United Industries 1,210 4,045 -70 -749 269 …<br />
514 Boubyan Petrochemical Co. … … … … … …<br />
515 Gulf Glass Manufacturing 2,547 2,939 … 1,570 1,431 10<br />
516 Al-Hilal Cement 1,219 715 70 121 410 -71<br />
517 Al Kout Industrial Projects Co. 3,681 2,746 … 1,137 1,734 -34<br />
518 <strong>Kuwait</strong> Packaging Materials Manufac. 2,236 965 132 297 1,659 -82<br />
519 <strong>Kuwait</strong> Building Materials Manufac. 183 194 … 60 64 -7<br />
520 <strong>National</strong> Industries Co. for Bldg. 4,236 4,082 4 -91 1,120 …<br />
522 Equipment Holding -1,009 484 … -378 -1,324 …<br />
523 Mena Holding … … … … … …<br />
524 <strong>National</strong> Co. for Consumer Industries -1,663 -516 … -489 -1,077 …<br />
525 <strong>Kuwait</strong> Gypsum Manuf. & Trading 203 434 -53 194 119 63<br />
526 Qurain Petrochemical Industries … -1,902 … -3,546 … …<br />
527 Salbookh Trading Co. … -2,034 … -1,309 … …<br />
528 IKARUS Petroleum Industries 8,412 4,400 91 1,119 1,881 -41<br />
529 Boubyan International Industries Holding 200 3,570 -94 3,152 2,339 35<br />
Services<br />
601 <strong>Kuwait</strong> Cinema 5,385 5,017 7 1,772 1,932 -8<br />
602 <strong>Kuwait</strong> Hotels -661 -2,671 … -3,245 -677 …<br />
603 Agility 27,043 25,108 8 -10,572 11,513 …<br />
604 <strong>Kuwait</strong> Commercial Markets Complex … -5,754 … -2,067 … …<br />
605 Zain <strong>Kuwait</strong> 284,866 1,062,806 -73 167,481 144,688 16<br />
606 Al Safat Energy Holding Company -11,470 -4,375 … -2,797 -10,406 …<br />
607 Educational Holding Group 458 -6,054 … -2,629 -37 …<br />
13
<strong>Economic</strong> <strong>Brief</strong> - April 2012<br />
CORPORATE EARNINGS - 2011<br />
(thousand KD)<br />
Code Company Name Full Year Growth Second Half Growth<br />
2011 2010 % 2011 2010 %<br />
608 Independent Petroleum Group -6,058 4,485 … 2,271 -6,928 …<br />
609 <strong>National</strong> Cleaning Co. 1,612 1,379 17 506 864 -41<br />
610 The Sultan Center -37,989 -34,435 … -37,803 -34,066 …<br />
611 Al-Arabi Holding 1,608 815 97 154 1,342 -89<br />
612 City Group Company -5,496 1,260 … 302 -6,157 …<br />
613 Wataniya 362,125 78,020 364 42,166 53,648 -21<br />
614 <strong>Kuwait</strong> & Gulf Link Transport Co. -9,521 -4,439 … -7,487 -988 …<br />
615 <strong>Kuwait</strong> Cable Vision -1,304 -2,825 … -1,893 -368 …<br />
616 Automated Systems Co. 542 524 3 145 119 22<br />
617 <strong>National</strong> Petroleum Services Co. 2,338 1,589 47 885 738 20<br />
618 <strong>Kuwait</strong> Co. For Process Plant Cons.& Cont. 1,844 950 94 864 986 -12<br />
619 <strong>Kuwait</strong> Slaughter House 618 484 28 246 244 1<br />
620 EYAS for Higher & Technical Education 3,111 2,334 33 1,266 96 1,215<br />
621 Nibras Holding Co 219 203 8 73 176 -59<br />
622 Al Safwa Group -21,958 -17,668 … -13,221 -15,966 …<br />
623 Human S<strong>of</strong>t Holding 2,390 221 981 524 1,964 -73<br />
624 <strong>Kuwait</strong> Privatization Project Holding 4,170 1,996 109 1,290 -179 …<br />
625 Nafais Holding Company 1,639 -8,603 … -931 … …<br />
626 <strong>National</strong> Slaughter House 447 247 81 162 255 -36<br />
627 Aref Energy Holding -5,114 10,798 … -1,077 -4,489 …<br />
628 Safwan Trading & Contracting 2,059 1,838 12 882 967 -9<br />
629 Gulf Petroleum Investment 1,408 -699 … -1,037 -341 …<br />
630 Gulf Franchising -1,538 -1,892 … -1,118 -833 …<br />
631 Credit Rating and Collection -1,989 -157 … -172 -1,877 …<br />
632 <strong>National</strong> Ranges Co. … … … … … …<br />
633 Burgan Co. for Well Drilling … … … … … …<br />
634 IFA Hotels & Resorts 1,481 -19,523 … -14,554 129 …<br />
635 Combined Group Contracting 10,156 8,894 14 4,359 5,816 -25<br />
636 Jeeran Holding … … … … … …<br />
637 Palms Agro Production 452 823 -45 321 196 64<br />
638 Al-Safat Tec Holding Co. -6,606 -2,751 … -2,273 … …<br />
639 Mushrif Trading & Contracting 2,005 1,571 28 462 965 -52<br />
640 United Projects Group 2,273 3,277 -31 958 2,046 -53<br />
642 Aviation Lease & Finance 46,719 10,767 334 5,753 21,274 -73<br />
643 Al-Mowasat Holding 2,108 1,303 62 868 1,104 -21<br />
644 Mashaer Holding Company 5,201 -24,947 … -25,585 3,824 …<br />
645 Oula Fuel Marketing Company 4,059 2,887 41 1,288 2,024 -36<br />
647 Future Communications 1,153 3,216 -64 1,706 407 319<br />
649 Hayat Communication Co. -598 1,214 … 991 395 151<br />
650 Mubarrad Transport Co. -526 -179 … -67 -219 …<br />
651 <strong>Kuwait</strong> Resorts Co. 430 -3,939 … -4,205 -1,418 …<br />
652 Advanced Technology Co. 3,619 4,628 -22 2,304 1,549 49<br />
653 Yiaco Medical Company 5,034 4,498 12 1,921 2,207 -13<br />
654 Jazeera Airways Co. 10,555 -2,805 … 6,416 7,405 -13<br />
655 Al Sour 4,484 4,367 3 2,304 1,881 22<br />
657 Future Kid 842 247 241 -153 201 …<br />
658 KGL Logistics Company 9,019 7,492 20 3,483 4,071 -14<br />
659 AL-Nawadi Holding Co. 1,338 1,025 30 596 … …<br />
660 ALRAI MEDIA GROUP COMPANY K.S.C 1,253 2,212 -43 -33 -317 …<br />
661 ZIMA Holding Company -439 211 … -98 -461 …<br />
Food<br />
701 Livestock Trading & Transport -5,387 -205 … -242 -166 …<br />
702 Danah Alsafat Foodstuff Company -1,580 2,270 … 824 -634 …<br />
703 United Poultry 2,609 1,144 128 701 1,381 -49<br />
704 <strong>Kuwait</strong> Food Co (Americana) 48,022 46,220 4 19,016 18,665 2<br />
705 United Foodstuff Industries 267 210 27 -525 -122 …<br />
706 Kout Food Group 4,082 5,042 -19 3,578 2,112 69<br />
Non <strong>Kuwait</strong>ies<br />
804 Sharjah Cement & Industrial Dev. -3,514 2,689 … 1,124 -1,365 …<br />
805 Gulf Cement -4,162 5,638 … 2,673 -3,800 …<br />
806 Umm Al-Qaiwain Cement Industries 781 472 66 189 938 -80<br />
807 Fujairah Cement Industries -5,330 406 … -536 -4,676 …<br />
808 Ras Al-Khaimah for White Cement 5,206 6,336 -18 4,214 1,784 136<br />
809 Arab Insurance Group -5,310 5,843 … 6,648 -4,179 …<br />
810 United Gulf <strong>Bank</strong> 367 11,222 -97 1,976 -3,295 …<br />
811 Egypt <strong>Kuwait</strong> Holding 37,680 36,734 3 18,034 18,270 -1<br />
812 Bahrain <strong>Kuwait</strong> Insurance 3,042 3,142 -3 1,368 1,106 24<br />
813 Gulf Finance House 106 -96,784 … … … …<br />
817 Inovest -6,451 -9,661 … -7,139 -5,610 …<br />
818 Ahli United <strong>Bank</strong> 85,732 73,280 17 35,663 40,963 -13<br />
820 Ithmaar <strong>Bank</strong> -17,526 -39,933 … -41,153 -18,718 …<br />
14
<strong>Kuwait</strong> Stock Exchange<br />
KSE rally continues in March<br />
The <strong>Kuwait</strong> Stock Exchange (KSE) rally continued through<br />
March. But unlike February, large caps outperformed with<br />
the value-weighted index up 2.6% on the month. The price<br />
index was up a slight 0.6% closing the month at 6165,<br />
its best level since June 2011. Trading volumes declined<br />
slightly in March but still compare well to recent months’<br />
averages. The formation <strong>of</strong> the new government coupled<br />
with a slightly improved global outlook has contributed to<br />
a generally better sentiment in the local market so far in<br />
2012. The market has made some decent gains in the first<br />
quarter <strong>of</strong> the year; up 6% and 3.6% on a price and valueweighted<br />
basis respectively.<br />
Real estate was one <strong>of</strong> the better performing sectors in<br />
March at least on a value-weighted basis (up 6%). <strong>Bank</strong>s<br />
and services followed with gains <strong>of</strong> 3.5% and 2.6%<br />
respectively. “Non-<strong>Kuwait</strong>i companies” was the only sector<br />
down on the month.<br />
Volumes seem to have picked up from their 2011 levels<br />
and daily traded value averaged KD 40 million in 1Q2012<br />
compared to an average <strong>of</strong> KD 24 million last year. Activity<br />
seems to have recovered due to some easing <strong>of</strong> regulations<br />
by the Capital Market Authority (CMA).<br />
The market gained KD 500 million in capitalization which<br />
stood at KD 29 billion at the close <strong>of</strong> March.<br />
regional markets REBASED performance<br />
130<br />
120<br />
110<br />
100<br />
90<br />
80<br />
Mar-10 Jul-10 Nov-10 Mar-11 Jul-11 Nov-11 Mar-12<br />
S&P <strong>Kuwait</strong> S&P GCC<br />
S&P Pan Arab<br />
130<br />
120<br />
110<br />
100<br />
90<br />
80<br />
kse Daily performance<br />
kse REBASED performance<br />
80<br />
6400<br />
110<br />
110<br />
70<br />
60<br />
6300<br />
million KD<br />
50<br />
40<br />
30<br />
20<br />
6200<br />
6100<br />
index<br />
100<br />
90<br />
100<br />
90<br />
10<br />
0<br />
1<br />
5 7 9 13 15 19<br />
March 2012<br />
Value <strong>of</strong> Traded Shares (left)<br />
21 23 27 29<br />
KSE Index (right)<br />
6000<br />
80<br />
80<br />
Mar.11 May.11 Jul.11 Sep.11 Nov.11 Jan.12 Mar.12<br />
Value Weighted (LHS) Price Index (RHS)<br />
KSE PERFORMANCE BY SECTOR, March 2012<br />
Price- % Change in KSE Index Market Cap. % <strong>of</strong> Trading Activity Price to<br />
KSE Index Price-Weighted Value-Weighted (million KD) Market (daily average) Earnings +<br />
29-Mar-12 Mar-12 YTD 11 Mar-12 YTD 11 29-Mar-12 29-Mar-12 mn shares mn KD 29-Mar-12<br />
<strong>Bank</strong>ing 11,550 2.3 2.2 3.5 3.1 13,003 44.8 9.4 5.8 23<br />
Investment 3,943 0.6 10.6 0.6 8.9 2,085 7.2 149.0 10.8 ...<br />
Insurance 2,700 -0.2 -0.2 1.0 -0.2 319 1.1 0.0 0.0 17<br />
Real Estate 2,200 -2.3 8.1 6.0 14.4 1,910 6.6 128.6 8.2 ...<br />
Industrial 4,263 -0.1 0.9 1.2 0.0 2,193 7.6 13.7 2.8 35<br />
Services 14,024 3.7 5.8 2.8 3.7 7,646 26.4 128.2 12.9 11<br />
Food 4,325 -2.7 -0.1 0.2 1.3 717 2.5 3.9 0.4 15<br />
Non-<strong>Kuwait</strong>i 5,992 -4.4 17.2 -1.4 12.1 1,128 3.9 57.4 3.6 12<br />
Total Market 6,165 0.6 6.0 2.6 3.6 29,000 100.0 490.1 44.6 17<br />
<strong>Kuwait</strong>i Companies 27,872<br />
Source: <strong>Kuwait</strong> Stock Exchange and Zawya.<br />
Note: * PE is calculated using market cap as <strong>of</strong> month close and 12 months trailing earnings.<br />
15
Head Office<br />
International Network<br />
<strong>Kuwait</strong><br />
<strong>National</strong> <strong>Bank</strong> <strong>of</strong> <strong>Kuwait</strong> SAK<br />
Abdullah Al-Ahmed Street<br />
P.O. Box 95, Safat 13001<br />
<strong>Kuwait</strong> City, <strong>Kuwait</strong><br />
Tel: +965 2242 2011<br />
Fax: +965 2243 1888<br />
Telex: 22043-22451 NATBANK<br />
www.nbk.com<br />
While every care has been taken<br />
in preparing this publication,<br />
<strong>National</strong> <strong>Bank</strong> <strong>of</strong> <strong>Kuwait</strong> accepts<br />
no liability whatsoever for any<br />
direct or consequential losses<br />
arising from its use. <strong>Economic</strong> <strong>Brief</strong><br />
is distributed on a complimentary<br />
and discretionary basis to NBK<br />
clients and associates. This report<br />
and previous issues can be<br />
found in the “Reports” section<br />
<strong>of</strong> the <strong>National</strong> <strong>Bank</strong> <strong>of</strong> <strong>Kuwait</strong>’s<br />
web site. Please visit our web<br />
site, www.nbk.com, for other<br />
bank publications. For further<br />
information please contact<br />
NBK <strong>Economic</strong> Research at:<br />
Tel: (965) 2259 5500<br />
Fax: (965) 2224 6973<br />
Email: econ@nbk.com<br />
Bahrain<br />
<strong>National</strong> <strong>Bank</strong> <strong>of</strong> <strong>Kuwait</strong> SAK<br />
Bahrain Branch<br />
Zain Tower, Building 401, Road<br />
2806, Seef Area 428, P.O.Box 5290,<br />
Manama, Kingdom <strong>of</strong> Bahrain<br />
Tel: +973 17 155 555<br />
Fax: +973 17 582 297<br />
<strong>National</strong> <strong>Bank</strong> <strong>of</strong> <strong>Kuwait</strong><br />
Bahrain Branch (H.O)<br />
GB Corp Tower<br />
Block 346, Road 4626<br />
Building 1411<br />
P.O. Box 5290, Manama<br />
Kingdom <strong>of</strong> Bahrain<br />
Tel: +973 17 155 555<br />
Fax: +973 17 582 297<br />
Jordan<br />
<strong>National</strong> <strong>Bank</strong> <strong>of</strong> <strong>Kuwait</strong> SAK<br />
Amman Branch<br />
Shareef Abdul Hamid Sharaf St<br />
P.O. Box 941297<br />
Shmeisani, Amman 11194<br />
Jordan<br />
Tel: +962 6 560 8800<br />
Fax: +962 6 560 8811<br />
Saudi Arabia<br />
<strong>National</strong> <strong>Bank</strong> <strong>of</strong> <strong>Kuwait</strong> SAK<br />
Jeddah Branch<br />
Al Khalidiah District,<br />
Al Mukmal Tower, Jeddah<br />
P.O Box: 15385 Jeddah 21444<br />
Kingdom <strong>of</strong> Saudi Arabia<br />
Tel: +966 2 603 6300<br />
Fax: +966 2 603 6364<br />
Lebanon<br />
<strong>National</strong> <strong>Bank</strong> <strong>of</strong> <strong>Kuwait</strong><br />
(Lebanon) SAL<br />
BAC Building<br />
Justinian Street, Sanayeh<br />
P.O. Box 11-5727, Riyad El Solh<br />
Beirut 1107 2200, Lebanon<br />
Tel: +961 1 759700<br />
Fax: +961 1 747866<br />
Iraq<br />
Credit <strong>Bank</strong> <strong>of</strong> Iraq<br />
Street 9, Building 178<br />
Sadoon Street, District 102<br />
P.O. Box 3420<br />
Baghdad, Iraq<br />
Tel: +964 1 7182198/7191944<br />
+964 1 7188406/7171673<br />
Fax: +964 1 7170156<br />
Egypt<br />
Al Watany <strong>Bank</strong> <strong>of</strong> Egypt<br />
13 Al Themar Street<br />
Gameat Al Dowal AlArabia<br />
Fouad Mohie El Din Square<br />
Mohandessin, Giza, Egypt<br />
Tel: +20 2 33388816/33388817<br />
Fax: +20 2 33379302<br />
United Arab Emirates<br />
<strong>National</strong> <strong>Bank</strong> <strong>of</strong> <strong>Kuwait</strong> SAK<br />
Dubai Branch<br />
Sheikh Rashed Road<br />
Port Saeed Area<br />
ACICO Business Park<br />
P.O. Box 88867, Dubai UAE<br />
Tel: +971 4 292 9222<br />
Fax: +971 4 294 3337<br />
United States <strong>of</strong> America<br />
<strong>National</strong> <strong>Bank</strong> <strong>of</strong> <strong>Kuwait</strong> SAK<br />
New York Branch<br />
299 Park Avenue<br />
New York, NY 10171<br />
USA<br />
Tel: +1 212 303 9800<br />
Fax: +1 212 319 8269<br />
United Kingdom<br />
<strong>National</strong> <strong>Bank</strong> <strong>of</strong> <strong>Kuwait</strong><br />
(International) Plc<br />
Head Office<br />
13 George Street<br />
London W1U 3QJ, UK<br />
Tel: +44 20 7224 2277<br />
Fax: +44 20 7224 2101<br />
<strong>National</strong> <strong>Bank</strong> <strong>of</strong> <strong>Kuwait</strong><br />
(International) Plc<br />
Portman Square Branch<br />
7 Portman Square<br />
London W1H 6NA, UK<br />
Tel: +44 20 7224 2277<br />
Fax: +44 20 7486 3877<br />
France<br />
<strong>National</strong> <strong>Bank</strong> <strong>of</strong> <strong>Kuwait</strong><br />
(International) Plc<br />
Paris Branch<br />
90 Avenue des Champs-Elysees<br />
75008 Paris, France<br />
Tel: +33 1 5659 8600<br />
Fax: +33 1 5659 8623<br />
Singapore<br />
<strong>National</strong> <strong>Bank</strong> <strong>of</strong> <strong>Kuwait</strong> SAK<br />
Singapore Branch<br />
9 Raffles Place #24-01/02<br />
Republic Plaza<br />
Singapore 048619<br />
Tel: +65 6222 5348<br />
Fax: +65 6224 5438<br />
Vietnam<br />
<strong>National</strong> <strong>Bank</strong> <strong>of</strong> <strong>Kuwait</strong> SAK<br />
Vietnam Representative Office<br />
Room 2006, Sun Wah Tower<br />
115 Nguyen Hue Blvd, District 1<br />
Ho Chi Minh City<br />
Vietnam<br />
Tel: +84 8 3827 8008<br />
Fax: +84 8 3827 8009<br />
China<br />
<strong>National</strong> <strong>Bank</strong> <strong>of</strong> <strong>Kuwait</strong> SAK<br />
Shanghai Representative Office<br />
Suite 1003, 10th Floor, Azia Center<br />
1233 Lujiazui Ring Road<br />
Shanghai 200120<br />
China<br />
Tel: +86 21 6888 1092<br />
Fax: +86 21 5047 1011<br />
NBK Capital<br />
<strong>Kuwait</strong><br />
NBK Capital<br />
38th Floor, Arraya II Building<br />
Shuhada’a Street, Sharq<br />
P.O. Box 4950, Safat 13050<br />
<strong>Kuwait</strong><br />
Tel: +965 2224 6900<br />
Fax: +965 2224 6904<br />
United Arab Emirates<br />
NBK Capital Limited<br />
Precinct Building 3, Office 404<br />
Dubai International Financial Center<br />
P.O. Box 506506, Dubai<br />
United Arab Emirates<br />
Tel: +971 4 365 2800<br />
Fax: +971 4 365 2805<br />
Turkey<br />
NBK Capital<br />
Arastima ve Musavirlik AS<br />
SUN Plaza, 30th Floor<br />
Dereboyu Sk. No.24<br />
Maslak 34398, Istanbul, Turkey<br />
Tel: +90 212 276 5400<br />
Fax: +90 212 276 5401<br />
Associates<br />
Qatar<br />
International <strong>Bank</strong> <strong>of</strong> Qatar (QSC)<br />
Suhaim bin Hamad Street<br />
P.O. Box 2001<br />
Doha, Qatar<br />
Tel: +974 4447 3700<br />
Fax: +974 4447 3710<br />
Turkey<br />
Turkish <strong>Bank</strong><br />
Valikonagl CAD. 7<br />
Nisantasi 34371,<br />
Istanbul, Turkey<br />
Tel: +90 212 373 6373<br />
Fax: +90 212 225 0353<br />
© Copyright Notice. <strong>Economic</strong> <strong>Brief</strong> is a publication <strong>of</strong> <strong>National</strong> <strong>Bank</strong> <strong>of</strong> <strong>Kuwait</strong>. No part <strong>of</strong> this publication<br />
may be reproduced or duplicated without the prior consent <strong>of</strong> NBK.