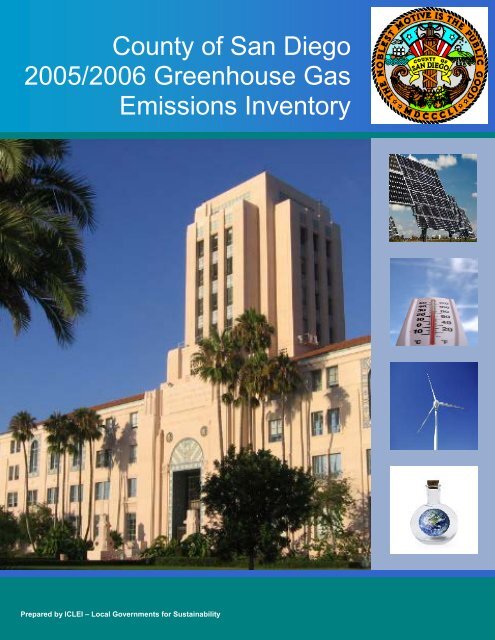
County of San Diego 2005/2006 Greenhouse Gas Emissions Inventory
County of San Diego 2005/2006 Greenhouse Gas Emissions Inventory
County of San Diego 2005/2006 Greenhouse Gas Emissions Inventory

You also want an ePaper? Increase the reach of your titles
YUMPU automatically turns print PDFs into web optimized ePapers that Google loves.
<strong>County</strong> <strong>of</strong> <strong>San</strong> <strong>Diego</strong><br />
<strong>2005</strong>/<strong>2006</strong> <strong>Greenhouse</strong> <strong>Gas</strong><br />
<strong>Emissions</strong> <strong>Inventory</strong><br />
<strong>2005</strong>/<strong>2006</strong> <strong>San</strong> <strong>Diego</strong> <strong>County</strong> <strong>Greenhouse</strong> <strong>Gas</strong> <strong>Emissions</strong> <strong>Inventory</strong> i<br />
Prepared by ICLEI – Local Governments for Sustainability
Credits and Acknowledgements<br />
COUNTY OF SAN DIEGO<br />
Department <strong>of</strong> Planning and<br />
Land Use<br />
Devon Muto, Chief<br />
Robert Citrano<br />
Mindy Fogg<br />
Eric Lardy<br />
Jimmy Wong<br />
<strong>San</strong> <strong>Diego</strong> Foundation<br />
Department <strong>of</strong> Public Works<br />
Daniel Brogadir<br />
Jason Forga<br />
Vicky Gallagher<br />
Michael Krosky<br />
Victoria L<strong>of</strong>tis<br />
Department <strong>of</strong> General Services<br />
Michael Urquhart, Chief<br />
David Bosley<br />
Robert Grable<br />
James LeSire<br />
Peter Livingston<br />
Amie Meegan<br />
Walter Stepahin<br />
Robin Snyder<br />
Emily Young, Senior Director, Environmental Analysis and Strategy<br />
<strong>San</strong> <strong>Diego</strong> <strong>Gas</strong> & Electric<br />
Risa Baron, Energy Programs Supervisor<br />
Noel Crisostomo, Energy Programs Specialist<br />
Ben Lopez, Senior Customer Service Analyst<br />
Jim Tello, Senior Account Executive<br />
<strong>San</strong> <strong>Diego</strong> Association <strong>of</strong> Governments (SANDAG)<br />
Rick Curry, Senior Transportation Modeler<br />
Beth Jarosz, Associate Analyst<br />
Andrew Martin, Associate Regional Planner<br />
Allied Waste/Republic Service<br />
Ryane Hughes, Major Account Representative<br />
ICLEI-Local Governments for Sustainability USA<br />
Alison Culpen, Program Officer<br />
Sarah Favrot, Program Intern<br />
Brian Holland, Program Officer (<strong>San</strong> <strong>Diego</strong> Region)<br />
Cheryl Laskowski, Climate Fellow<br />
Michael Schmitz, Regional Director (CA)<br />
This report was prepared by Cheryl Laskowski, Climate Fellow, and Brian Holland, Program Officer, at ICLEI-Local Governments for Sustainability USA,<br />
with the generous assistance <strong>of</strong> Noel Crisostomo, SDG&E. The authors gratefully acknowledge the dedication <strong>of</strong> the staff <strong>of</strong> the <strong>County</strong> <strong>of</strong> <strong>San</strong> <strong>Diego</strong>, which<br />
provided much <strong>of</strong> the insight and local information necessary for the completion <strong>of</strong> this report. We would also like to extend our thanks to the <strong>San</strong> <strong>Diego</strong><br />
Foundation, which supported the preparation <strong>of</strong> this inventory<br />
<strong>2005</strong>/<strong>2006</strong> <strong>San</strong> <strong>Diego</strong> <strong>County</strong> <strong>Greenhouse</strong> <strong>Gas</strong> <strong>Emissions</strong> <strong>Inventory</strong> ii
The <strong>San</strong> <strong>Diego</strong> Foundation<br />
Bob Kelly, President and Chief Executive Officer<br />
With a dynamic mix <strong>of</strong> leadership, grantmaking, and civic engagement, The<br />
<strong>San</strong> <strong>Diego</strong> Foundation makes the <strong>San</strong> <strong>Diego</strong> region a better place to live. Founded in 1975, The Foundation<br />
addresses evolving issues facing our region by convening community leaders, providing research and expertise on<br />
topics important to our citizens, and partnering with nonpr<strong>of</strong>it organizations to meet urgent and changing needs. By<br />
working with individuals, families and organizations to carry out their giving plans, The <strong>San</strong> <strong>Diego</strong> Foundation<br />
utilizes charitable dollars toward the ultimate goal <strong>of</strong> improving the quality <strong>of</strong> life in the greater <strong>San</strong> <strong>Diego</strong> region,<br />
now and for generations to come.<br />
www.sdfoundation.org<br />
The <strong>San</strong> <strong>Diego</strong> Foundation launched its Climate Initiative in <strong>2006</strong>, to raise public awareness about the local<br />
implications <strong>of</strong> climate change and catalyze more comprehensive regional action on global warming. The initiative<br />
represents a multi-year effort to bring government, business, the research community, and nonpr<strong>of</strong>its together to<br />
tackle one <strong>of</strong> the greatest challenges <strong>of</strong> our time. Over the next few years, The <strong>San</strong> <strong>Diego</strong> Foundation will work in<br />
partnership with ICLEI to engage local governments and public agencies to develop local climate action plans to<br />
reduce emissions and vulnerabilities to climate change in our region, bring more resources to support model<br />
programs to promote “green” economic growth and build a more sustainable region, and build public awareness<br />
and support for climate action.<br />
ICLEI-Local Governments for Sustainability USA<br />
Jeb Brugmann, Interim Executive Director<br />
ICLEI-Local Governments for Sustainability USA (ICLEI) is a membership association <strong>of</strong> more than 1,000 local<br />
governments worldwide—more than 500 in the United States—committed to advancing climate protection and<br />
sustainability. Through technical expertise, direct network engagement, and the innovation and evolution <strong>of</strong> tools,<br />
ICLEI strives to empower local governments to set and achieve their emissions reduction and sustainability goals.<br />
http://www.icleiusa.org<br />
<strong>2005</strong>/<strong>2006</strong> <strong>San</strong> <strong>Diego</strong> <strong>County</strong> <strong>Greenhouse</strong> <strong>Gas</strong> <strong>Emissions</strong> <strong>Inventory</strong> iii
Table <strong>of</strong> Contents<br />
Executive Summary<br />
Government Operations <strong>Inventory</strong> Results................................................................................................x<br />
Community <strong>Inventory</strong> Results ................................................................................................................ xii<br />
Introduction<br />
1.1 Climate Change Background and Potential Impacts............................................................................3<br />
1.2 Purpose <strong>of</strong> <strong>Inventory</strong>............................................................................................................................5<br />
1.3 Climate Change Mitigation Activities in California ............................................................................6<br />
1.4 Climate Change Mitigation Activities in the <strong>County</strong> <strong>of</strong> <strong>San</strong> <strong>Diego</strong>.....................................................7<br />
1.5 The <strong>San</strong> <strong>Diego</strong> Regional Climate Protection Initiative........................................................................7<br />
Methodology<br />
2.1 <strong>Greenhouse</strong> <strong>Gas</strong>es ..............................................................................................................................11<br />
2.2 Calculating <strong>Emissions</strong>........................................................................................................................11<br />
2.3 Reporting <strong>Emissions</strong> ..........................................................................................................................12<br />
2.3.1 The Scopes Framework...............................................................................................................12<br />
2.3.2 Double Counting and Rolling Up Scopes ...................................................................................14<br />
2.3.3 <strong>Emissions</strong> Sectors........................................................................................................................15<br />
Government Operations <strong>Inventory</strong> Results<br />
3.1 Summary by Sector............................................................................................................................17<br />
3.2 Summary by Source ...........................................................................................................................19<br />
3.3 Summary <strong>of</strong> Energy-Related Costs....................................................................................................20<br />
3.4 Detailed Sector Analyses ...................................................................................................................20<br />
3.4.1 Buildings and Other Facilities....................................................................................................20<br />
3.4.2 Streetlights, Traffic Signals, and Other Public Lighting ............................................................22<br />
3.4.3 Water Transport..........................................................................................................................23<br />
3.4.4 Wastewater Treatment Facilities ................................................................................................23<br />
3.4.5 Solid Waste Facilities.................................................................................................................24<br />
3.4.6 Vehicle Fleet and Mobile Equipment..........................................................................................25<br />
3.4.7 Government-Generated Solid Waste...........................................................................................27<br />
Community <strong>Inventory</strong> Results<br />
4.1 Community <strong>Inventory</strong> Summary .......................................................................................................30<br />
4.1.1 Summary by Scope ......................................................................................................................31<br />
4.1.2 Summary by Sector......................................................................................................................31<br />
4.1.3 Summary by Source.....................................................................................................................32<br />
4.1.4 Per Capita <strong>Emissions</strong>..................................................................................................................33<br />
<strong>2005</strong>/<strong>2006</strong> <strong>San</strong> <strong>Diego</strong> <strong>County</strong> <strong>Greenhouse</strong> <strong>Gas</strong> <strong>Emissions</strong> <strong>Inventory</strong> iv
4.2 Community <strong>Inventory</strong> Detail by Sector .............................................................................................34<br />
4.2.1 Residential Sector........................................................................................................................34<br />
4.2.2 Commercial / Industrial Sector...................................................................................................35<br />
4.2.3 Transportation Sector .................................................................................................................36<br />
4.2.4 Solid Waste Sector.......................................................................................................................36<br />
4.2.5 Wastewater Sector.......................................................................................................................36<br />
4.3 Community <strong>Emissions</strong> Forecast.........................................................................................................37<br />
4.3.1 Residential Sector........................................................................................................................37<br />
4.3.2 Commercial / Industrial Sector...................................................................................................38<br />
4.3.3 Transportation Sector .................................................................................................................38<br />
4.3.4 Solid Waste and Wastewater Sectors ..........................................................................................39<br />
Conclusion<br />
5.1 Toward Setting <strong>Emissions</strong> Reduction Targets ...................................................................................41<br />
5.1.1 The Long-Term Goal...................................................................................................................42<br />
5.1.2 State <strong>of</strong> California Targets and Guidance ..................................................................................42<br />
5.1.3 Department Targets ....................................................................................................................43<br />
5.2 Creating an <strong>Emissions</strong> Reduction Strategy........................................................................................43<br />
Appendix A: The Local Government Operations Protocol<br />
A.1 Local Government Operations Protocol.............................................................................................. I<br />
A.1.1 Background................................................................................................................................... I<br />
A.1.2 Organizational Boundaries ......................................................................................................... II<br />
A.1.3 Types <strong>of</strong> <strong>Emissions</strong>....................................................................................................................... II<br />
A.1.4 Quantifying <strong>Emissions</strong>................................................................................................................III<br />
A.1.5 Reporting <strong>Emissions</strong> ...................................................................................................................IV<br />
A.2 Baseline Years....................................................................................................................................V<br />
Appendix B: LGOP Standard Report<br />
Appendix C: Government-Generated Solid Waste Methodology<br />
C.1 Estimating Waste Tonnages from the <strong>County</strong> <strong>of</strong> <strong>San</strong> <strong>Diego</strong>'s Operations.....................................XIII<br />
C.2 <strong>Emissions</strong> Calculation Methods .....................................................................................................XIII<br />
C.2.1 Methane Commitment Method ................................................................................................ XIV<br />
Appendix D: Community <strong>Inventory</strong> Methodology<br />
D.1 Overview <strong>of</strong> <strong>Inventory</strong> Contents and Approach .............................................................................XV<br />
D.1.1 <strong>Emissions</strong> Sources Included and Excluded ..............................................................................XV<br />
D.2 <strong>Emissions</strong> Forecast....................................................................................................................... XVII<br />
D.3 The Built Environment: Residential, Commercial, and Industrial Sectors.................................. XVII<br />
D.4 On-road Transportation and Off-road Mobile Sources...............................................................XVIII<br />
<strong>2005</strong>/<strong>2006</strong> <strong>San</strong> <strong>Diego</strong> <strong>County</strong> <strong>Greenhouse</strong> <strong>Gas</strong> <strong>Emissions</strong> <strong>Inventory</strong> v
D.4.1 On-road Transportation........................................................................................................XVIII<br />
D.4.2 Off-road Mobile Sources.......................................................................................................XVIII<br />
D.5 Solid Waste ................................................................................................................................... XIX<br />
D.5.1 Landfill Waste-in-Place .......................................................................................................... XIX<br />
D.5.2 Community-Generated Solid Waste ........................................................................................ XIX<br />
D.6 Wastewater.................................................................................................................................... XIX<br />
Appendix E: Conducting a Monitoring <strong>Inventory</strong><br />
E.1 ICLEI Tools for Local Governments...............................................................................................XX<br />
E.2 Relationship to Other <strong>San</strong> <strong>Diego</strong> Regional Climate Protection Initative Inventories ................... XXI<br />
E.3 Improving <strong>Emissions</strong> Estimates .................................................................................................... XXI<br />
E.4 Conducting the <strong>Inventory</strong> ............................................................................................................. XXII<br />
<strong>2005</strong>/<strong>2006</strong> <strong>San</strong> <strong>Diego</strong> <strong>County</strong> <strong>Greenhouse</strong> <strong>Gas</strong> <strong>Emissions</strong> <strong>Inventory</strong> vi
List <strong>of</strong> Tables and Figures<br />
List <strong>of</strong> Tables<br />
ES.1 <strong>2006</strong> Government Operations <strong>Emissions</strong> by Sector xi<br />
ES.2 <strong>2006</strong> Community <strong>Emissions</strong> by Sector xiii<br />
2.1 <strong>Greenhouse</strong> <strong>Gas</strong>es 11<br />
2.2 Basic <strong>Emissions</strong> Calculations 12<br />
3.1 <strong>2006</strong> <strong>San</strong> <strong>Diego</strong> <strong>County</strong> Government Operations <strong>Emissions</strong> by Sector 18<br />
3.2 <strong>2006</strong> <strong>San</strong> <strong>Diego</strong> <strong>County</strong> Government Operations <strong>Emissions</strong> by Source 20<br />
3.3 Energy Use and <strong>Emissions</strong> from Major Facilities 22<br />
3.4 Energy Use and <strong>Emissions</strong> from Public Lighting 23<br />
3.5 Energy Use and <strong>Emissions</strong> from Water Transport Equipment 23<br />
3.6 Wastewater Treatment <strong>Emissions</strong> By Type 24<br />
3.7 Solid Waste Facilities <strong>Emissions</strong> by Type 25<br />
3.8 <strong>Emissions</strong> from Vehicle Fleet and Mobile Equipment by Department 26<br />
4.1 Community <strong>Emissions</strong> Summary by Scope 30<br />
4.2 Community <strong>Emissions</strong> Summary by Sector 32<br />
4.3 <strong>2005</strong> Community <strong>Emissions</strong> Summary by Source 33<br />
4.4 <strong>2005</strong> Per Capita <strong>Emissions</strong> 34<br />
4.5 <strong>2005</strong> On-road Transportation <strong>Emissions</strong> by Type 36<br />
4.6 Waste <strong>Emissions</strong> Sources 37<br />
4.7 Community <strong>Emissions</strong> Growth Forecast by Sector 39<br />
<strong>2005</strong>/<strong>2006</strong> <strong>San</strong> <strong>Diego</strong> <strong>County</strong> <strong>Greenhouse</strong> <strong>Gas</strong> <strong>Emissions</strong> <strong>Inventory</strong> vii
List <strong>of</strong> Figures<br />
ES.1 <strong>2006</strong> <strong>San</strong> <strong>Diego</strong> <strong>County</strong> Government Operations <strong>Emissions</strong> by Sector xi<br />
ES.2 <strong>2006</strong> <strong>San</strong> <strong>Diego</strong> <strong>County</strong> Community <strong>Emissions</strong> by Sector xii<br />
1.1 The Five-Milestone Process 5<br />
2.1 <strong>Emissions</strong> Scopes 13<br />
3.1 <strong>2006</strong> <strong>San</strong> <strong>Diego</strong> <strong>County</strong> Government Operations <strong>Emissions</strong> by Sector 18<br />
3.2 <strong>2006</strong> <strong>San</strong> <strong>Diego</strong> <strong>County</strong> Government Operations <strong>Emissions</strong> by Source 19<br />
3.3 <strong>Emissions</strong> from Major Facilities by Department 21<br />
3.4 <strong>Emissions</strong> from Major Facilities by Source 22<br />
3.5 <strong>Emissions</strong> By Landfill 25<br />
3.6 <strong>Emissions</strong> from Mobile Sources 27<br />
4.1 Community Scope 1 <strong>Emissions</strong> 31<br />
4.2 Community <strong>Emissions</strong> Summary by Sector 32<br />
4.3 Community <strong>Emissions</strong> Summary by Source 33<br />
4.4 Residential <strong>Emissions</strong> by Source 34<br />
4.5 Commercial / Industrial <strong>Emissions</strong> by Source 35<br />
4.6 Community <strong>Emissions</strong> Forecast for 2020 38<br />
5.1 California <strong>Greenhouse</strong> <strong>Gas</strong> Reduction Targets 42<br />
<strong>2005</strong>/<strong>2006</strong> <strong>San</strong> <strong>Diego</strong> <strong>County</strong> <strong>Greenhouse</strong> <strong>Gas</strong> <strong>Emissions</strong> <strong>Inventory</strong> viii
\<br />
Executive<br />
Summary<br />
The <strong>County</strong> <strong>of</strong> <strong>San</strong> <strong>Diego</strong> has recognized that human-caused climate change is a reality, with potentially disruptive<br />
effects to the <strong>County</strong>’s residents and businesses. The <strong>County</strong> also recognizes that local governments play a leading<br />
role in both reducing greenhouse gas emissions and adapting to the potential impacts <strong>of</strong> climate change. Local<br />
governments can dramatically reduce emissions from their government operations through such measures as<br />
increasing energy efficiency in facilities and vehicle fleets, utilizing renewable energy sources, enacting sustainable<br />
purchasing policies, reducing waste, and supporting alternative modes <strong>of</strong> transportation for employees. The cobenefits<br />
<strong>of</strong> these measures may include lower energy bills, improved air quality, and more efficient government<br />
operations.<br />
The <strong>County</strong> <strong>of</strong> <strong>San</strong> <strong>Diego</strong> has begun its efforts to address the causes and effects <strong>of</strong> climate change with the<br />
assistance <strong>of</strong> the partners in the <strong>San</strong> <strong>Diego</strong> Regional Climate Protection Initiative. These partners include the <strong>San</strong><br />
<strong>Diego</strong> Foundation, local incorporated jurisdictions within the <strong>County</strong> <strong>of</strong> <strong>San</strong> <strong>Diego</strong>, and ICLEI.<br />
This greenhouse gas emissions inventory is an important first step in the <strong>County</strong>’s climate protection initiative. As<br />
advised by ICLEI, it is essential to first quantify emissions to establish:<br />
• A baseline emissions inventory, against which to measure future progress.<br />
• An understanding <strong>of</strong> the scale <strong>of</strong> emissions from various sources.<br />
Presented here are estimates <strong>of</strong> greenhouse gas emissions in <strong>2006</strong> resulting from the <strong>County</strong> <strong>of</strong> <strong>San</strong> <strong>Diego</strong>’s<br />
government operations and from the <strong>San</strong> <strong>Diego</strong> <strong>County</strong> community-at-large in <strong>2005</strong>. With one exception, 1 all<br />
government operations emissions estimates in this report refer to emissions generated from sources over which the<br />
1 The exception is emissions from employee-owned vehicles that are used by employees during commuting.<br />
<strong>2005</strong>/<strong>2006</strong> <strong>San</strong> <strong>Diego</strong> <strong>County</strong> <strong>Greenhouse</strong> <strong>Gas</strong> <strong>Emissions</strong> <strong>Inventory</strong> ix
<strong>County</strong> has direct operational control, exclusive <strong>of</strong> physical location. 2 This includes all government-operated<br />
facilities, streetlights, and other stationary sources; the on-road vehicle fleet and <strong>of</strong>f-road equipment; and waste<br />
generated by government operations. The inventory also estimates emissions from the community-at-large.<br />
Community-scale emissions are reported by five primary sectors: residential, commercial/industrial, transportation,<br />
solid waste, and wastewater.<br />
Like all emissions inventories, this document must rely on the best available data and calculation methodologies.<br />
<strong>Emissions</strong> estimates are subject to change as better data and calculation methodologies become available in the<br />
future. Nevertheless, the findings <strong>of</strong> this analysis provide a solid basis upon which the <strong>County</strong> <strong>of</strong> <strong>San</strong> <strong>Diego</strong> can<br />
begin planning and taking action to reduce its greenhouse gas emissions.<br />
This inventory is one <strong>of</strong> the first inventories to use a new national standard developed and adopted by the California<br />
Air Resources Board (CARB) in conjunction with ICLEI, the California Climate Action Registry, and The Climate<br />
Registry. This standard, called the Local Government Operations Protocol (LGOP), provides standard accounting<br />
principles, boundaries, quantification methods, and procedures for reporting greenhouse gas emissions from local<br />
government operations. The LGOP represents a strong step forward in standardizing how inventories are conducted<br />
and reported, providing a common national framework for all local governments to establish their emissions<br />
baseline.<br />
Government Operations <strong>Inventory</strong> Results<br />
In <strong>2006</strong>, <strong>San</strong> <strong>Diego</strong> <strong>County</strong>’s operational greenhouse gas emissions totaled 151,237 metric tons <strong>of</strong> CO 2 e. 3 Of the<br />
total emissions accounted for in this inventory, emissions from solid waste facilities were the largest (42 percent as<br />
shown in Figure ES.1 and Table ES.1), closely followed by buildings and facilities, accounting for 36 percent <strong>of</strong><br />
total emissions.<br />
Cumulatively, the <strong>County</strong> <strong>of</strong> <strong>San</strong> <strong>Diego</strong> spent approximately $16.2 million on energy (electricity, natural gas,<br />
gasoline, diesel, and refrigerants) for government operations in <strong>2006</strong> 4 . Of this total, over 56 percent <strong>of</strong> these energy<br />
expenses (over $9.2 million) resulted from electricity consumption from <strong>San</strong> <strong>Diego</strong> <strong>Gas</strong> and Electric (SDG&E).<br />
Fuel purchases (gasoline, diesel) for the vehicle fleet totaled $7 million, or 43 percent <strong>of</strong> the total energy costs<br />
included in this inventory. Cost data should be treated with some caution, however, as some sectors were<br />
underreported or not reported due to a lack <strong>of</strong> data. These figures demonstrate the potential for significantly<br />
2 Facilities, vehicles, or other operations wholly or partially owned by, but not operated by the <strong>County</strong> <strong>of</strong> <strong>San</strong> <strong>Diego</strong> are not included in this<br />
inventory. See Appendix A for more details on the boundaries <strong>of</strong> the inventory.<br />
3 This number represents a “roll-up” <strong>of</strong> emissions, and is not intended to represent a complete picture <strong>of</strong> emissions from the <strong>County</strong>’s<br />
operations. This roll-up number should not be used for comparison with other local government roll-up numbers without a detailed analysis <strong>of</strong><br />
the basis for this total.<br />
4 Cost data were provided by the <strong>County</strong> <strong>of</strong> <strong>San</strong> <strong>Diego</strong> for <strong>2006</strong>.<br />
<strong>2005</strong>/<strong>2006</strong> <strong>San</strong> <strong>Diego</strong> <strong>County</strong> <strong>Greenhouse</strong> <strong>Gas</strong> <strong>Emissions</strong> <strong>Inventory</strong> x
educing energy costs while also mitigating climate change impacts and helping to stimulate green job development<br />
and economic recovery.<br />
Figure ES.1 Government Operations <strong>Emissions</strong> by Sector<br />
Solid Waste<br />
Facilities<br />
43%<br />
Buildings and<br />
Facilities<br />
36%<br />
Vehicle Fleet<br />
16%<br />
Water Transport<br />
Employee commuting is an important government operations sector that could not be incorporated in to this report<br />
due to restrictions on data. <strong>Emissions</strong> from employee commuting are scope 3 emissions generated when employees<br />
combust fossil fuels commuting to and from government facilities. Other local governments who were able to<br />
quantify employee commute emissions found that this sector is normally one <strong>of</strong> the largest emitting sectors,<br />
comprising between 20 and 30 percent <strong>of</strong> total emissions. While local governments do not directly control how<br />
employees commute, <strong>County</strong> policy can have a significant impact in encouraging employees to use alternate modes<br />
<strong>of</strong> transportation to commute.<br />
Community <strong>Inventory</strong> Results<br />
In <strong>2005</strong>, the <strong>San</strong> <strong>Diego</strong> <strong>County</strong> community emitted approximately 4,197,665 metric tons <strong>of</strong> CO 2 e. As shown in<br />
Figure ES.2 and Table ES.2 below, the transportation sector was by far the largest source <strong>of</strong> emissions, generating<br />
approximately 2,909,342 metric tons <strong>of</strong> CO 2 e, or 69 percent <strong>of</strong> total <strong>2005</strong> emissions. Transportation sector<br />
emissions are the result <strong>of</strong> diesel and gasoline combustion in vehicles traveling on both local roads and state<br />
highways that pass through the jurisdictional boundaries <strong>of</strong> <strong>San</strong> <strong>Diego</strong> <strong>County</strong>.<br />
Figure ES.2 Community <strong>Emissions</strong> by Sector<br />
Solid Waste<br />
3%<br />
Wastewater<br />
1% Residential<br />
12%<br />
Commercial /<br />
Industrial<br />
15%<br />
Transportation<br />
69%<br />
<strong>2005</strong>/<strong>2006</strong> <strong>San</strong> <strong>Diego</strong> <strong>County</strong> <strong>Greenhouse</strong> <strong>Gas</strong> <strong>Emissions</strong> <strong>Inventory</strong> xii
Electricity and natural gas consumption within the commercial / industrial sector, the second greatest source <strong>of</strong> <strong>2005</strong><br />
emissions, generated 615,687 metric tons CO 2 e, or 15 percent <strong>of</strong> the total. Similarly, electricity and natural gas use<br />
in unincorporated <strong>San</strong> <strong>Diego</strong> <strong>County</strong>’s residential sector produced 505,963 metric tons CO 2 e, or 12 percent <strong>of</strong> total<br />
community emissions. The remaining four percent <strong>of</strong> emissions are from methane released by landfills in the base<br />
year, and from the estimated future methane emissions that will result from the decomposition <strong>of</strong> solid waste and<br />
wastewater that was generated by the <strong>San</strong> <strong>Diego</strong> <strong>County</strong> community in the base year.<br />
Table ES.2: <strong>2005</strong> Community <strong>Emissions</strong><br />
Summary by Sector<br />
<strong>Greenhouse</strong> <strong>Gas</strong><br />
<strong>Emissions</strong><br />
Sector<br />
(metric tons CO2e)<br />
Residential 505,963<br />
Commercial / Industrial 615,687<br />
Transportation 2,909,342<br />
Solid Waste 139,999<br />
Wastewater 21,808<br />
TOTAL 4,192,800<br />
<strong>2005</strong>/<strong>2006</strong> <strong>San</strong> <strong>Diego</strong> <strong>County</strong> <strong>Greenhouse</strong> <strong>Gas</strong> <strong>Emissions</strong> <strong>Inventory</strong> xiii
<strong>2005</strong>/<strong>2006</strong> <strong>San</strong> <strong>Diego</strong> <strong>County</strong> <strong>Greenhouse</strong> <strong>Gas</strong> <strong>Emissions</strong> <strong>Inventory</strong> 2
Introduction<br />
Local governments play a fundamental role in addressing the causes and effects <strong>of</strong> human-induced climate change<br />
through their actions at both the community and government operations levels. While local governments cannot<br />
solve the problems <strong>of</strong> climate change by themselves, their policies can dramatically reduce greenhouse gas<br />
emissions from a range <strong>of</strong> sources and can prepare their communities for the potential impacts <strong>of</strong> climate change.<br />
Within the context <strong>of</strong> government operations, local governments have direct control over their emissions-generating<br />
activities. They can reduce energy consumption in buildings and facilities, reduce fuel consumption by fleet<br />
vehicles and equipment, reduce the amount <strong>of</strong> government-generated solid waste that is sent to a landfill, and<br />
increase the amount <strong>of</strong> energy that is obtained through alternative energy sources. By quantifying the emissions<br />
coming from government operations, this report will assist policymakers and stakeholders in addressing <strong>San</strong> <strong>Diego</strong><br />
<strong>County</strong>’s contribute to climate change.<br />
Local jurisdictions in California also have broad influence over activities in the community that generate<br />
greenhouse gas emissions, such as new construction, the operation <strong>of</strong> buildings and transportation, and solid waste<br />
disposal. That influence may be exercised directly through the jurisdiction’s authority over local land use planning<br />
and building standards, and indirectly through programs that encourage sustainable behavior among local residents<br />
and businesses. The community inventory provides a starting point for addressing how the <strong>County</strong> can impact<br />
emissions within its jurisdictional boundaries.<br />
1.1 Climate Change Background and Potential Impacts<br />
In the phenomenon known as the greenhouse effect, naturally-occurring atmospheric gases help regulate global<br />
climate by trapping solar radiation within the Earth’s atmosphere. Overwhelming evidence suggests that modern<br />
human activity is artificially intensifying the greenhouse effect, causing global average surface temperatures to rise.<br />
<strong>2005</strong>/<strong>2006</strong> <strong>San</strong> <strong>Diego</strong> <strong>County</strong> <strong>Greenhouse</strong> <strong>Gas</strong> <strong>Emissions</strong> <strong>Inventory</strong> 3
This intensification is caused by activities that release carbon dioxide and other greenhouse gases into the<br />
atmosphere—most notably the burning <strong>of</strong> fossil fuels for transportation, electricity, and heating.<br />
Rising temperatures affect local and global climate patterns, and these changes are forecasted to manifest<br />
themselves in a number <strong>of</strong> ways that may impact the <strong>San</strong> <strong>Diego</strong> region. In 2008, a vulnerability assessment entitled<br />
the <strong>San</strong> <strong>Diego</strong> Regional Focus 2050 Study (Focus 2050) was prepared by the Scripps Institution <strong>of</strong> Oceanography,<br />
SAIC, and the Environmental and Sustainability Initiative at University <strong>of</strong> California, <strong>San</strong> <strong>Diego</strong>, and was published<br />
by the <strong>San</strong> <strong>Diego</strong> Foundation. Focus 2050 explored what the <strong>San</strong> <strong>Diego</strong> Region may look like in 2050 if current<br />
climate trends continue. Potential impacts were forecasted by scientists at the Scripps Institute <strong>of</strong> Oceanography<br />
using three Intergovernmental Panel on Climate Change (IPCC) climate models and two emissions scenarios.<br />
The models predicted warming in <strong>San</strong> <strong>Diego</strong> <strong>County</strong> <strong>of</strong> between 1.5°F and 4.5°F by 2050. Rising temperatures,<br />
along with a growing population, will likely create a variety <strong>of</strong> challenges for the <strong>San</strong> <strong>Diego</strong> Region. For example,<br />
Focus 2050 determined that heat waves are likely to increase in frequency, magnitude, and duration, thereby<br />
increasing energy demand and bringing about public health threats in the process. Extended drought conditions were<br />
forecasted to lead to longer fire seasons and an increased likelihood <strong>of</strong> large wildfires. The study indicated that<br />
warmer temperatures also increase the formation <strong>of</strong> ground level ozone and may heighten exposure levels to vector<br />
born diseases, such as West Nile Virus.<br />
Focus 2050 also examined how climate change will impact water supply and water quality. The study found that<br />
shortfalls in water supply will likely occur as warmer temperatures cause significant declines in Colorado River<br />
flow and Sierra Nevada snowpack, the region’s two main sources <strong>of</strong> imported water. Additionally, sea level rise<br />
along with an increased incidence <strong>of</strong> extreme high sea level events will lead to coastal erosion and will damage<br />
critical habitat, real estate, and infrastructure. These projected impacts will also put additional stress on the region’s<br />
threatened and vulnerable ecosystems.<br />
In response to the climate change threat, many communities in the United States are taking responsibility for<br />
addressing climate change at the local level. Since many <strong>of</strong> the major sources <strong>of</strong> greenhouse gas emissions are<br />
directly or indirectly controlled through local policies, local governments have a strong role to play in reducing<br />
greenhouse gas emissions within their boundaries. Through proactive measures around sustainable land use<br />
patterns, transportation demand management, energy efficiency, green building, and waste diversion, local<br />
governments can dramatically reduce emissions in their communities. In addition, local governments are primarily<br />
responsible for the provision <strong>of</strong> emergency services and the mitigation <strong>of</strong> natural disaster impacts. As the effects <strong>of</strong><br />
climate change become more common and severe, local government adaptation policies will be fundamental in<br />
preserving the welfare <strong>of</strong> residents and businesses.<br />
<strong>2005</strong>/<strong>2006</strong> <strong>San</strong> <strong>Diego</strong> <strong>County</strong> <strong>Greenhouse</strong> <strong>Gas</strong> <strong>Emissions</strong> <strong>Inventory</strong> 4
1.2 Purpose <strong>of</strong> <strong>Inventory</strong><br />
The objective <strong>of</strong> this greenhouse gas emissions inventory is to identify the sources and quantities <strong>of</strong> greenhouse gas<br />
emissions resulting from government operations and the community-at-large in the <strong>County</strong> <strong>of</strong> <strong>San</strong> <strong>Diego</strong>. This<br />
inventory is a necessary first step in addressing greenhouse gas emissions, serving two purposes:<br />
• It creates an emissions baseline against which the <strong>County</strong> <strong>of</strong> <strong>San</strong> <strong>Diego</strong> can set emissions reductions<br />
targets and measure future progress.<br />
• It allows the <strong>County</strong> <strong>of</strong> <strong>San</strong> <strong>Diego</strong> to understand the scale <strong>of</strong> emissions’ various sources.<br />
While <strong>San</strong> <strong>Diego</strong> <strong>County</strong> has already begun to reduce greenhouse gas emissions through its actions (See Section 1.4<br />
for more detail), this inventory represents the first step in a systems approach to reducing the <strong>County</strong>’s emissions.<br />
This system, developed by ICLEI, is called the Five Milestones for Climate Mitigation. This Five-Milestone process<br />
involves the following steps:<br />
Milestone One: Conduct a baseline emissions inventory and forecast<br />
Milestone Two: Adopt an emissions reduction target for the forecast year<br />
Milestone Three: Develop a local climate action plan<br />
Milestone Four: Implement the climate action plan<br />
Milestone Five: Monitor progress and report results<br />
Figure 1.1 The Five-Milestone Process<br />
Leadership<br />
Commitment<br />
Milestone 1<br />
<strong>Inventory</strong><br />
<strong>Emissions</strong><br />
Milestone 2<br />
Establish Target<br />
Milestone 5<br />
Monitor/Evaluate<br />
Progress<br />
Milestone 3<br />
Develop Climate<br />
Action Plan<br />
Milestone 4<br />
Implement Climate<br />
Action Plan<br />
<strong>2005</strong>/<strong>2006</strong> <strong>San</strong> <strong>Diego</strong> <strong>County</strong> <strong>Greenhouse</strong> <strong>Gas</strong> <strong>Emissions</strong> <strong>Inventory</strong> 5
1.3 Climate Change Mitigation Activities in California<br />
Since <strong>2006</strong>, the State <strong>of</strong> California has responded to growing concerns over the effects <strong>of</strong> climate change by<br />
adopting a comprehensive approach to addressing emissions in the public and private sectors. This approach was<br />
<strong>of</strong>ficially initiated with the passage <strong>of</strong> the Global Warming Solutions Act <strong>of</strong> <strong>2006</strong> (AB 32), which requires the state<br />
to reduce its greenhouse gas emissions to 1990 levels by 2020. It also requires the California Air Resources Board<br />
(CARB) to develop a policy plan for reaching AB 32 emissions reduction goals and to adopt and enforce regulations<br />
to implement the plan.<br />
The resulting AB 32 Scoping Plan was adopted by CARB in December 2008. Among many other strategies, it<br />
encourages local governments to reduce emissions in their jurisdictions by a degree commensurate with state goals,<br />
approximately 15 percent below current levels. In addition, it identifies the following strategies that will impact<br />
local governance:<br />
• Develop a California cap-and-trade program<br />
• Expand energy efficiency programs<br />
• Establish and seek to achieve reduction targets for transportation-related GHG emissions<br />
• Expand the use <strong>of</strong> green building practices<br />
• Increase waste diversion, composting, and commercial recycling toward zero-waste<br />
• Continue water efficiency programs and use cleaner energy sources to move and treat water<br />
• Reduce methane emissions at landfills<br />
• Preserve forests that sequester carbon dioxide<br />
Other measures taken by the state include mandating stronger vehicle emissions standards (AB 1493, 2002),<br />
establishing a low-carbon fuel standard (EO # S-01-07, 2007), mandating a climate adaptation plan for the state (S-<br />
EO # 13-08, 2008), establishing a Green Collar Job Council, and establishing a renewable energy portfolio standard<br />
for power generation or purchase in the state. The state also has made a number <strong>of</strong> legislative and regulatory<br />
changes that have significant implications for local governments:<br />
• SB 97 (2007) requires the Office <strong>of</strong> Planning and Research to create greenhouse gas planning<br />
guidelines for the California Environmental Quality Act (CEQA). In addition, CARB is tasked with<br />
creating energy-use and transportation thresholds in CEQA reviews, which may require local<br />
governments to account for greenhouse gas emissions when reviewing project applications.<br />
• AB 811 (2007) authorizes all local governments in California to establish special districts that can be<br />
used to finance solar or other renewable energy improvements to homes and businesses in their<br />
jurisdiction.<br />
<strong>2005</strong>/<strong>2006</strong> <strong>San</strong> <strong>Diego</strong> <strong>County</strong> <strong>Greenhouse</strong> <strong>Gas</strong> <strong>Emissions</strong> <strong>Inventory</strong> 6
• SB 375 (2008) revises the process <strong>of</strong> regional transportation planning by metropolitan planning<br />
organizations (MPOs), which are governed by elected <strong>of</strong>ficials from local jurisdictions. The statute<br />
calls on CARB to establish regional transportation-related greenhouse gas targets and requires the<br />
MPO to develop a regional “Sustainable Communities Strategy” <strong>of</strong> land use, housing and<br />
transportation policies that will move the region towards its GHG target. The statute stipulates that<br />
transportation investments must be consistent with the Sustainable Communities Strategy and provides<br />
CEQA streamlining for local development projects that are consistent with the Strategy.<br />
1.4 Climate Change Mitigation Activities in the <strong>County</strong> <strong>of</strong> <strong>San</strong> <strong>Diego</strong><br />
One <strong>of</strong> the first counties established in California since achieving statehood in 1850, <strong>San</strong> <strong>Diego</strong> <strong>County</strong> has long<br />
been a popular vacation and settlement destination, and its current population <strong>of</strong> three million residents is projected<br />
to grow steadily in the coming decades. Although much <strong>of</strong> this growth will be centered in the incorporated cities<br />
within <strong>San</strong> <strong>Diego</strong> <strong>County</strong>, substantial growth will also be seen in the less dense, unincorporated areas. Moreover,<br />
the <strong>County</strong> is home to numerous endangered and protected species, essential agriculture, and a rural lifestyle, which<br />
are important characteristics to maintain. This, in conjunction with the existing State and Federal mandates for<br />
greenhouse gas emission reductions, has prompted the <strong>County</strong> <strong>of</strong> <strong>San</strong> <strong>Diego</strong> to begin addressing sustainable,<br />
planned growth proactively. In the recently updated General Plan, <strong>San</strong> <strong>Diego</strong> <strong>County</strong> has integrated mitigation and<br />
adaptation strategies into nearly every element in its Plan. One <strong>of</strong> the <strong>County</strong>’s ten Guiding Principles is to<br />
“maintain environmentally sustainable communities and reduce greenhouse gas emissions that contribute to climate<br />
change,” through both mitigation and adaptation strategies. A few examples <strong>of</strong> these strategies include:<br />
• Developing “complete” neighborhoods, with pedestrian-friendly commercial centers<br />
• Increasing usage <strong>of</strong> public transit options, through incentives and increased park and ride facilities<br />
• Continuing green building efforts, in new construction and retr<strong>of</strong>itting existing facilities<br />
• Maintaining open spaces for continued sequestration benefits<br />
• Preparing a climate action plan to specifically address strategies<br />
The objective <strong>of</strong> these strategies, and many other strategies outlined in the <strong>County</strong> <strong>of</strong> <strong>San</strong> <strong>Diego</strong>’s General Plan, is<br />
to ensure that this area continues to be a viable, welcoming, and sustainable area for its residents and visitors.<br />
1.5 The <strong>San</strong> <strong>Diego</strong> Regional Climate Protection Initiative<br />
The <strong>San</strong> <strong>Diego</strong> Regional Climate Protection Initiative is a joint effort between The <strong>San</strong> <strong>Diego</strong> Foundation, ICLEI,<br />
and ten local governments in <strong>San</strong> <strong>Diego</strong> <strong>County</strong>. The Initiative was established in 2009 to provide a regional<br />
platform for local governments to follow ICLEI’s Five-Milestone process (described in Section 1.2).<br />
<strong>2005</strong>/<strong>2006</strong> <strong>San</strong> <strong>Diego</strong> <strong>County</strong> <strong>Greenhouse</strong> <strong>Gas</strong> <strong>Emissions</strong> <strong>Inventory</strong> 7
Through generous support from the <strong>San</strong> <strong>Diego</strong> Foundation, ICLEI is working directly with local governments in the<br />
<strong>San</strong> <strong>Diego</strong> region to quantify greenhouse gas emissions and drive regional activity to reduce emissions and enhance<br />
resiliency to a changing climate. In addition to performing greenhouse gas inventories for each local jurisdiction,<br />
ICLEI is providing ongoing training and technical assistance to participating agencies. The Initiative also includes<br />
the initiation and facilitation <strong>of</strong> a formal regional network <strong>of</strong> local governments and key stakeholders focused on<br />
climate protection initiatives, including both mitigation and adaptation activities. The Network mirrors similar<br />
networks across the country that ICLEI supports to engage local governments in information and resource<br />
exchange, best practices and lessons learned, as well as collaboration opportunities.<br />
<strong>2005</strong>/<strong>2006</strong> <strong>San</strong> <strong>Diego</strong> <strong>County</strong> <strong>Greenhouse</strong> <strong>Gas</strong> <strong>Emissions</strong> <strong>Inventory</strong> 8
Section Two: Methodology<br />
<strong>2005</strong>/<strong>2006</strong> <strong>San</strong> <strong>Diego</strong> <strong>County</strong> <strong>Greenhouse</strong> <strong>Gas</strong> <strong>Emissions</strong> <strong>Inventory</strong> 9
Methodology<br />
The inventories in this report follow two standards, one for government operations emissions and one for<br />
community emissions. As local governments all over the world continue to join the climate protection movement,<br />
the need for common conventions and a standardized approach to quantifying greenhouse gas (GHG) emissions is<br />
more pressing than ever.<br />
The government operations component <strong>of</strong> the greenhouse gas emissions inventory follows the standard<br />
methodology outlined in the Local Government Operations Protocol (LGOP), which was adopted in 2008 by CARB<br />
and serves as the national standard for quantifying and reporting greenhouse emissions from local government<br />
operations. By participating in the <strong>San</strong> <strong>Diego</strong> Regional Climate Protection Initiative, the <strong>County</strong> <strong>of</strong> <strong>San</strong> <strong>Diego</strong> has<br />
become one <strong>of</strong> the first in the nation to follow LGOP when inventorying emissions from government operations.<br />
The community emissions inventory follows the standard outlined in the draft International Local Government<br />
GHG <strong>Emissions</strong> Analysis Protocol (IEAP). ICLEI has been developing this guidance since the inception <strong>of</strong> its<br />
Cities for Climate Protection Campaign in 1993, and has recently formalized version 1 <strong>of</strong> the IEAP as a means to<br />
set a common framework for all local government worldwide. The community inventory also draws on the<br />
methodology developed in the <strong>San</strong> <strong>Diego</strong> <strong>County</strong> <strong>Greenhouse</strong> <strong>Gas</strong> <strong>Inventory</strong> developed by the Energy Policy<br />
Initiatives Center (EPIC) at the University <strong>of</strong> <strong>San</strong> <strong>Diego</strong> in September 2008.<br />
This chapter outlines the basic methodology utilized in the development <strong>of</strong> this inventory to provide clarity on how<br />
the inventory results were reported. Specifically, this section reviews:<br />
• What greenhouse gases were measured in this inventory<br />
• What general methods were used to estimate emissions<br />
• How emissions estimates can be reported (the scopes framework, roll-up numbers)<br />
• How emissions estimates were reported in this inventory<br />
A more detailed account <strong>of</strong> the protocols and methodology used in this inventory can be found in Appendices A-D.<br />
<strong>2005</strong>/<strong>2006</strong> <strong>San</strong> <strong>Diego</strong> <strong>County</strong> <strong>Greenhouse</strong> <strong>Gas</strong> <strong>Emissions</strong> <strong>Inventory</strong> 10
2.1 <strong>Greenhouse</strong> <strong>Gas</strong>es<br />
According to both the LGOP and the IEAP, local governments should assess emissions <strong>of</strong> all six internationally<br />
recognized greenhouse gases regulated under the Kyoto Protocol. These gases are outlined in Table 2.1, which<br />
includes the sources <strong>of</strong> these gases and their global warming potential (GWP). 5 This report focuses on the four<br />
GHGs most relevant to local government policymaking: CO 2, CH 4, N 2 O, and hydr<strong>of</strong>luorocarbons. These gases<br />
comprise a large majority <strong>of</strong> greenhouse gas emissions at the community level, and are the only gases emitted in<br />
<strong>San</strong> <strong>Diego</strong> <strong>County</strong>’s government operations. The omitted gases, SF 6 and perfluorocarbons, are emitted primarily in<br />
private sector manufacturing and electricity transmission, and are the subject <strong>of</strong> regulation at the state level.<br />
Table 2.1 <strong>Greenhouse</strong> <strong>Gas</strong>es<br />
<strong>Gas</strong><br />
Chemical<br />
Formula <strong>Emissions</strong>-generating Activity<br />
Global Warming<br />
Potential (CO 2 e)<br />
Carbon Dioxide CO 2 Combustion 1<br />
Methane CH 4 Waste (Landfills, Wastewater), Fuel Handling 21<br />
Combustion, Anaerobic Decomposition <strong>of</strong> Organic<br />
Nitrous Oxide N 2 O Combustion, Wastewater Treatment 310<br />
Hydr<strong>of</strong>luorocarbons Various Leaked Refrigerants, Fire Suppressants 12–11,700<br />
Perfluorocarbons Various<br />
Aluminum Production, Semiconductor Manufacturing,<br />
HVAC Equipment Manufacturing 6,500–9,200<br />
Sulfur Hexafluoride SF 6 Transmission and Distribution <strong>of</strong> Power 23,900<br />
2.2 Calculating <strong>Emissions</strong><br />
The majority <strong>of</strong> the emissions recorded in this inventory have been calculated using calculation-based<br />
methodologies to derive emissions using activity data and emission factors. To estimate emissions accordingly, the<br />
basic equation below is used:<br />
Activity Data x Emission Factor = <strong>Emissions</strong><br />
Activity Data<br />
Activity data refer to the relevant measurement <strong>of</strong> energy use or other greenhouse gas-generating processes such as<br />
fuel consumption by fuel type, metered annual electricity consumption, and annual vehicle miles traveled. Please<br />
see the appendices for detailed listing <strong>of</strong> the activity data used in composing this inventory.<br />
5 Global warming potential (GWP) is a measure <strong>of</strong> the amount <strong>of</strong> warming a greenhouse gas may cause, measured against the<br />
amount <strong>of</strong> warming caused by carbon dioxide.<br />
<strong>2005</strong>/<strong>2006</strong> <strong>San</strong> <strong>Diego</strong> <strong>County</strong> <strong>Greenhouse</strong> <strong>Gas</strong> <strong>Emissions</strong> <strong>Inventory</strong> 11
Emission Factors<br />
Emission factors are used to convert energy usage or other activity data into associated emissions quantities. They<br />
are usually expressed in terms <strong>of</strong> emissions per unit <strong>of</strong> activity data (e.g. lbs CO 2 /kWh). Please see Appendix B for a<br />
listing <strong>of</strong> emissions factors used in this report. Table 2.2 demonstrates an example <strong>of</strong> common emission calculations<br />
that use this formula.<br />
Table 2.2 Basic <strong>Emissions</strong> Calculations<br />
Activity Data <strong>Emissions</strong> Factor <strong>Emissions</strong><br />
Electricity Consumption (kilowatt hours) CO 2 emitted/kWh CO 2 emitted<br />
Natural <strong>Gas</strong> Consumption (therms) CO 2 emitted/therm CO 2 emitted<br />
<strong>Gas</strong>oline/Diesel Consumption (gallons) CO 2 emitted/gallon CO 2 emitted<br />
Waste Generated by Government Operations (tons) CH 4 emitted/ton <strong>of</strong> waste CH 4 emitted<br />
2.3 Reporting <strong>Emissions</strong><br />
LGOP provides two reporting frameworks: reporting by scope and reporting by sector. This section defines the two<br />
reporting frameworks and discusses how they are used in this inventory. It also discusses the concept <strong>of</strong> “rolling up”<br />
emissions into a single number. The section provides guidance on communicating the results <strong>of</strong> the inventory and<br />
using the inventory to formulate emissions reductions policies.<br />
2.3.1 The Scopes Framework<br />
For government operations and community inventories, emissions sources can be categorized by “scope” according<br />
to the entity’s degree <strong>of</strong> control over the emissions source and the location <strong>of</strong> the source. <strong>Emissions</strong> sources are<br />
categorized as direct (Scope 1) or indirect (Scope 2 or Scope 3), in accordance with the World Resources Institute<br />
and the World Business Council for Sustainable Development’s <strong>Greenhouse</strong> <strong>Gas</strong> Protocol Corporate Standard. The<br />
standard is to report emissions by scope as a primary reporting framework. 6<br />
Government Operations Scope Definitions<br />
Similar to the community framework, the government operations scopes are divided into three main categories:<br />
Scope 1: Direct emissions from sources within a local government’s operations that it owns and/or controls. This<br />
includes stationary combustion to produce electricity, steam, heat, and power equipment; mobile combustion <strong>of</strong><br />
fuels; process emissions from physical or chemical processing; fugitive emissions that result from production,<br />
processing, transmission, storage and use <strong>of</strong> fuels; leaked refrigerants; and other sources.<br />
6 Another common reporting framework is emissions by sector: See Section 2.3.3-Emisisons Sectors for details<br />
<strong>2005</strong>/<strong>2006</strong> <strong>San</strong> <strong>Diego</strong> <strong>County</strong> <strong>Greenhouse</strong> <strong>Gas</strong> <strong>Emissions</strong> <strong>Inventory</strong> 12
Scope 2: Indirect emissions associated with the consumption <strong>of</strong> electricity, steam, heating, or cooling, that are<br />
purchased from an outside utility.<br />
Scope 3: All other emissions sources that hold policy relevance to the local government that can be measured and<br />
reported. This includes all indirect emissions not covered in Scope 2 that occur as a result <strong>of</strong> activities within the<br />
operations <strong>of</strong> the local government. Scope 3 emission sources include (but are not limited to) tailpipe emissions<br />
from employee commutes, employee business travel, and emissions resulting from the decomposition <strong>of</strong><br />
government-generated solid waste.<br />
Figure 2.1 <strong>Emissions</strong> Scopes<br />
Source: WRI/WBCSD GHG Protocol Corporate Accounting and Reporting Standard (Revised Edition),<br />
Chapter 4.<br />
Community Scope Definitions<br />
The scopes framework includes three emissions scopes for community emissions:<br />
Scope 1: All direct emissions from sources located within the jurisdictional boundaries <strong>of</strong> the local government,<br />
including fuel combusted in the community and direct emissions from landfills in the community.<br />
Scope 2: Indirect emissions associated with the consumption <strong>of</strong> energy that is generated outside the jurisdictional<br />
boundaries <strong>of</strong> the local government.<br />
<strong>2005</strong>/<strong>2006</strong> <strong>San</strong> <strong>Diego</strong> <strong>County</strong> <strong>Greenhouse</strong> <strong>Gas</strong> <strong>Emissions</strong> <strong>Inventory</strong> 13
Scope 3: All other indirect or embodied emissions not covered in Scope 2, that occur as a result <strong>of</strong> activity within<br />
the jurisdictional boundaries.<br />
Scope 1 and Scope 2 sources are the most essential components <strong>of</strong> a community greenhouse gas analysis. This is<br />
because these sources are typically the most significant in scale, and are most easily impacted by local policy<br />
making. The IEAP also includes, in its Global Reporting Standard, the reporting <strong>of</strong> Scope 3 emissions associated<br />
with the future decomposition <strong>of</strong> solid waste generated in the community in the base year.<br />
2.3.2 Double Counting and Rolling Up Scopes<br />
Many local governments find it useful for public awareness and policymaking to use a single number (a “roll-up”<br />
number) to represent emissions in its reports, target setting, and action plans. A roll-up number allows local<br />
governments to determine the relative proportions <strong>of</strong> emissions from various sectors (e.g., 30 percent <strong>of</strong> rolled up<br />
emissions came from the vehicle fleet), which can help policymakers and staff identify priority actions for reducing<br />
emissions from their operations.<br />
For these reasons, this report includes roll-up numbers as the basis <strong>of</strong> the both the government operations and<br />
community emissions analyses in this inventory. This roll-up number is composed <strong>of</strong> direct emissions (Scope 1), all<br />
emissions from purchased electricity (Scope 2), and other indirect emissions (Scope 3).<br />
While this report uses a standard roll-up number, these numbers should be used with caution, as they can be<br />
problematic for three reasons:<br />
First, a roll-up number does not represent all emissions from the <strong>County</strong>’s operations, only a summation <strong>of</strong><br />
inventoried emissions using available estimation methods. Reporting a roll-up number can be misleading and<br />
encourage citizens, staff, and policymakers to think <strong>of</strong> this number as the local government’s “total” emissions.<br />
Therefore, when communicating a roll-up number it is important to represent it only as a sum <strong>of</strong> inventoried<br />
emissions, not as a comprehensive total.<br />
Second, rolling up emissions may not simply involve adding emissions from all sectors, as emissions from different<br />
scopes can be double-counted when they are reported as one number. For example, if a local government operates a<br />
municipal utility that provides electricity to government facilities, these are emissions from both the power<br />
generation and facilities sectors. If these sectors are rolled up into a single number, these emissions are double<br />
counted, or reported twice. For these reasons, it is important to be cautious when creating a roll-up number to avoid<br />
double counting; the roll-up number used in this report was created specifically to avoid any possible double<br />
counting.<br />
<strong>2005</strong>/<strong>2006</strong> <strong>San</strong> <strong>Diego</strong> <strong>County</strong> <strong>Greenhouse</strong> <strong>Gas</strong> <strong>Emissions</strong> <strong>Inventory</strong> 14
Third, it is very difficult to use a roll-up number as a common measure between local governments, which is how<br />
the results are sometimes applied. Currently, there is no national or international standard for reporting emissions as<br />
a single roll-up number. In addition, local governments provide different services to their citizens, and the scale <strong>of</strong><br />
the services (and thus the emissions) is highly dependent upon the size <strong>of</strong> the jurisdiction. For these reasons,<br />
comparisons between local government roll-up numbers should not be made without significant analysis <strong>of</strong> the basis<br />
<strong>of</strong> the roll-up number and the services provided by the local governments being compared.<br />
2.3.3 <strong>Emissions</strong> Sectors<br />
In addition to categorizing emissions by scope, ICLEI recommends that local governments examine their emissions<br />
in the context <strong>of</strong> the sector that is responsible for those emissions. Many local governments will find a sector-based<br />
analysis more directly relevant to policy making and project management, as it assists in formulating sector-specific<br />
reduction measures and climate action plan components. The government operations inventory uses LGOP sectors<br />
as a primary reporting framework, including the following sectors:<br />
• Buildings and facilities<br />
• Streetlights, traffic signals, and other public lighting<br />
• Water delivery facilities<br />
• Wastewater facilities<br />
• Solid waste facilities<br />
• Vehicle fleet, and mobile equipment<br />
• Government-generated solid waste<br />
The community inventory reports emissions by the following sectors:<br />
• Residential. This sector includes Scope 1 natural gas combustion and Scope 2 electricity<br />
consumption.<br />
• Commercial/Industrial. This sector includes Scope 1 fuel combustion and Scope 2 electricity<br />
consumption.<br />
• Transportation. The transportation sector includes exclusively Scope 1 transportation fuel<br />
combustion.<br />
• Solid Waste. The sector includes Scope 1 emissions from landfills located in the jurisdiction and<br />
Scope 3 emissions from future decomposition <strong>of</strong> solid waste generated in the community in the<br />
base year.<br />
• Wastewater. This sector includes emissions from wastewater generated in the community in the<br />
base year.<br />
<strong>2005</strong>/<strong>2006</strong> <strong>San</strong> <strong>Diego</strong> <strong>County</strong> <strong>Greenhouse</strong> <strong>Gas</strong> <strong>Emissions</strong> <strong>Inventory</strong> 15
<strong>2005</strong>/<strong>2006</strong> <strong>San</strong> <strong>Diego</strong> <strong>County</strong> <strong>Greenhouse</strong> <strong>Gas</strong> <strong>Emissions</strong> <strong>Inventory</strong> 16
Government<br />
Operations<br />
<strong>Inventory</strong> Results<br />
This chapter provides a detailed description <strong>of</strong> <strong>San</strong> <strong>Diego</strong> <strong>County</strong>’s greenhouse gas emissions from government<br />
operations in <strong>2006</strong>, rolling up and comparing emissions across sectors and sources as appropriate. This chapter also<br />
provides details on emissions from each sector, including a breakdown <strong>of</strong> emissions types and, where possible, an<br />
analysis <strong>of</strong> emissions by department. This information identifies more specific sources <strong>of</strong> emissions (such as a<br />
particular building) that can help staff and policymakers in the <strong>County</strong> to best target emissions reduction activities<br />
in the future.<br />
For a report <strong>of</strong> emissions by scope, and a detailed description <strong>of</strong> the methodology and emission factors used in<br />
calculating the emissions from the <strong>County</strong>’s operations, please see Appendix B: LGOP Standard Report.<br />
In <strong>2006</strong>, <strong>San</strong> <strong>Diego</strong> <strong>County</strong>’s government operations greenhouse gas emissions totaled 151,237 metric tons <strong>of</strong><br />
CO 2 e. 7 In this report, this number is the basis for comparing emissions across sectors and sources (fuel types), and is<br />
the aggregate <strong>of</strong> all emissions estimates used in this inventory.<br />
3.1 Summary by Sector<br />
Reporting emissions by sector provides a useful way to understand the sources <strong>of</strong> <strong>San</strong> <strong>Diego</strong> <strong>County</strong>’s emissions.<br />
By better understanding the relative scale <strong>of</strong> emissions from each <strong>of</strong> the sectors, the <strong>County</strong> <strong>of</strong> <strong>San</strong> <strong>Diego</strong> can more<br />
effectively focus emissions reductions strategies to achieve the greatest emissions reductions. 8<br />
7 This number represents a roll-up <strong>of</strong> emissions, and is not intended to represent a complete picture <strong>of</strong> emissions from the <strong>County</strong>’s<br />
operations. This roll-up number should not be used for comparison with other local government roll-up numbers without a detailed analysis <strong>of</strong><br />
the basis for this total. See section 2.3.2 for more detail.<br />
8 The sectors with the largest scale <strong>of</strong> emissions do not necessarily represent the best opportunity for emissions reductions. Cost,<br />
administration, and other concerns may affect the <strong>County</strong>’s ability to reduce emissions from any one sector.<br />
<strong>2005</strong>/<strong>2006</strong> <strong>San</strong> <strong>Diego</strong> <strong>County</strong> <strong>Greenhouse</strong> <strong>Gas</strong> <strong>Emissions</strong> <strong>Inventory</strong> 17
Figure 3.1 <strong>2006</strong> <strong>San</strong> <strong>Diego</strong> <strong>County</strong> Government Operations<br />
<strong>Emissions</strong> by Sector<br />
Solid Waste<br />
Facilities<br />
43%<br />
Buildings and<br />
Facilities<br />
36%<br />
Vehicle Fleet<br />
16%<br />
Water Transport<br />
Employee commuting is an important government operations sector that could not be incorporated in to this report<br />
due to restrictions on data. <strong>Emissions</strong> from employee commuting are scope 3 emissions generated when employees<br />
combust fossil fuels commuting to and from government facilities. Other local governments who were able to<br />
quantify employee commute emissions found that this sector is normally one <strong>of</strong> the largest emitting sectors,<br />
comprising between 20 and 30 percent <strong>of</strong> total emissions. While local governments do not directly control how<br />
employees commute, <strong>County</strong> policy can have a significant impact in encouraging employees to use alternate modes<br />
<strong>of</strong> transportation to commute.<br />
3.2 Summary by Source<br />
When considering how to reduce emissions, it is helpful to look not only at which sectors are generating emissions,<br />
but also at the specific raw resources and materials (gasoline, diesel, electricity, natural gas, solid waste, etc.) whose<br />
use and generation directly result in the release <strong>of</strong> greenhouse gases. This analysis can help target resource<br />
management in a way that will successfully reduce greenhouse gas emissions. Table 3.2 and Figure 3.2 provide a<br />
summary <strong>of</strong> <strong>San</strong> <strong>Diego</strong> <strong>County</strong>’s government operations <strong>2006</strong> greenhouse gas emissions by fuel type or material.<br />
Figure 3.2 <strong>2006</strong> <strong>San</strong> <strong>Diego</strong> <strong>County</strong> Government Operations<br />
<strong>Emissions</strong> by Source<br />
Solid Waste<br />
42%<br />
Electricity<br />
28%<br />
Refrigerants<br />
1%<br />
Government<br />
Generated Solid<br />
Waste<br />
1%<br />
Wastewater<br />
2%<br />
Diesel<br />
2%<br />
Natural <strong>Gas</strong><br />
10%<br />
<strong>Gas</strong>oline<br />
14%<br />
<strong>2005</strong>/<strong>2006</strong> <strong>San</strong> <strong>Diego</strong> <strong>County</strong> <strong>Greenhouse</strong> <strong>Gas</strong> <strong>Emissions</strong> <strong>Inventory</strong> 19
Table 3.2: <strong>2006</strong> <strong>San</strong> <strong>Diego</strong> <strong>County</strong><br />
Government Operations <strong>Emissions</strong> by Source<br />
Source<br />
<strong>Greenhouse</strong> <strong>Gas</strong> <strong>Emissions</strong><br />
(metric tons CO 2 e)<br />
Solid Waste 64,032<br />
Electricity 42,883<br />
<strong>Gas</strong>oline 20,437<br />
Natural <strong>Gas</strong> 15,498<br />
Diesel 2,731<br />
Wastewater 2,655<br />
Government Generated<br />
Solid Waste 2,132<br />
Refrigerants 870<br />
3.3 Summary <strong>of</strong> Energy-Related Costs<br />
In addition to tracking energy consumption and generating estimates on emissions per sector, ICLEI has calculated<br />
the basic energy costs <strong>of</strong> various government operations. During <strong>2006</strong>, <strong>San</strong> <strong>Diego</strong> <strong>County</strong> spent approximately<br />
$16.2 million on energy (e.g., electricity, natural gas, gasoline, and diesel) for its operations. Over half <strong>of</strong> these<br />
energy expenses ($9.2 million) are the result <strong>of</strong> electricity and natural gas purchases from SDG&E.<br />
The <strong>County</strong> spent approximately $7 million on gasoline and diesel for the municipal fleet (43 percent <strong>of</strong> total energy<br />
costs). Handling <strong>of</strong> <strong>San</strong> <strong>Diego</strong> <strong>County</strong>’s waste in <strong>2006</strong> had an estimated value <strong>of</strong> $472,816. Beyond reducing<br />
harmful greenhouse gases, any future reductions in energy use will have the potential to reduce these costs, enabling<br />
the <strong>County</strong> to reallocate limited funds toward other municipal services or create a revolving energy loan fund to<br />
support future climate protection activities.<br />
3.4 Detailed Sector Analyses<br />
3.4.1 Buildings and Other Facilities<br />
Through their use <strong>of</strong> energy for heating, cooling, lighting, and other purposes, buildings and other facilities operated<br />
by local governments constitute a significant amount <strong>of</strong> their greenhouse gas emissions. The <strong>County</strong> <strong>of</strong> <strong>San</strong> <strong>Diego</strong><br />
operates hundreds <strong>of</strong> facilities, including major facilities such as the East Mesa Detention Facility, sheriff’s stations,<br />
libraries, and numerous small facilities (e.g. parks, animal shelters). Facility operations contribute to greenhouse gas<br />
emissions in two major ways. First, facilities consume electricity and fuels such as natural gas, and this consumption<br />
contributes the majority <strong>of</strong> greenhouse gas emissions from facilities. Second, fire suppression, air conditioning, and<br />
<strong>2005</strong>/<strong>2006</strong> <strong>San</strong> <strong>Diego</strong> <strong>County</strong> <strong>Greenhouse</strong> <strong>Gas</strong> <strong>Emissions</strong> <strong>Inventory</strong> 20
efrigeration equipment in buildings can emit hydr<strong>of</strong>luorocarbons (HFCs) and other greenhouse gases when these<br />
systems leak refrigerants or fire suppressants.<br />
In <strong>2006</strong>, the operation <strong>of</strong> <strong>County</strong> facilities produced over 55,000 metric tons <strong>of</strong> CO 2 e from the above sources. Table<br />
3.3 shows estimated costs associated with the activities that generated these emissions, and Figure 3.3 depicts <strong>2006</strong><br />
emissions by major department. Total facility emissions by source are illustrated in Figure 3.4, they are,<br />
approximately 73 percent came from the consumption <strong>of</strong> electricity, 27 percent from natural gas consumption, and<br />
less than 1 percent came from leaked refrigerants (2 metric tons <strong>of</strong> CO 2 e). The <strong>County</strong> <strong>of</strong> <strong>San</strong> <strong>Diego</strong> spent $7.8<br />
million in <strong>2006</strong> on the fuels and electricity that were the cause <strong>of</strong> these emissions.<br />
Figure 3.3: <strong>Emissions</strong> from Major Facilities By Department<br />
20,000<br />
18,000<br />
16,000<br />
Metric Tons CO2e<br />
14,000<br />
12,000<br />
10,000<br />
8,000<br />
6,000<br />
4,000<br />
2,000<br />
0<br />
<strong>County</strong> Offices<br />
Detention Facilities<br />
HHSA<br />
Courts<br />
Other<br />
Sheriffs<br />
Libraries<br />
Parks<br />
<strong>2005</strong>/<strong>2006</strong> <strong>San</strong> <strong>Diego</strong> <strong>County</strong> <strong>Greenhouse</strong> <strong>Gas</strong> <strong>Emissions</strong> <strong>Inventory</strong> 21
Figure 3.4: <strong>Emissions</strong> from Facilities By Source<br />
Electricity<br />
73%<br />
Natural <strong>Gas</strong><br />
27%<br />
Refrigerants<br />
estimated electricity consumption and costs associated with the activities that generated these emissions. The<br />
<strong>County</strong> spent approximately $1.3 million in <strong>2006</strong> on the electricity that was the cause <strong>of</strong> these emissions.<br />
Table 3.4: Energy Use and <strong>Emissions</strong> from Public Lighting<br />
<strong>Greenhouse</strong> <strong>Gas</strong><br />
Source<br />
<strong>Emissions</strong><br />
(metric tons CO 2 e)<br />
Percent <strong>Emissions</strong><br />
<strong>of</strong> All Lighting<br />
Electricity Use<br />
(kWh) Cost<br />
Streetlights 1,741 81% 4,891,517 $1,133,645<br />
Traffic Signals/ Controllers 348 16% 978,277 $150,343<br />
Park and Other Outdoor Lighting 57 3% 160,375 $29,903<br />
TOTAL 2,147 100% 6,030,169 $1,313,891<br />
3.4.3 Water Transport<br />
This section addresses any equipment used for the distribution <strong>of</strong> water and stormwater. 9 Typical systems included<br />
in this section are water pumps/lifts, sprinklers, and other irrigation controls. 10 The <strong>County</strong> <strong>of</strong> <strong>San</strong> <strong>Diego</strong> operates a<br />
range <strong>of</strong> water transport equipment, including transport <strong>of</strong> wastewater to the <strong>County</strong>’s treatment facilities.<br />
In <strong>2006</strong>, the operation <strong>of</strong> the <strong>County</strong>’s water transport equipment produced approximately 78 metric tons <strong>of</strong> CO 2 e<br />
from the above sources. Table 3.6 depicts <strong>2006</strong> emissions per equipment type and shows estimated activities and<br />
costs associated with the operation <strong>of</strong> this equipment. The <strong>County</strong> <strong>of</strong> <strong>San</strong> <strong>Diego</strong> spent approximately $30,000 in<br />
<strong>2006</strong> on the electricity that was the cause <strong>of</strong> these emissions.<br />
Table 3.5: Energy Use and <strong>Emissions</strong> from Water Transport Equipment<br />
Source<br />
<strong>Greenhouse</strong> <strong>Gas</strong><br />
<strong>Emissions</strong> (metric<br />
tons CO 2 e)<br />
Percent <strong>Emissions</strong> <strong>of</strong><br />
Water Transport<br />
Equipment<br />
Electricity<br />
Use (kWh)<br />
Cost<br />
($)<br />
Water Pumps 75 96% 210,979 $29,079<br />
Irrigation / Sprinkler Systems 3 4% 9,002 $1,218<br />
TOTAL 78 100% 219,981 $30,297<br />
3.4.4 Wastewater Treatment Facilities<br />
Wastewater coming from homes and businesses is rich in organic matter and has a high concentration <strong>of</strong> nitrogen<br />
and carbon (along with other organic elements). As wastewater is collected, treated, and discharged, chemical<br />
processes can lead to the creation and emission <strong>of</strong> two greenhouse gases: methane and nitrous oxide. Local<br />
9 While equipment that transports water and stormwater may be managed separately in the <strong>County</strong>’s operations, the types <strong>of</strong> equipment are<br />
similar, and therefore the ways to reduce emissions from this equipment are similar. For this reason, this section groups equipment used for<br />
transporting water and wastewater.<br />
10 This section does not include emissions from decomposition or processing <strong>of</strong> wastewater in wastewater treatment facilities. These<br />
emissions are included in Section 3.4.4.<br />
<strong>2005</strong>/<strong>2006</strong> <strong>San</strong> <strong>Diego</strong> <strong>County</strong> <strong>Greenhouse</strong> <strong>Gas</strong> <strong>Emissions</strong> <strong>Inventory</strong> 23
governments that operate wastewater treatment facilities, including wastewater pumps, treatment plants, septic<br />
systems, collection lagoons, and other facilities, must therefore account for the emission <strong>of</strong> these gases in their<br />
overall greenhouse gas emissions inventory. 11<br />
Methane is generated under anaerobic conditions, which could occur at centralized facilities or septic tanks;<br />
however, many centralized treatment facilities are utilize aerobic processes, and in these cases methane is not a<br />
significant concern. Nitrous oxide is emitted at facilities that utilize nitrification and denitrification <strong>of</strong> wastewater.<br />
In <strong>2006</strong>, the <strong>County</strong> <strong>of</strong> <strong>San</strong> <strong>Diego</strong> operated eight wastewater treatment facilities, serving over 130,000 people,<br />
including the residents and businesses located in Julian, Spring Valley, Lakeside, Alpine, and other areas in the<br />
unincorporated region. Because these are aerobic facilities, nitrous oxide is the only greenhouse gas that must be<br />
accounted for. The operation <strong>of</strong> <strong>San</strong> <strong>Diego</strong> <strong>County</strong> wastewater treatment facilities produced nearly 2,673 metric<br />
tons <strong>of</strong> CO 2 e from nitrification/denitrification and from electricity consumed at the facilities.<br />
<strong>Gas</strong><br />
N 2 0<br />
Table 3.6: Wastewater Treatment <strong>Emissions</strong> by Type<br />
<strong>Greenhouse</strong> <strong>Gas</strong> <strong>Emissions</strong><br />
Source<br />
(metric tons CO 2 e)<br />
Treated Effluent Released<br />
to Environment 2,655<br />
CO 2 , CH 4 , N 2 0 Electricity Consumption 18<br />
TOTAL 2,673<br />
3.4.5 Solid Waste Facilities<br />
There are a variety <strong>of</strong> emissions associated with solid waste management services including the collection,<br />
processing, and storage <strong>of</strong> solid waste generated from residents and businesses. 12 The most prominent source <strong>of</strong><br />
emissions from solid waste facilities is methane released by the decomposition <strong>of</strong> organic waste over time in<br />
landfills. The scale <strong>of</strong> these emissions depends upon the size and type <strong>of</strong> the landfill and the presence <strong>of</strong> a landfill<br />
gas collection system.<br />
The <strong>County</strong> <strong>of</strong> <strong>San</strong> <strong>Diego</strong> had operational control <strong>of</strong> ten inactive landfills operated in <strong>2006</strong>, and no active landfills.<br />
Although inactive landfills are not accumulating additional waste, they continue to emit greenhouse gases. In <strong>2006</strong>,<br />
these landfills, which include <strong>San</strong> Marcos, Encinitas, Jamacha, and others, produced over 64,000 metric tons <strong>of</strong><br />
CO 2 e from the above sources (Table 3.8). Nearly 70 percent <strong>of</strong> these emissions came solely from the operation <strong>of</strong><br />
the <strong>San</strong> Marcos inactive landfill.<br />
11 These emissions should not be confused with those described in Section 3.4.3, which refer to the transportation <strong>of</strong> water and wastewater.<br />
This section refers exclusively to the decomposition and treatment <strong>of</strong> wastewater.<br />
12 The <strong>County</strong> operates a recycling facility; however, emissions are not included here. While it is likely that recycling processes result in the<br />
release <strong>of</strong> greenhouse gases, there are currently no accurate methods for estimating the amount <strong>of</strong> emissions from these activities. For this<br />
reason, process and fugitive emissions from recycling and composting facilities are not included in LGOP.<br />
<strong>2005</strong>/<strong>2006</strong> <strong>San</strong> <strong>Diego</strong> <strong>County</strong> <strong>Greenhouse</strong> <strong>Gas</strong> <strong>Emissions</strong> <strong>Inventory</strong> 24
<strong>Gas</strong><br />
CH 4<br />
Table 3.7: Solid Waste Facilities <strong>Emissions</strong> by Type<br />
<strong>Greenhouse</strong> <strong>Gas</strong> <strong>Emissions</strong><br />
Source<br />
(metric tons CO 2 e)<br />
CO 2 , CH 4 , N 2 0<br />
Decomposing Organic<br />
Waste 64,032<br />
Electricity<br />
Consumption 161<br />
TOTAL 64,192<br />
Figure 3.5: <strong>Emissions</strong> By Landfill<br />
3.4.6 Vehicle Fleet and Mobile Equipment<br />
The majority <strong>of</strong> local governments use vehicles and other mobile equipment as an integral part <strong>of</strong> their daily<br />
operations—from maintenance trucks used for parks and recreation to police cruisers and fire trucks. These vehicles<br />
and equipment burn gasoline, diesel, and other fuels, which results in greenhouse gas emissions. In addition,<br />
<strong>2005</strong>/<strong>2006</strong> <strong>San</strong> <strong>Diego</strong> <strong>County</strong> <strong>Greenhouse</strong> <strong>Gas</strong> <strong>Emissions</strong> <strong>Inventory</strong> 25
vehicles with air conditioning or refrigeration equipment use refrigerants that can leak from the vehicle. <strong>Emissions</strong><br />
from vehicles and mobile equipment compose a significant portion <strong>of</strong> emissions within most local governments.<br />
In <strong>2006</strong>, the <strong>County</strong> <strong>of</strong> <strong>San</strong> <strong>Diego</strong> operated a vehicle fleet with nearly 3,000 vehicles, ranging from small passenger<br />
cars to street sweepers and major construction vehicles. The <strong>County</strong>’s vehicle fleet performed a number <strong>of</strong> essential<br />
services, from public safety and emergency response to transporting <strong>County</strong> inmates. In <strong>2006</strong>, 40 percent <strong>of</strong> the fleet<br />
was dedicated to the sheriff’s departments, while the Department <strong>of</strong> Public Works, the District Attorney’s Office<br />
and the Health and Human Services Department also contributed significantly to the <strong>County</strong>’s fleet.<br />
Table 3.8: Vehicle Fleet and Mobile Equipment <strong>Emissions</strong> by Department<br />
Department<br />
<strong>Greenhouse</strong> <strong>Gas</strong><br />
<strong>Emissions</strong> (metric<br />
tons CO 2 e)<br />
Percent <strong>of</strong> All<br />
Mobile<br />
<strong>Emissions</strong><br />
<strong>Gas</strong>oline<br />
Consumption<br />
(gal)<br />
Diesel<br />
Consumption<br />
(gal) Cost<br />
Sheriff 10,673 46% 1,033,931 116,903 $3,246,701<br />
DPW 2,400 10% 174,250 80,241 $723,947<br />
District Attorney 1,791 8% 197,480 147 $555,346<br />
Probation 1,500 6% 159,308 4,295 $460,195<br />
HHSA 1,248 5% 131,904 4,736 $384,478<br />
DPLU 992 4% 174,250 42,919 $296,980<br />
Parks & Rec. 884 4% 83,663 12,026 $270,208<br />
Other 3,681 16% 282,739 7,516 $1,134,429<br />
TOTAL* 23,168 100% 2,237,523 268,782 $7,072,284<br />
*<strong>Emissions</strong> from leaked refrigerants within the vehicle fleet are not included in this chart. These emissions totaled 868<br />
metric tons <strong>of</strong> CO 2 e.<br />
In <strong>2006</strong>, <strong>San</strong> <strong>Diego</strong> emitted approximately 23,000 metric tons <strong>of</strong> CO 2 e as a result <strong>of</strong> the combustion <strong>of</strong> fuels to<br />
power the <strong>County</strong>’s vehicle fleet. Table 3.9 shows estimated costs associated with the activities that generated these<br />
emissions, and Figure 3.7 depicts <strong>2006</strong> emissions per department. Vehicles in the sheriff’s departments were the<br />
largest emitters <strong>of</strong> greenhouse gases, representing nearly 50 percent <strong>of</strong> total vehicle fleet emissions. Of all mobile<br />
emissions calculated, 85 percent came from the consumption <strong>of</strong> gasoline, 11 percent came from the combustion <strong>of</strong><br />
diesel, and the remaining 4 percent came from leaked mobile refrigerants 13 . The <strong>County</strong> spent approximately $7<br />
million in <strong>2006</strong> on the fuels that were the cause <strong>of</strong> these emissions.<br />
Please refer to Figure 3.7 on the next page for an illustration <strong>of</strong> fleet emissions by department.<br />
13 The LGOP Alternative Method (Mobile Fugitive <strong>Emissions</strong>) was used to estimate emissions from leaked mobile refrigerants. This amount<br />
is likely a significant overestimate but in line with LGOP methods.<br />
<strong>2005</strong>/<strong>2006</strong> <strong>San</strong> <strong>Diego</strong> <strong>County</strong> <strong>Greenhouse</strong> <strong>Gas</strong> <strong>Emissions</strong> <strong>Inventory</strong> 26
Figure 3.6: <strong>Emissions</strong> from Mobile Sources<br />
12,000<br />
10,000<br />
8,000<br />
Metric Tons CO2e<br />
6,000<br />
4,000<br />
2,000<br />
0<br />
Sheriff<br />
DPW<br />
District Attorney<br />
Probation<br />
HHSA<br />
DPLU<br />
Parks & Rec.<br />
Other<br />
3.4.7 Government-Generated Solid Waste<br />
Many local government operations generate solid waste, much <strong>of</strong> which is eventually sent to a landfill. Typical<br />
sources <strong>of</strong> waste in local government operations include paper and food waste from <strong>of</strong>fices and facilities,<br />
construction waste from public works, and plant debris from parks departments. Organic materials in governmentgenerated<br />
solid waste (including paper, food scraps, plant debris, textiles, wood waste, etc.) generate methane as<br />
they decay in the anaerobic environment <strong>of</strong> a landfill. An estimated 75 percent <strong>of</strong> this methane is routinely captured<br />
via landfill gas collection systems; 14 however, a portion escapes into the atmosphere, contributing to the greenhouse<br />
14 This is a default methane collection rate per LGOP. This rate can vary from 0 to 99 percent based upon the presence and extent <strong>of</strong> a landfill<br />
gas collection system at the landfill/s where the waste is disposed. Most commonly, captured methane gas is flared into the atmosphere, which<br />
<strong>2005</strong>/<strong>2006</strong> <strong>San</strong> <strong>Diego</strong> <strong>County</strong> <strong>Greenhouse</strong> <strong>Gas</strong> <strong>Emissions</strong> <strong>Inventory</strong> 27
effect. As such, estimating emissions from waste generated by government operations is an important component <strong>of</strong><br />
a comprehensive emissions inventory. It is estimated that the waste disposed by government facilities in <strong>2006</strong> will<br />
cumulatively produce 102 metric tons <strong>of</strong> methane gas, or 2,132 metric tons CO 2 e.<br />
<strong>Inventory</strong>ing emissions from government-generated solid waste is considered optional by LGOP for two reasons.<br />
First, the emissions do not result at the point <strong>of</strong> waste generation (as with fuel combustion), but in a landfill located<br />
outside <strong>of</strong> the <strong>County</strong>’s jurisdictional boundaries. In addition, the emissions are not generated in the same year that<br />
the waste is disposed, but over a lengthy decomposition period. Since inventorying these emissions is considered<br />
optional, LGOP does not provide guidance on recommended methods for quantifying these types <strong>of</strong> emissions.<br />
ICLEI therefore devised data collection and calculation methods based upon previous experience and national<br />
standards. See Appendix C for more information for more detail on quantifying emissions from governmentgenerated<br />
solid waste.<br />
converts the methane gas to CO 2 and effectively negates the human-caused global warming impact <strong>of</strong> the methane. Increasingly, landfill<br />
methane is being used to power gas-fired turbines as a carbon-neutral means <strong>of</strong> generating electricity.<br />
<strong>2005</strong>/<strong>2006</strong> <strong>San</strong> <strong>Diego</strong> <strong>County</strong> <strong>Greenhouse</strong> <strong>Gas</strong> <strong>Emissions</strong> <strong>Inventory</strong> 28
4.1 Community <strong>Inventory</strong> Summary<br />
<strong>2005</strong>/<strong>2006</strong> <strong>San</strong> <strong>Diego</strong> <strong>County</strong> <strong>Greenhouse</strong> <strong>Gas</strong> <strong>Emissions</strong> <strong>Inventory</strong> 29
Community<br />
<strong>Inventory</strong><br />
Results<br />
4.1 Community <strong>Inventory</strong> Summary<br />
In <strong>2005</strong>, activities and operations taking place within the jurisdictional boundaries <strong>of</strong> unincorporated <strong>San</strong> <strong>Diego</strong><br />
<strong>County</strong> resulted in approximately 4,197,665 metric tons <strong>of</strong> CO 2 e. This number includes all Scope 1 emissions from<br />
the on-site combustion <strong>of</strong> fuels in the residential and commercial / industrial sectors, from the combustion <strong>of</strong><br />
gasoline and diesel in vehicles traveling on local roads and state highways, and any methane released from any<br />
landfills within unincorporated <strong>San</strong> <strong>Diego</strong> <strong>County</strong>. This number also includes all Scope 2 emissions associated with<br />
community electricity consumption, and Scope 3 emissions from waste generated by the unincorporated<br />
community. 15<br />
Table 4.1: Community <strong>Emissions</strong> Summary<br />
by Scope in Metric Tons<br />
Activity<br />
Source emissions<br />
(metric tons CO 2 e)<br />
Total emissions<br />
(metric tons CO 2 e)<br />
Scope 1 3,381,615<br />
Transportation Fuels 2,909,342<br />
Natural <strong>Gas</strong> 453,211<br />
Landfill Waste-in-Place 19,062<br />
Scope 2 668,439<br />
Purchased Electricity 668,439<br />
Scope 3 147,611<br />
Community-generated<br />
Solid Waste 125,803<br />
Community-generated<br />
Wastewater 21,808<br />
15 For a detailed description <strong>of</strong> scopes, please see Section 2: Methodology<br />
<strong>2005</strong>/<strong>2006</strong> <strong>San</strong> <strong>Diego</strong> <strong>County</strong> <strong>Greenhouse</strong> <strong>Gas</strong> <strong>Emissions</strong> <strong>Inventory</strong> 30
4.1.1 Summary by Scope<br />
As shown in Table 4.1, Scope 1 sources produced the largest amount <strong>of</strong> community greenhouse gas emissions in<br />
<strong>2005</strong>, totaling 3,381,615 metric tons <strong>of</strong> CO 2 e. As seen in Figure 4.1, the largest share (86 percent) <strong>of</strong> Scope 1<br />
emissions resulted from mobile combustion <strong>of</strong> fuels. The second largest source <strong>of</strong> Scope 1 emissions was stationary<br />
combustion <strong>of</strong> natural gas, constituting 13 percent <strong>of</strong> Scope 1 emissions. Scope 2 emissions constituted the second<br />
largest amount (668,439 metric tons <strong>of</strong> CO 2 e), and Scope 3 emissions totaled 147,611 metric tons <strong>of</strong> CO 2 e. 16<br />
Figure 4.1 Community Scope 1 <strong>Emissions</strong><br />
Transportatio<br />
n Fuels<br />
86%<br />
Landfill Wastein-Place<br />
0.4%<br />
Natural <strong>Gas</strong><br />
13%<br />
4.1.2 Summary by Sector<br />
By better understanding the relative scale <strong>of</strong> emissions from each primary sector, <strong>San</strong> <strong>Diego</strong> <strong>County</strong> can more<br />
effectively focus emissions reductions strategies to achieve the greatest emission reductions. For this reason, an<br />
analysis <strong>of</strong> emissions by sector is included in this report. The five sectors included in this inventory are residential,<br />
commercial / industrial, transportation, solid waste, and wastewater.<br />
As shown in Figure 4.2, the transportation sector was the largest emitter (69 percent) in <strong>2005</strong>. <strong>Emissions</strong> from the<br />
commercial / industrial sector produced the second highest quantity, resulting in 15 percent <strong>of</strong> total emissions. The<br />
16 These emissions have not been totaled as this may result in double counting and a percentage is not significantly relevant to<br />
forming emissions reduction policy. The summaries by sector and source have percentage breakdowns, as do individual<br />
sources <strong>of</strong> emissions.<br />
<strong>2005</strong>/<strong>2006</strong> <strong>San</strong> <strong>Diego</strong> <strong>County</strong> <strong>Greenhouse</strong> <strong>Gas</strong> <strong>Emissions</strong> <strong>Inventory</strong> 31
emainder <strong>of</strong> emissions came from the residential sector (12 percent) solid waste (three percent), and wastewater<br />
(one percent).<br />
Table 4.2: Community <strong>Emissions</strong> Summary by Sector<br />
<strong>Greenhouse</strong> <strong>Gas</strong> <strong>Emissions</strong><br />
Sector<br />
(metric tons CO 2 e)<br />
Transportation 2,909,342<br />
Commercial / Industrial 615,687<br />
Residential 505,963<br />
Solid Waste 144,865<br />
Wastewater 21,808<br />
TOTAL 4,197,665<br />
Figure 4.2 Community <strong>Emissions</strong> Summary by Sector<br />
Solid Waste<br />
3%<br />
Wastewater<br />
1% Residential<br />
12%<br />
Commercial /<br />
Industrial<br />
15%<br />
Transportation<br />
69%<br />
4.1.3 Summary by Source<br />
When considering how to reduce emissions, it is also helpful to look not only at which sectors are generating<br />
emissions, but also at the specific raw resources and materials (gasoline, diesel, electricity, natural gas, solid waste,<br />
etc.) whose use and generation directly result in the release <strong>of</strong> greenhouse gases. Such analysis can help target<br />
resource management in a way that will successfully reduce greenhouse gas emissions. Below (Figure 4.3 and Table<br />
4.3) is a summary <strong>of</strong> <strong>San</strong> <strong>Diego</strong> <strong>County</strong>‘s <strong>2005</strong> greenhouse gas emissions by fuel type or material.<br />
<strong>2005</strong>/<strong>2006</strong> <strong>San</strong> <strong>Diego</strong> <strong>County</strong> <strong>Greenhouse</strong> <strong>Gas</strong> <strong>Emissions</strong> <strong>Inventory</strong> 32
Figure 4.3 Community <strong>Emissions</strong> Summary by Source<br />
<strong>Gas</strong>oline<br />
58%<br />
Electricity<br />
16%<br />
Compressed<br />
Natural <strong>Gas</strong><br />
1%<<br />
Wastewater<br />
1%<br />
Solid Waste<br />
3%<br />
Diesel<br />
11%<br />
Natural <strong>Gas</strong><br />
11%<br />
Table 4.3: <strong>2005</strong> Community <strong>Emissions</strong><br />
by Source<br />
<strong>Greenhouse</strong> <strong>Gas</strong> <strong>Emissions</strong><br />
Source<br />
(metric tons CO 2 e)<br />
<strong>Gas</strong>oline 2,459,852<br />
Electricity 668,439<br />
Natural <strong>Gas</strong> 453,211<br />
Diesel 441,844<br />
Solid Waste 144,865<br />
Wastewater 21,808<br />
Compressed NG 7,646<br />
TOTAL 4,197,665<br />
4.1.4 Per Capita <strong>Emissions</strong><br />
Per capita emissions can be a useful metric for measuring progress in reducing greenhouse gases and for comparing<br />
one community’s emissions with neighboring cities and against regional and national averages. That said, due to<br />
differences in emission inventory methods, it can be problematic to produce directly comparable per capita<br />
emissions numbers, and one must be cognizant <strong>of</strong> a margin <strong>of</strong> error when comparing figures between jurisdictions.<br />
<strong>2005</strong>/<strong>2006</strong> <strong>San</strong> <strong>Diego</strong> <strong>County</strong> <strong>Greenhouse</strong> <strong>Gas</strong> <strong>Emissions</strong> <strong>Inventory</strong> 33
As detailed in Table 4.4, dividing the total community-wide GHG emissions by population yields a result <strong>of</strong> 8.9<br />
metric tons <strong>of</strong> CO 2 e per capita. It is important to note that this number is not the same as the carbon footprint <strong>of</strong> the<br />
average individual living in unincorporated <strong>San</strong> <strong>Diego</strong> <strong>County</strong> (which would include lifecycle emissions, emissions<br />
resulting from air travel, and other indirect sources).<br />
Table 4.4: <strong>2005</strong> Per Capita <strong>Emissions</strong><br />
Estimated <strong>2005</strong> Population 470,977<br />
Community GHG <strong>Emissions</strong><br />
(MT CO 2 e) 4,197,665<br />
Per Capita GHG <strong>Emissions</strong><br />
(MT CO 2 e) 8.9<br />
4.2 Community <strong>Inventory</strong> Detail by Sector<br />
4.2.1 Residential Sector<br />
Energy consumption associated with unincorporated <strong>San</strong> <strong>Diego</strong> <strong>County</strong> homes produced 505,963 metric tons <strong>of</strong><br />
greenhouse gas emissions in <strong>2005</strong> (12 percent <strong>of</strong> total community emissions). All residential sector emissions are<br />
the result <strong>of</strong> electricity consumption and the on-site combustion <strong>of</strong> natural gas. <strong>Emissions</strong> from lawn equipment,<br />
wood-fired stoves, transportation and waste generation are not included in these totals. In <strong>2005</strong>, the residential<br />
sector consumed 4,723,160 kWh <strong>of</strong> electricity and 33,253,449 therms <strong>of</strong> natural gas. As shown in Figure 4.4, 35<br />
percent <strong>of</strong> total residential emissions were the result <strong>of</strong> natural gas use, and 65 percent were the result <strong>of</strong> electricity<br />
consumption. Natural gas is typically used in residences as a fuel for home heating, water heating and cooking, and<br />
electricity is generally used for lighting, heating, and to power appliances.<br />
Figure 4.4 Residential <strong>Emissions</strong> by Source<br />
Natural<br />
<strong>Gas</strong><br />
35%<br />
Electricity<br />
65%<br />
<strong>2005</strong>/<strong>2006</strong> <strong>San</strong> <strong>Diego</strong> <strong>County</strong> <strong>Greenhouse</strong> <strong>Gas</strong> <strong>Emissions</strong> <strong>Inventory</strong> 34
4.2.2 Commercial / Industrial Sector<br />
The commercial / industrial sector includes emissions from the operations <strong>of</strong> businesses as well as public agencies.<br />
For example, the majority <strong>of</strong> buildings and facilities included in the government operations inventory are also<br />
included as a subset <strong>of</strong> the commercial / industrial sector. In <strong>2005</strong>, buildings and facilities within the commercial /<br />
industrial sector produced 615,687 metric tons <strong>of</strong> greenhouse gas emissions (15 percent <strong>of</strong> total community<br />
emissions). All commercial / industrial sector emissions included in this inventory are the result <strong>of</strong> electricity<br />
consumption and the on-site combustion <strong>of</strong> natural gas. It is important to note that emissions from <strong>of</strong>f-road<br />
equipment, transportation, waste generation, stationary combustion other than natural gas, and other industrial<br />
processes are not included in these totals.<br />
Unincorporated <strong>San</strong> <strong>Diego</strong> <strong>County</strong> businesses generated 3.9 metric tons <strong>of</strong> GHG emissions per job in <strong>2005</strong>. 17 This<br />
metric provides an indication <strong>of</strong> the carbon intensity <strong>of</strong> local economic activity.<br />
As shown in Figure 4.5, 45 percent <strong>of</strong> total commercial / industrial emissions were the result <strong>of</strong> natural gas use, and<br />
55 percent were the result <strong>of</strong> electricity consumption. Natural gas is typically used in the commercial / industrial<br />
sector to heat buildings, fire boilers, and generate electricity; and electricity is generally used for lighting, heating,<br />
and to power appliances and equipment.<br />
Figure 4.5 Commercial / Industrial <strong>Emissions</strong> by Source<br />
Electricity<br />
55%<br />
Natural<br />
<strong>Gas</strong><br />
45%<br />
17 Jobs data was provided by SANDAG Technical Services Department, Current Estimates, August 2009.<br />
<strong>2005</strong>/<strong>2006</strong> <strong>San</strong> <strong>Diego</strong> <strong>County</strong> <strong>Greenhouse</strong> <strong>Gas</strong> <strong>Emissions</strong> <strong>Inventory</strong> 35
4.2.3 Transportation Sector<br />
As with many other local governments, transportation within the jurisdictional boundaries <strong>of</strong> unincorporated <strong>San</strong><br />
<strong>Diego</strong> <strong>County</strong> constitutes the greatest percentage (69 percent) <strong>of</strong> community wide greenhouse gas emissions –<br />
2,909,342 metric tons CO 2 e.<br />
Table 4.5: <strong>2005</strong> On-road Transportation <strong>Emissions</strong><br />
by Type<br />
<strong>Greenhouse</strong> <strong>Gas</strong><br />
<strong>Emissions</strong><br />
(metric tons CO 2 e)<br />
Share <strong>of</strong> Total<br />
Transportation<br />
<strong>Emissions</strong><br />
Source<br />
Local Roads 846,671 31%<br />
State Highways 1,919,023 69%<br />
TOTAL 2,765,694 100.0%<br />
Ninety-five percent <strong>of</strong> transportation sector emissions came from on-road travel, with the remaining five percent<br />
originating from <strong>of</strong>f-road mobile sources. As shown above in Table 4.5, travel on local city roads constituted 31<br />
percent <strong>of</strong> on-road emissions, and 69 percent came from travel on state highways within unincorporated areas. An<br />
estimated 85 percent <strong>of</strong> transportation emissions were due to gasoline consumption with the remaining<br />
approximately 15 percent coming from diesel use and less than one percent from compressed natural gas.<br />
Please see Appendix D for more detail on methods and emissions factors used in calculating emissions from the<br />
Transportation Sector.<br />
4.2.4 Solid Waste Sector<br />
The solid waste sector constituted three percent <strong>of</strong> total emissions for the unincorporated <strong>San</strong> <strong>Diego</strong> <strong>County</strong><br />
community in <strong>2005</strong>. <strong>Emissions</strong> from the solid waste sector are an estimate <strong>of</strong> future methane generation from the<br />
decomposition <strong>of</strong> municipal solid waste (MSW) and alternative daily cover (ADC) sent to landfill in the base year.<br />
These emissions are considered Scope 3 because they are not generated in the base year, but will result from the<br />
decomposition <strong>of</strong> <strong>2005</strong> waste over the full 100+ year cycle <strong>of</strong> its decomposition.<br />
The solid waste sector also includes Scope 1 base year emissions from landfills in the jurisdiction, known as<br />
“landfill waste-in-place.” As stated in the Government <strong>Inventory</strong> section, about 75 percent 18 <strong>of</strong> landfill methane<br />
emissions are captured through landfill gas collection systems, but the remaining 25 percent escape into the<br />
atmosphere as a significant contributor to global warming. Please see Table 4.6 below for a summary <strong>of</strong> emissions<br />
per major waste type. 19<br />
18 US EPA AP 42.<br />
19 Waste characterization figures were provided by the 2004 California Waste Characterization Study,<br />
http://www.ciwmb.ca.gov/Publications/default.asp?pubid=1097<br />
<strong>2005</strong>/<strong>2006</strong> <strong>San</strong> <strong>Diego</strong> <strong>County</strong> <strong>Greenhouse</strong> <strong>Gas</strong> <strong>Emissions</strong> <strong>Inventory</strong> 36
Table 4.6: Community-Generated Solid Waste<br />
<strong>Emissions</strong> Sources<br />
<strong>Greenhouse</strong> <strong>Gas</strong><br />
<strong>Emissions</strong><br />
(metric tons CO 2 e)<br />
Share <strong>of</strong> Total<br />
Waste <strong>Emissions</strong><br />
Source<br />
Paper Products 65,447 52.0%<br />
Food Waste 25,756 20.5%<br />
Plant Debris 15,372 12.2%<br />
Wood / Textiles 19,228 15.3%<br />
TOTAL 125,803 100.0%<br />
4.2.5 Wastewater Sector<br />
The wastewater sector contributed 21,808 metric tons <strong>of</strong> greenhouse gas emissions, constituting 1 percent <strong>of</strong> total<br />
emissions for the <strong>San</strong> <strong>Diego</strong> <strong>County</strong> community in <strong>2005</strong>. <strong>Emissions</strong> from the wastewater sector are an estimate <strong>of</strong><br />
methane and nitrous oxide generated in the process <strong>of</strong> wastewater treatment. These emissions are considered Scope<br />
3 because they occur at treatment facilities outside the jurisdictional boundaries and “downstream” from the <strong>San</strong><br />
<strong>Diego</strong> <strong>County</strong> community where the wastewater in generated. In the <strong>San</strong> <strong>Diego</strong> region, about 71 percent 20 <strong>of</strong><br />
wastewater treatment methane emissions are captured through biogas collection systems, but the remainder escape<br />
into the atmosphere and contribute the jurisdiction’s impact on climate change.<br />
4.3 Community <strong>Emissions</strong> Forecast<br />
To illustrate the potential emissions growth based on projected trends in energy use, driving habits, job growth, and<br />
population growth from the baseline year going forward, this report includes an emissions forecast for the year<br />
2020. Under a business-as-usual scenario, unincorporated <strong>San</strong> <strong>Diego</strong> <strong>County</strong>’s emissions will grow by<br />
approximately 21 percent by the year 2020, from 4,197,665 to 5,092,725 metric tons CO 2 e. Figure 4.6 and Table 4.7<br />
show the results <strong>of</strong> the forecast. A variety <strong>of</strong> different reports and projections were used to create the emissions<br />
forecast, as pr<strong>of</strong>iled below.<br />
4.3.1 Residential Forecast<br />
For the residential sector, a households projection conducted by the <strong>San</strong> <strong>Diego</strong> Association <strong>of</strong> Government<br />
(SANDAG) was used to estimate average annual compound growth in residential energy demand (1.94 percent).<br />
SANDAG estimates that the number <strong>of</strong> households in unincorporated areas was 151,883 in <strong>2006</strong>, and will be<br />
202,557 in 2020. 21<br />
20 <strong>San</strong> <strong>Diego</strong> <strong>County</strong> <strong>Greenhouse</strong> <strong>Gas</strong> <strong>Inventory</strong>, USD Energy Policy Initiatives Center.<br />
21 SANDAG 2030 Regional Growth Forecast Update (<strong>2006</strong>).<br />
<strong>2005</strong>/<strong>2006</strong> <strong>San</strong> <strong>Diego</strong> <strong>County</strong> <strong>Greenhouse</strong> <strong>Gas</strong> <strong>Emissions</strong> <strong>Inventory</strong> 37
Figure 4.6 Community <strong>Emissions</strong> Forecast for 2020<br />
6,000,000<br />
5,000,000<br />
Metric Tons CO2e<br />
4,000,000<br />
3,000,000<br />
2,000,000<br />
1,000,000<br />
Wastewater<br />
Solid Waste<br />
Transportation<br />
Commercial / Industrial<br />
Residential<br />
0<br />
<strong>2005</strong><br />
2020<br />
4.3.2 Commercial / Industrial Forecast<br />
The California Energy Commission’s California Energy Demand 2008-2018 shows that commercial floor space and<br />
the number <strong>of</strong> jobs have closely tracked the growth in energy use in the commercial sector. Using job growth<br />
projections also provided by SANDAG, it was calculated that the average annual growth in energy use in the<br />
commercial / industrial sector between <strong>2006</strong> and 2020 will be 0.28 percent. 22<br />
4.3.3 Transportation Forecast<br />
Growth in transportation emissions over the forecast period is closely related to planned transportation infrastructure<br />
investments and the associated vehicle activity, as measured in vehicle miles traveled (VMT). Long-term<br />
transportation infrastructure is planned through the 2030 <strong>San</strong> <strong>Diego</strong> Regional Transportation Plan, published by<br />
SANDAG in 2007, and travel activity projections performed by SANDAG are based on this plan. These projections<br />
forecast a 22 percent increase in regional VMT between <strong>2005</strong> and 2020; this trend was applied to unincorporated<br />
22 Ibid.<br />
<strong>2005</strong>/<strong>2006</strong> <strong>San</strong> <strong>Diego</strong> <strong>County</strong> <strong>Greenhouse</strong> <strong>Gas</strong> <strong>Emissions</strong> <strong>Inventory</strong> 38
<strong>County</strong> <strong>2005</strong> VMT to estimate 2020 travel activity. While this increase is attributed to regional travel as a whole<br />
and not specifically local travel in unincorporated areas, local VMT is likely to follow a similar trend, and this<br />
forecasting approach is more reliable than applying state-wide travel forecasts to the local level. 23<br />
4.3.4 Solid Waste and Wastewater Forecasts<br />
Population is the primary determinate for growth in emissions pertaining to waste and wastewater generation.<br />
Therefore, the average annual population growth rate from <strong>2006</strong> to 2020 (1.93 percent, as calculated from abovereferenced<br />
SANDAG population projections) was used to estimate future emissions from solid waste disposal and<br />
wastewater treatment.<br />
Table 4.7: <strong>2005</strong> Community <strong>Emissions</strong> Growth Forecast<br />
by Sector<br />
Sector<br />
<strong>2005</strong><br />
(metric<br />
tons CO 2e)<br />
2020<br />
(metric<br />
tons CO 2 e)<br />
Annual<br />
Growth<br />
Rate<br />
Percent<br />
Change from<br />
<strong>2005</strong> to 2020<br />
Residential 505,963 674,772 1.94% 33.4%<br />
Commercial / Industrial 615,687 642,396 0.28% 4.3%<br />
Transportation 2,909,342 3,553,619 1.34% 22.1%<br />
Solid Waste 144,865 192,899 1.93% 33.2%<br />
Wastewater 21,808 29,039 1.93% 33.2%<br />
TOTAL 4,197,665 5,092,725 -- 21.3%<br />
23 New fuel efficiency standards under the federal Corporate Average Fuel Economy (CAFE) program and State <strong>of</strong> California “Clean Car”<br />
standards under AB 1493 (Pavley) could significantly reduce the demand for transportation fuel in <strong>San</strong> Marcos. An analysis <strong>of</strong> potential fuel<br />
savings from these measures at a scale that would be useful for the purpose <strong>of</strong> this report has not been conducted, nor would such an analysis<br />
produce a true business-as-usual estimation.<br />
<strong>2005</strong>/<strong>2006</strong> <strong>San</strong> <strong>Diego</strong> <strong>County</strong> <strong>Greenhouse</strong> <strong>Gas</strong> <strong>Emissions</strong> <strong>Inventory</strong> 39
<strong>2005</strong>/<strong>2006</strong> <strong>San</strong> <strong>Diego</strong> <strong>County</strong> <strong>Greenhouse</strong> <strong>Gas</strong> <strong>Emissions</strong> <strong>Inventory</strong> 40
Conclusion<br />
By participating in the <strong>San</strong> <strong>Diego</strong> Regional Climate Protection Initiative and other sustainability initiatives, the<br />
<strong>County</strong> <strong>of</strong> <strong>San</strong> <strong>Diego</strong> has taken bold steps toward reducing its impacts on the environment. Policymakers and staff<br />
have chosen to take a leadership role in addressing climate change, and this leadership will allow the <strong>County</strong> to<br />
make tough decisions to create and implement innovative approaches to reduce its emissions. With increasing<br />
guidance and support from the state and the federal governments, <strong>San</strong> <strong>Diego</strong> <strong>County</strong> should be increasingly<br />
empowered to make the necessary changes to promote its vision for a more sustainable future.<br />
This conclusion discusses the inventory as a baseline for emissions targets and suggests steps for the <strong>County</strong> <strong>of</strong> <strong>San</strong><br />
<strong>Diego</strong> to move forward to reduce emissions both from its internal operations and from the <strong>San</strong> <strong>Diego</strong> community.<br />
5.1 Toward Setting <strong>Emissions</strong> Reduction Targets<br />
This inventory provides an emissions baseline that the <strong>County</strong> <strong>of</strong> <strong>San</strong> <strong>Diego</strong> can use to inform Milestone Two <strong>of</strong><br />
ICLEI’s Five-Milestone process—setting emissions reduction targets for its municipal operations. The greenhouse<br />
gas emissions reduction target is a goal to reduce emissions in its government operations to a certain percentage<br />
below base year levels, by a chosen planning horizon year. An example target might be a 30 percent reduction in<br />
emissions below <strong>2005</strong> levels by 2020. A target provides an objective toward which to strive and against which to<br />
measure progress. It allows a local government to quantify its commitment to fighting global warming—<br />
demonstrating that the jurisdiction is serious about its commitment and systematic in its approach.<br />
In selecting a target, it is important to strike a balance between scientific necessity, ambition, and what is<br />
realistically achievable. The <strong>County</strong> will want to give itself enough time to implement chosen emissions reduction<br />
measures—but note that the farther out the target year is, the more that <strong>San</strong> <strong>Diego</strong> <strong>County</strong> should pledge to reduce.<br />
ICLEI recommends that regardless <strong>of</strong> the <strong>County</strong>’s chosen long-term emissions reduction target (e.g., 15-year, 40-<br />
<strong>2005</strong>/<strong>2006</strong> <strong>San</strong> <strong>Diego</strong> <strong>County</strong> <strong>Greenhouse</strong> <strong>Gas</strong> <strong>Emissions</strong> <strong>Inventory</strong> 41
year), it should establish interim targets for every two- to three-year period. Near-term targets facilitate additional<br />
support and accountability, and help to ensure continued momentum around the <strong>County</strong>’s local climate protection<br />
efforts. To monitor the effectiveness <strong>of</strong> its programs, <strong>San</strong> <strong>Diego</strong> <strong>County</strong> should plan to re-inventory its emissions on<br />
a regular basis; many jurisdictions are electing to perform annual inventories. See Appendix E for more information<br />
on how to re-inventory the <strong>County</strong>’s emissions.<br />
5.1.1 The Long-Term Goal<br />
ICLEI recommends that the <strong>County</strong> <strong>of</strong> <strong>San</strong> <strong>Diego</strong>’s near-term climate work should be guided by the long-term goal<br />
<strong>of</strong> reducing its emissions by 80 percent to 95 percent from the <strong>2006</strong> baseline level by the year 2050. By referencing<br />
a long-term goal that is in accordance with current scientific understanding, the <strong>County</strong> can demonstrate that it<br />
intends to do its part towards addressing greenhouse gas emissions from its internal operations.<br />
It is important to keep in mind that it will be next to impossible for local governments to reduce emissions by 80 to<br />
95 percent without the assistance <strong>of</strong> state and federal policy changes that create new incentives and new sources <strong>of</strong><br />
funding for emissions reduction projects and programs. However, in the next 15 years, there is much that local<br />
governments can do to reduce emissions independently. It is also important that the <strong>County</strong> works to reduce its<br />
emissions sooner, rather than later: the sooner a stable level <strong>of</strong> greenhouse gases in the atmosphere is achieved, the<br />
less likely it is that some <strong>of</strong> the most dire climate change scenarios will be realized.<br />
5.1.2 State <strong>of</strong> California Targets and<br />
Guidance<br />
An integral component <strong>of</strong> the State <strong>of</strong> California’s<br />
climate approach has been establishing three core<br />
emissions reduction targets at the community level.<br />
While these targets are specific to the community-scale,<br />
they can be used to inform emissions targets for<br />
government operations as well. Figure 5.1 highlights<br />
adopted emissions targets for the State. The AB 32<br />
Scoping Plan also provides further guidance on<br />
establishing targets for local governments; specifically<br />
the Plan suggests creating an emissions reduction goal<br />
<strong>of</strong> 15 percent below “current” levels by 2020. This target has informed many local government’s emission reduction<br />
targets for municipal operations—most local governments in California with adopted targets have targets <strong>of</strong> 15 to 25<br />
percent reductions under <strong>2005</strong> levels by 2020.<br />
Figure 5.1: California <strong>Greenhouse</strong><br />
<strong>Gas</strong> Reduction Targets<br />
On June 1, <strong>2005</strong>, California Governor<br />
Schwarzenegger signed Executive Order S-<br />
3-05 establishing climate change emission<br />
reductions targets for the State <strong>of</strong> California.<br />
The California targets are an example <strong>of</strong><br />
near-, mid- and long-term targets:<br />
Reduce emissions to 2000 levels by 2010<br />
Reduce emissions to 1990 levels by 2020<br />
Reduce emissions to 80 percent below<br />
1990 levels by 2050<br />
<strong>2005</strong>/<strong>2006</strong> <strong>San</strong> <strong>Diego</strong> <strong>County</strong> <strong>Greenhouse</strong> <strong>Gas</strong> <strong>Emissions</strong> <strong>Inventory</strong> 42
5.1.3 Department Targets<br />
If possible, ICLEI recommends that <strong>San</strong> <strong>Diego</strong> <strong>County</strong> consider department-specific targets for each <strong>of</strong> the<br />
departments that generate emissions within its operations. This allows the <strong>County</strong> staff to do a more in-depth<br />
analysis <strong>of</strong> what is achievable in each sector in the near, mid and long-term, and also provides encourages each<br />
department head to consider their department’s impact on the climate and institute a climate-conscious culture in its<br />
operations.<br />
5.2 Creating an <strong>Emissions</strong> Reduction Strategy<br />
This inventory identifies the major sources <strong>of</strong> emissions from <strong>San</strong> <strong>Diego</strong> <strong>County</strong> and, therefore, where policymakers<br />
will need to target emissions reductions activities if they are to make significant progress toward adopted targets.<br />
For example, since largest sector that the <strong>County</strong> could affect was buildings and facilities, it is possible that the<br />
<strong>County</strong> could meet near-term targets simply by implementing a few major actions within that sector. In addition,<br />
medium-term targets could be met by focusing emissions reduction actions on the vehicle fleet, public lighting, and<br />
government-generated waste and the long term (2050) target will not be achievable without major reductions in all<br />
<strong>of</strong> those sectors.<br />
Given the results <strong>of</strong> the inventory, ICLEI recommends that the <strong>County</strong> <strong>of</strong> <strong>San</strong> <strong>Diego</strong> focus on the following tasks in<br />
order to significantly reduce emissions from its government operations:<br />
• Continued replacement <strong>of</strong> lights with LED alternatives.<br />
• Continued green building initiatives and retr<strong>of</strong>its.<br />
• Increasing waste-diversion efforts by adding and promoting recycling efforts within all facilities and<br />
public areas.<br />
• Create more efficient vehicle fleets, by decreasing the size <strong>of</strong> the overall fleet and by replacing retired<br />
vehicles with hybrid or fuel-efficient alternatives.<br />
In addition to the types <strong>of</strong> actions described above, which reduce emissions from government operations, ICLEI<br />
recommends developing policies and actions that will help to reduce emissions throughout the community.<br />
Examples include:<br />
• Promoting growth through redevelopment and infill that maintains or improves the quality <strong>of</strong> life for<br />
existing neighborhoods.<br />
• Adopting local parking standards that encourage reduced single-occupancy vehicle travel.<br />
• Adopting building codes that exceed Title 24 energy requirements, on either a mandatory or voluntary<br />
basis.<br />
• Establish water conservation guidelines and standards for existing development, new development and<br />
<strong>County</strong> facilities.<br />
<strong>2005</strong>/<strong>2006</strong> <strong>San</strong> <strong>Diego</strong> <strong>County</strong> <strong>Greenhouse</strong> <strong>Gas</strong> <strong>Emissions</strong> <strong>Inventory</strong> 43
• Provide public education programs on waste prevention, source reduction, recycling, yard waste, wood<br />
waste, and hazardous waste<br />
By identifying and implementing a set <strong>of</strong> these types <strong>of</strong> strategies, the <strong>County</strong> <strong>of</strong> <strong>San</strong> <strong>Diego</strong> should be able to reduce<br />
and reverse its impact upon global warming. In the process, it may also be able to improve the quality <strong>of</strong> its<br />
services, reduce costs, stimulate local economic development, and inspire local residents and businesses to redouble<br />
their own efforts to combat climate change.<br />
<strong>2005</strong>/<strong>2006</strong> <strong>San</strong> <strong>Diego</strong> <strong>County</strong> <strong>Greenhouse</strong> <strong>Gas</strong> <strong>Emissions</strong> <strong>Inventory</strong> 44
Appendices<br />
<strong>2005</strong>/<strong>2006</strong> <strong>San</strong> <strong>Diego</strong> <strong>County</strong> <strong>Greenhouse</strong> <strong>Gas</strong> <strong>Emissions</strong> <strong>Inventory</strong> 45
Appendix A:<br />
The Local Government Operations<br />
Protocol<br />
This inventory follows the standard outlined in the Local Government Operations Protocol, which was adopted in<br />
2008 by the California Air Resources Board (CARB) and serves as the national standard for quantifying and<br />
reporting greenhouse emissions from local government operations. This and the other inventories conducted for the<br />
<strong>San</strong> <strong>Diego</strong> Regional Climate Protection Initiative are among the first to follow LGOP, representing a strong step<br />
toward standardizing how inventories are conducted and reported.<br />
A.1 Local Government Operations Protocol<br />
A.1.1 Background<br />
In 2008, ICLEI, CARB, and the California Climate Action Registry (CCAR) released LGOP to serve as a U.S.<br />
supplement to the International <strong>Emissions</strong> Analysis Protocol. The purpose <strong>of</strong> LGOP is to provide the principles,<br />
approach, methodology, and procedures needed to develop a local government operations greenhouse gas emissions<br />
inventory. It leads participants through the process <strong>of</strong> accurately quantifying and reporting emissions, including<br />
providing calculation methodologies and reporting guidance. LGOP guidance is divided into three main parts:<br />
identifying emissions to be included in the inventory, quantifying emissions using best available estimation<br />
methods, and reporting emissions.<br />
The overarching goal <strong>of</strong> LGOP is to allow local governments to develop emissions inventories using standards that<br />
are consistent, comparable, transparent, and recognized nationally, ultimately enabling the measurement <strong>of</strong><br />
emissions over time. LGOP adopted five overarching accounting and reporting principles toward this end:<br />
relevance, completeness, consistency, transparency and accuracy. Methodologies that did not adhere to these<br />
principles were either left out <strong>of</strong> LGOP or included as Scope 3 emissions. LGOP was created solely to standardize<br />
how emissions inventories are conducted and reported; as such it represents a currently accepted standard for<br />
inventorying emissions but does not contain any legislative or program-specific requirements. Mandates by the<br />
State <strong>of</strong> California or any other legislative body, while possibly using LGOP as a standard, do not currently exist,<br />
and California local governments are not currently required to inventory their emissions. Program-specific<br />
requirements, such as ICLEI’s Milestones or CCAR’s reporting protocol, are addressed in LGOP but should not be<br />
confused with LGOP itself.<br />
<strong>2005</strong>/<strong>2006</strong> <strong>San</strong> <strong>Diego</strong> <strong>County</strong> <strong>Greenhouse</strong> <strong>Gas</strong> <strong>Emissions</strong> <strong>Inventory</strong> I
Also, while LGOP standardizes inventories from government operations, it does not seek to be a wholly accurate<br />
inventory <strong>of</strong> all emissions sources, as certain sources are currently excluded or otherwise impossible to accurately<br />
estimate. This and all emissions inventories therefore represent a best estimate <strong>of</strong> emissions using best available<br />
data and calculation methodologies; it does not provide a complete picture <strong>of</strong> all emissions resulting from the<br />
<strong>County</strong> <strong>of</strong> <strong>San</strong> <strong>Diego</strong>’s operations, and emissions estimates are subject to change as better data and calculation<br />
methodologies become available in the future.<br />
A.1.2 Organizational Boundaries<br />
Setting an organizational boundary for greenhouse gas emissions accounting and reporting is an important first step<br />
in the inventory process. The organizational boundary for the inventory determines which aspects <strong>of</strong> operations are<br />
included in the emissions inventory, and which are not. Under LGOP, two control approaches are used for reporting<br />
emissions: operational control or financial control. A local government has operational control over an operation if<br />
it has full authority to introduce and implement its operating policies at the operation. A local government has<br />
financial control if the operation is fully consolidated in financial accounts. If a local government has joint control<br />
over an operation, the contractual agreement will have to be examined to see who has authority over operating<br />
policies and implementation, and thus the responsibility to report emissions under operational control. 24 Local<br />
governments must choose which approach is the most applicable and apply this approach consistently throughout<br />
the inventory.<br />
While both control approaches are acceptable, there may be some instances in which the choice may determine<br />
whether a source falls inside or outside <strong>of</strong> a local government’s boundary. LGOP strongly encourages local<br />
governments to utilize operational control as the organization boundary for a government operations emissions<br />
inventory. Operational control is believed to most accurately represent the emissions sources that local governments<br />
can most directly influence, and this boundary is consistent with other environmental and air quality reporting<br />
program requirements. For this reason, all inventories in the <strong>San</strong> <strong>Diego</strong> Regional Climate Protection Initiative are<br />
being conducted according to the operational control framework.<br />
A.1.3 Types <strong>of</strong> <strong>Emissions</strong><br />
The greenhouse gases inventoried in this report are described in Section 2.1 As described in LGOP, emissions from<br />
each <strong>of</strong> the greenhouse gases can come in a number <strong>of</strong> forms:<br />
Stationary or mobile combustion: These are emissions resulting from on-site combustion <strong>of</strong> fuels (natural gas,<br />
diesel, gasoline, etc.) to generate heat, electricity, or to power vehicles and mobile equipment.<br />
24 Please see Local Government Operations Protocol for more detail on defining your organizational boundary:<br />
http://www.icleiusa.org/programs/climate/ghg-protocol<br />
<strong>2005</strong>/<strong>2006</strong> <strong>San</strong> <strong>Diego</strong> <strong>County</strong> <strong>Greenhouse</strong> <strong>Gas</strong> <strong>Emissions</strong> <strong>Inventory</strong> II
Purchased electricity: These are emissions produced by the generation <strong>of</strong> power from utilities outside <strong>of</strong> the<br />
jurisdiction.<br />
Fugitive emissions: <strong>Emissions</strong> that result from the unintentional release <strong>of</strong> greenhouse gases into the atmosphere<br />
(e.g., leaked refrigerants, methane from waste decomposition, etc.).<br />
Process emissions: <strong>Emissions</strong> from physical or chemical processing <strong>of</strong> a material (e.g., wastewater treatment).<br />
A.1.4 Quantifying <strong>Emissions</strong><br />
<strong>Emissions</strong> can be quantified two ways:<br />
Measurement-based methodologies refer to the direct measurement <strong>of</strong> greenhouse gas emissions (from a<br />
monitoring system) emitted from a flue <strong>of</strong> a power plant, wastewater treatment plant, landfill, or industrial facility.<br />
This methodology is not generally available for most types <strong>of</strong> emissions and will only apply to a few local<br />
governments that have these monitoring systems.<br />
The majority <strong>of</strong> the emissions recorded in the inventory can be and will be estimated using calculation-based<br />
methodologies to calculate their emissions using activity data and emission factors. To calculate emissions, the<br />
equation below is used:<br />
Activity Data x Emission Factor = <strong>Emissions</strong><br />
Activity data refer to the relevant measurement <strong>of</strong> energy use or other greenhouse gas–generating processes such as<br />
fuel consumption by fuel type, metered annual energy consumption, and annual vehicle mileage by vehicle type.<br />
<strong>Emissions</strong> factors are calculated ratios relating emissions to a proxy measure <strong>of</strong> activity at an emissions source (e.g.,<br />
CO 2 generated/kWh consumed). For a list <strong>of</strong> common emissions calculations see Table 2.2.<br />
The guidelines in LGOP are meant to provide a common method for local governments to quantify and report<br />
greenhouse gas emissions by using comparable activity data and emissions factors. However, LGOP recognizes that<br />
local governments differ in how they collect data concerning their operations and that many are not able to meet the<br />
data needs <strong>of</strong> a given estimation method. Therefore, LGOP outlines both “recommended” and “alternative” methods<br />
to estimate emissions from a given source. In this system, recommended methods are the preferred method for<br />
estimating emissions, as they will result in the most accurate estimate for a given emission source. Alternative<br />
methods <strong>of</strong>ten require less intensive data collection, but are likely to be less accurate. This approach allows local<br />
governments to estimate emissions based on the data currently available to them. It also allows local governments<br />
that are unable to meet the recommended methods to begin developing internal systems to collect the data needed to<br />
meet these methods.<br />
<strong>2005</strong>/<strong>2006</strong> <strong>San</strong> <strong>Diego</strong> <strong>County</strong> <strong>Greenhouse</strong> <strong>Gas</strong> <strong>Emissions</strong> <strong>Inventory</strong> III
This inventory has used the recommended activity data and emissions factors wherever possible, using alternative<br />
methods where necessary. For details on the methodologies used for each sector, see Appendix B.<br />
A.1.5 Reporting <strong>Emissions</strong><br />
A.1.5.1 Significance Thresholds<br />
Within any local government’s own operations there will be emission sources that fall within Scope 1 and Scope 2<br />
that are minimal in magnitude and difficult to accurately measure. Within the context <strong>of</strong> local government<br />
operations, emissions from leaked refrigerants and backup generators may be common sources <strong>of</strong> these types <strong>of</strong><br />
emissions. For these less significant emissions sources, LGOP specifies that up to 5 percent <strong>of</strong> total emissions can<br />
be reported using estimation methods not outlined in LGOP. 25 In this report, all documented emissions were<br />
calculated using LGOP methods; emissions sources not analyzed in the report that fall under the significance<br />
threshold include fire suppression systems and hand-held fire extinguishers.<br />
A.1.5.2 Units Used in Reporting <strong>Emissions</strong><br />
LGOP requires reporting <strong>of</strong> individual gas emissions, and this reporting is included in Appendix B. In this narrative<br />
report, emissions from all gases released by an emissions source (e.g., stationary combustion <strong>of</strong> natural gas in<br />
facilities) are combined and reported in metric tons <strong>of</strong> carbon dioxide equivalent (CO 2 e). This standard is based on<br />
the global warming potential (GWP) <strong>of</strong> each gas, which is a measure <strong>of</strong> the amount <strong>of</strong> warming a greenhouse gas<br />
may cause, measured against the amount <strong>of</strong> warming caused by carbon dioxide. For the GWPs <strong>of</strong> reported<br />
greenhouse gases, see Table 2.1.<br />
A.1.5.3 Information Items<br />
Information items are emissions sources that, for a variety <strong>of</strong> reasons, are not included as Scope 1, 2, or 3 emissions<br />
in the inventory. In order to provide a more complete picture <strong>of</strong> emissions from the <strong>County</strong>’s operations, however,<br />
these emissions should be quantified and reported. In this report, ozone depleting chemicals used as refrigerants<br />
(most notably R-22) are included as information items (emission quantities are reported in Appendix B).<br />
A common emission that is categorized as an information item is carbon dioxide emitted in the combustion <strong>of</strong><br />
biogenic fuels. Local governments will <strong>of</strong>ten burn fuels that are <strong>of</strong> biogenic origin (wood, landfill gas, organic solid<br />
waste, bi<strong>of</strong>uels, etc.) to generate power. Common sources <strong>of</strong> biogenic emissions are the combustion <strong>of</strong> landfill gas<br />
from landfills or biogas from wastewater treatment plants, as well as the incineration <strong>of</strong> organic municipal solid<br />
waste at incinerators.<br />
25 In the context <strong>of</strong> registering emissions with an independent registry (such as the California Climate Action Registry), emissions that fall<br />
under the significance threshold are called de minimis. This term, however, is not used in LGOP and was not used in this inventory.<br />
<strong>2005</strong>/<strong>2006</strong> <strong>San</strong> <strong>Diego</strong> <strong>County</strong> <strong>Greenhouse</strong> <strong>Gas</strong> <strong>Emissions</strong> <strong>Inventory</strong> IV
Carbon dioxide emissions from the combustion <strong>of</strong> biogenic fuels are not included in Scope 1 based on established<br />
international principles. 26 These principles indicate that biogenic fuels (e.g., wood, biodiesel), if left to decompose<br />
in the natural environment, would release CO 2 into the atmosphere, where it would then enter back into the natural<br />
carbon cycle. Therefore, when wood or another biogenic fuel is combusted, the resulting CO 2 emissions are akin to<br />
natural emissions and should therefore not be considered as human activity-generated emissions. The CH 4 and N 2 O<br />
emissions, however, would not have occurred naturally and are therefore included as Scope 1 emissions.<br />
A.2 Baseline Years<br />
Part <strong>of</strong> the local government operations emissions inventory process requires selecting a “performance datum” with<br />
which to compare current emissions, or a base year. Local governments should examine the range <strong>of</strong> data they have<br />
over time and select a year that has the most accurate and complete data for all key emission sources. It is also<br />
preferable to establish a base year several years in the past to be able to account for the emissions benefits <strong>of</strong> recent<br />
actions. A local government’s emissions inventory should comprise all greenhouse gas emissions occurring during a<br />
selected calendar year.<br />
For the <strong>San</strong> <strong>Diego</strong> Regional Climate Protection Initiative, <strong>2005</strong> was chosen as the baseline year, since this year is<br />
increasingly becoming the standard for such inventories. However, the <strong>County</strong> <strong>of</strong> <strong>San</strong> <strong>Diego</strong> had significantly more<br />
data for <strong>2006</strong>, and therefore <strong>2006</strong> was chosen for the <strong>County</strong>’s baseline year. The 1990 baseline year for California<br />
is usually difficult for most local governments to meet and would not produce the most accurate inventory, although<br />
an estimate has been produced by the <strong>County</strong> using available information.<br />
After setting a base year and conducting an emissions inventory for that year, local governments should make it a<br />
practice to complete a comprehensive emissions inventory on a regular basis to compare to the baseline year. ICLEI<br />
recommends conducting an emissions inventory at least every five years.<br />
26 Methane and nitrous oxide emissions from biogenic fuels are considered Scope 1 stationary combustion emissions and are included in the<br />
stationary combustion sections for the appropriate facilities.<br />
<strong>2005</strong>/<strong>2006</strong> <strong>San</strong> <strong>Diego</strong> <strong>County</strong> <strong>Greenhouse</strong> <strong>Gas</strong> <strong>Emissions</strong> <strong>Inventory</strong> V
Appendix B:<br />
LGOP Standard Report<br />
Local Government Operations Standard <strong>Inventory</strong> Report<br />
1. Local Government Pr<strong>of</strong>ile<br />
Jurisdiction Name: <strong>County</strong> <strong>of</strong> <strong>San</strong> <strong>Diego</strong><br />
Street Address: 1600 Pacific Highway<br />
City, State, ZIP, Country: <strong>San</strong> <strong>Diego</strong>, CA 92101-2429<br />
Website Address: http://sdcounty.ca.gov<br />
Size (sq. miles): 3,572<br />
Population: 465,553<br />
Annual Budget: 4,370,000,000<br />
Employees (Full Time Equivalent): 17,951<br />
Climate Zone: 3B<br />
Annual Heating Degree Days: 2186<br />
Annual Cooling Degree Days: 1029<br />
Lead <strong>Inventory</strong> Contact Name: Devon Muto<br />
Title: Chief<br />
Department: Department <strong>of</strong> Planning and Land Use<br />
Email: devon.muto@sdcounty.ca.gov<br />
Phone Number: (858) 694 3016<br />
Services Provided:<br />
Water treatment<br />
Water distribution<br />
Wastewater treatment<br />
Wastewater collection<br />
Electric utility<br />
Fire Protection<br />
Police<br />
Mass transit (buses)<br />
Mass transit (light rail)<br />
Mass transit (ferries)<br />
Schools (primary/secondary)<br />
Schools (colleges/universities)<br />
Solid waste collection<br />
Solid waste disposal<br />
Hospitals<br />
Airport<br />
Seaport/shipping terminal<br />
Marina<br />
Stadiums/sports venues<br />
Convention center<br />
Street lighting and traffic signals<br />
Natural gas utility<br />
Other (Specify below)<br />
Local Government Description:<br />
<strong>San</strong> <strong>Diego</strong> <strong>County</strong> is the southwestern-most county <strong>of</strong> the United States. Providing all government services to populations not located in one <strong>of</strong> the 18 incorporated<br />
cities in <strong>San</strong> <strong>Diego</strong> <strong>County</strong>, the <strong>County</strong> also services its 3+ million total population, operating sheriff's departments, libraries, airports, and parks. The <strong>County</strong>'s ideal<br />
climate, along with easy access to the Pacific Ocean, Cuyamaca Mountains, and Anza Borrega Desert, makes it an area that continues to see growth, and through<br />
the <strong>County</strong>'s efforts, is dedicated to reducing greenhouse gas emissions while managing a growing population.<br />
<strong>2005</strong>/<strong>2006</strong> <strong>San</strong> <strong>Diego</strong> <strong>County</strong> <strong>Greenhouse</strong> <strong>Gas</strong> <strong>Emissions</strong> <strong>Inventory</strong> VI
2. GHG <strong>Inventory</strong> Details<br />
Reporting Year:<br />
Protocol Used:<br />
Control Approach:<br />
<strong>2006</strong><br />
Local Government Operations Protocol, Version 1.0 (September 2008)<br />
Operational Control<br />
GHG <strong>Emissions</strong> Summary (All Units in Metric Tons Unless Stated Otherwise)<br />
Note: CO 2 e totals listed here are summed totals <strong>of</strong> the estimated emissions <strong>of</strong> each inventoried gas based upon their global warming potentials<br />
(Appendix E <strong>of</strong> LGOP)<br />
BUILDINGS & OTHER FACILITIES<br />
SCOPE 1 CO 2 e CO 2 CH 4 N 2 O HFCs PFCs SF 6<br />
Stationary Combustion 14,738.436 14,700.756 0.028 1.385<br />
Fugitive <strong>Emissions</strong><br />
1.867 0.000 0.000 0.000 0.001<br />
Total Direct <strong>Emissions</strong> from Buildings & Facilities 14,740.303 14,700.756 0.028 1.385 0.001 0.000 0.000<br />
SCOPE 2 CO 2 e CO 2 CH 4 N 2 O<br />
Purchased Electricity 40,302.179 40,119.947 0.565 1.490<br />
Purchased Steam<br />
District Heating & Cooling<br />
Total Indirect <strong>Emissions</strong> from Buildings & Facilities 40,302.179 40,119.947 0.565 1.490<br />
STREETLIGHTS AND TRAFFIC SIGNALS<br />
SCOPE 2 CO 2 e CO 2 CH 4 N 2 O<br />
Purchased Electricity 2,146.640 2,135.647 0.030 0.079<br />
Total Indirect <strong>Emissions</strong> from Streetlights and Traffic Signals 2,146.640 2,135.647 0.030 0.079<br />
WATER DELIVERY FACILITIES<br />
SCOPE 1 CO 2 e CO 2 CH 4 N 2 O HFCs PFCs SF 6<br />
Stationary Combustion<br />
Total Direct <strong>Emissions</strong> from Water Delivery Facilities<br />
0.000 0.000 0.000 0.000 0.000 0.000 0.000<br />
SCOPE 2 CO 2 e CO 2 CH 4 N 2 O<br />
Purchased Electricity 78.310 77.909 0.001 0.003<br />
Purchased Steam<br />
District Heating & Cooling<br />
Total Indirect <strong>Emissions</strong> from Water Delivery Facilities 78.310 77.909 0.001 0.003<br />
WASTEWATER FACILITIES<br />
SCOPE 1 CO 2 e CO 2 CH 4 N 2 O HFCs PFCs SF 6<br />
Stationary Combustion<br />
Fugitive <strong>Emissions</strong> 2,654.747 0.000 8.564 0.000<br />
Process <strong>Emissions</strong><br />
Total Direct <strong>Emissions</strong> from Wastewater Facilities 2,654.747 0.000 8.564 0.000 0.000 0.000 0.000<br />
SCOPE 2 CO 2 e CO 2 CH 4 N 2 O<br />
Purchased Electricity 17.937 17.845 0.000 0.001<br />
Purchased Steam<br />
District Heating & Cooling<br />
Total Indirect <strong>Emissions</strong> from Wastewater Facilities 17.937 17.845 0.000 0.001<br />
SOLID WASTE FACILITIES<br />
SCOPE 1 CO 2 e CO 2 CH 4 N 2 O HFCs PFCs SF 6<br />
Stationary Combustion<br />
Fugitive <strong>Emissions</strong> 64,031.520 0.000 0.000 3,049.120<br />
Total Direct <strong>Emissions</strong> from Solid Waste Facilities 64,031.520 0.000 0.000 3,049.120 0.000 0.000 0.000<br />
SCOPE 2 CO 2 e CO 2 CH 4 N 2 O<br />
Purchased Electricity 160.713 159.890 0.002 0.006<br />
Total Indirect <strong>Emissions</strong> from Solid Waste Facilities 160.713 159.890 0.002 0.006<br />
<strong>2005</strong>/<strong>2006</strong> <strong>San</strong> <strong>Diego</strong> <strong>County</strong> <strong>Greenhouse</strong> <strong>Gas</strong> <strong>Emissions</strong> <strong>Inventory</strong> VII
VEHICLE FLEET<br />
SCOPE 1 CO 2 e CO 2 CH 4 N 2 O HFCs PFCs<br />
Mobile Combustion 23,168.280 22,429.601 2.235 2.189<br />
Fugitive <strong>Emissions</strong> 868.036 0.000 0.000 0.000 0.668<br />
Total Direct <strong>Emissions</strong> from Vehicle Fleet 24,036.316 22,429.601 2.235 2.189 0.668 0.000<br />
INDICATORS<br />
Number <strong>of</strong> Vehicles<br />
Vehicle Miles Traveled<br />
Number <strong>of</strong> Pieces <strong>of</strong> Equipment<br />
Equipment Operating Hours<br />
2,910<br />
1,150,833<br />
WASTE GENERATION<br />
SCOPE 3 CO 2 e CO 2 CH 4 N 2 O<br />
Waste All Facilities 2,131.920 0.000 0.000 101.520<br />
INDICATORS<br />
Short tons <strong>of</strong> solid waste accepted for disposal<br />
AIRPORT FACILITIES<br />
SCOPE 1 CO 2e CO 2 CH 4 N 2O HFCs PFCs SF 6<br />
Stationary Combustion 759.245 757.304 0.001 0.071<br />
Fugitive <strong>Emissions</strong><br />
Total Direct <strong>Emissions</strong> from Airport Facilities 759.245 757.304 0.001 0.071 0.000 0.000 0.000<br />
SCOPE 2 CO 2 e CO 2 CH 4 N 2 O<br />
Purchased Electricity 177.468 176.559 0.002 0.007<br />
Total Indirect <strong>Emissions</strong> from Airport Facilities 177.468 176.559 0.002 0.007<br />
INFORMATION ITEMS<br />
CO 2e<br />
Refrigerant R-22 35.000<br />
Flared Methane<br />
Total Information Items 35.000<br />
Total <strong>Emissions</strong><br />
CO 2 e CO 2 CH 4 N 2 O HFCs PFCs SF 6<br />
SCOPE 1 ######### 37,130.357 10.826 3,052.694 0.669 0.000 0.000<br />
SCOPE 2 42,883.246 42,351.348 0.597 1.573 0.000 0.000 0.000<br />
SCOPE 3 2,131.920 0.000 0.000 101.520<br />
INFORMATION ITEMS 35.000<br />
POSSIBLE SOURCES OF OPTIONAL SCOPE 3 EMISSIONS<br />
Employee Commute<br />
Employee Business Travel<br />
<strong>Emissions</strong> From Contracted Services<br />
Upstream Production <strong>of</strong> Materials and Fuels<br />
Upstream and Downstream Transportation <strong>of</strong> Materials and Fuels<br />
Waste Related Scope 3 <strong>Emissions</strong><br />
Purchase <strong>of</strong> Electricity Sold to an End User<br />
Transmission and Distribution Losses from Consumed Electricity<br />
Other Scope 3<br />
POSSIBLE INFORMATION ITEMS<br />
Biogenic C0 2 from Combustion<br />
Carbon Offsets Purchased<br />
Carbon Offsets Sold<br />
Renewable Energy Credits (Green Power) Purchased<br />
Renewable Energy Credits Sold (GreenPower)<br />
Ozone-depleting Refrigerants/Fire Suppressants not in LGOP<br />
Other Information Items<br />
<strong>2005</strong>/<strong>2006</strong> <strong>San</strong> <strong>Diego</strong> <strong>County</strong> <strong>Greenhouse</strong> <strong>Gas</strong> <strong>Emissions</strong> <strong>Inventory</strong> VIII
Local Government Operations Standard <strong>Inventory</strong> Report<br />
3. Activity Data Disclosure<br />
Every emission source must be accompanied by a reference for the activity data. This worksheet is meant to assist in recording activity data and the methods used to gather those data for<br />
government operations. Activity data represent the magnitude <strong>of</strong> human activity resulting in emissions; data on energy use, fuel consumtion, vehicle miles traveled, and waste generation are<br />
all examples <strong>of</strong> activity data that are used to compute GHGs. Detailed disclosure should be made <strong>of</strong> the activity data used and at what quantities. This disclosure should also cite the source(s)<br />
<strong>of</strong> the data and the methodology used, including whether that methodology is a recommended method or an alternate method.<br />
Deviations from the primary methodology should be explained in detail. All assumptions and estimations should be cited as such. Local governments may also use this space in the reporting<br />
format to discuss the rationale for the inclusion or exclusion <strong>of</strong> optional inventory components. It is good practice to include appropriate citations (such as website URL, report title, etc) and all<br />
contact information that is necessary to verify the source and accuracy <strong>of</strong> the activity data.<br />
BUILDINGS & OTHER FACILITIES (Chapter 6)<br />
SCOPE 1<br />
Stationary Combustion<br />
<strong>Emissions</strong> Source Name GHG Methodology Type Methodology Name and Description Resource Quantity Fuel Unit Data Sources and References<br />
CO2e<br />
CO2 Primary Known fuel use 2,770,591 therm SDGE, Jim Tello, Sr.<br />
CH4 Primary Known fuel use 2,770,591 therm SDGE, Jim Tello, Sr.<br />
Natural <strong>Gas</strong><br />
N2O Primary Known fuel use 2,770,591 therm SDGE, Jim Tello, Sr.<br />
HFCs<br />
PFCs<br />
SF6<br />
Fugitive <strong>Emissions</strong><br />
<strong>Emissions</strong> Source Name GHG Methodology Type Methodology Name and Description Resource Quantity Fuel Unit Data Sources and References<br />
Refrigerants HFC-134 Aternative Simplified Mass Balance-Alt1 0.40 kg<br />
Michael Urquhart,<br />
General Services,<br />
Refrigerants R-404A Blend Aternative Simplified Mass Balance-Alt1 0.45 kg<br />
Michael Urquhart,<br />
General Services,<br />
858.694.2111,<br />
michael.urquhart@sdcoun<br />
ty.ca.gov<br />
SCOPE 2<br />
Purchased Electricity<br />
<strong>Emissions</strong> Source Name GHG Methodology Type Methodology Name and Description Resource Quantity Fuel Unit Data Sources and References<br />
CO2e<br />
CO2 Primary Known Electricity Use 113,213,654 kWh SDGE, Jim Tello, Sr.<br />
CH4 Primary Known Electricity Use 113,213,654 kWh SDGE, Jim Tello, Sr.<br />
Electricity<br />
N2O Primary Known Electricity Use 113,213,654 kWh SDGE, Jim Tello, Sr.<br />
HFCs<br />
PFCs<br />
SF6<br />
STREETLIGHTS AND TRAFFIC SIGNALS (Chapter 6.2)<br />
SCOPE 2<br />
Purchased Electricity<br />
<strong>Emissions</strong> Source Name GHG Methodology Type Methodology Name and Description Resource Quantity Fuel Unit Data Sources and References<br />
CO2e<br />
CO2 Primary Known Electricity Use 6,030,169 kWh SDGE, Jim Tello, Sr.<br />
CH4 Primary Known Electricity Use 6,030,169 kWh SDGE, Jim Tello, Sr.<br />
Electricity<br />
N2O Primary Known Electricity Use 6,030,169 kWh SDGE, Jim Tello, Sr.<br />
HFCs<br />
PFCs<br />
SF6<br />
AIRPORT FACILITIES<br />
SCOPE 2<br />
Purchased Electricity<br />
<strong>Emissions</strong> Source Name GHG Methodology Type Methodology Name and Description Resource Quantity Fuel Unit Data Sources and References<br />
CO2e<br />
CO2 Primary Known Electricity Use 474,853 kWh SDGE, Jim Tello, Sr.<br />
CH4 Primary Known Electricity Use 474,853 kWh SDGE, Jim Tello, Sr.<br />
Electricity<br />
N2O Primary Known Electricity Use 474,853 kWh SDGE, Jim Tello, Sr.<br />
HFCs<br />
PFCs<br />
SF6<br />
WATER DELIVERY FACILITIES (Chapter 6)<br />
SCOPE 2<br />
Purchased Electricity<br />
<strong>Emissions</strong> Source Name GHG Methodology Type Methodology Name and Description Resource Quantity Fuel Unit Data Sources and References<br />
CO2e<br />
CO2 Primary Known Electricity Use 219,981 kWh SDGE, Jim Tello, Sr.<br />
CH4 Primary Known Electricity Use 219,981 kWh SDGE, Jim Tello, Sr.<br />
Electricity<br />
N2O Primary Known Electricity Use 219,981 kWh SDGE, Jim Tello, Sr.<br />
HFCs<br />
PFCs<br />
SF6<br />
<strong>2005</strong>/<strong>2006</strong> <strong>San</strong> <strong>Diego</strong> <strong>County</strong> <strong>Greenhouse</strong> <strong>Gas</strong> <strong>Emissions</strong> <strong>Inventory</strong> IX
SOLID WASTE FACILITIES (Chapters 6 and 9)<br />
SCOPE 1<br />
Fugitive <strong>Emissions</strong><br />
<strong>Emissions</strong> Source Name GHG Methodology Type Methodology Name and Description Resource Quantity Fuel Unit Data Sources and References<br />
Landfills CH4 LGOP EQ 9.1<br />
Landfills with Comprehensive LFG<br />
Collection Systems<br />
64,032 MT CO2<br />
Vicky Gallagher<br />
Vicky.gallagher@sdcounty<br />
.ca.gov or Jason Forga<br />
Jason.forga@sdcounty.ca.<br />
gov<br />
SCOPE 2<br />
Purchased Electricity<br />
<strong>Emissions</strong> Source Name GHG Methodology Type Methodology Name and Description Resource Quantity Fuel Unit Data Sources and References<br />
CO2e<br />
CO2 Primary Known Electricity Use 451,461 kWh SDGE, Jim Tello, Sr.<br />
CH4 Primary Known Electricity Use 451,461 kWh SDGE, Jim Tello, Sr.<br />
Electricity<br />
N2O Primary Known Electricity Use 451,461 kWh SDGE, Jim Tello, Sr.<br />
HFCs<br />
PFCs<br />
SF6<br />
VEHICLE FLEET (Chapter 7)<br />
SCOPE 1<br />
Mobile Combustion<br />
<strong>Emissions</strong> Source Name GHG Methodology Type Methodology Name and Description Resource Quantity Fuel Unit Data Sources and References<br />
CO2e<br />
Robert Grable (Bob)<br />
CO2 Primary Known Fuel Use 2,237,523 gallons<br />
Robert.grable@sdcounty.c<br />
a.gov<br />
<strong>Gas</strong>oline<br />
CH4 Alternate Fuel use by fuel type 2,237,523 gallons Robert Grable<br />
N2O Alternate Fuel use by fuel type 2,237,523 gallons Robert Grable<br />
HFCs<br />
PFCs<br />
SF6<br />
Diesel<br />
CO2e<br />
CO2 Primary Known Fuel Use 268,782 Gallon Robert Grable<br />
CH4 Alternate Fuel use by fuel type 268,782 Gallon Robert Grable<br />
N2O Alternate Fuel use by fuel type 268,782 Gallon Robert Grable<br />
HFCs<br />
PFCs<br />
SF6<br />
Fugitive <strong>Emissions</strong><br />
<strong>Emissions</strong> Source Name GHG Methodology Type Methodology Name and Description Resource Quantity Fuel Unit Data Sources and References<br />
Refrigerants R134-A Alternate<br />
Estimating based upon equipment inventory<br />
and use<br />
868 kg Robert Grable<br />
WASTE GENERATION (Scope 3)<br />
SCOPE 3<br />
<strong>Emissions</strong> Source Name GHG Methodology Type Methodology Name and Description Resource Quantity Fuel Unit Data Sources and References<br />
Generated Waste CH4 Primary and Alternate<br />
INFORMATION ITEMS<br />
Primary: from compacted waste; Alternate:<br />
Estimated waste weight based upon volume<br />
and number <strong>of</strong> containers<br />
9,581 tons<br />
Ryan Hughes<br />
RHughes@republicservice<br />
s.com Allied Waste 619-<br />
723-3524 AND<br />
Stationary Combustion<br />
<strong>Emissions</strong> Source Name GHG Methodology Type Methodology Name and Description Resource Quantity Fuel Unit Data Sources and References<br />
Michael Urquhart,<br />
General Services,<br />
Ozone Depleting<br />
Simplified mass balance: Estimated<br />
R-22 Alternate<br />
21 kg<br />
858.694.2111,<br />
Refrigerants<br />
emissions by leakage/recharge reported<br />
michael.urquhart@sdcoun<br />
ty.ca.gov<br />
POSSIBLE SOURCES OF OPTIONAL SCOPE 3 EMISSIONS<br />
Employee Commute<br />
Employee Business Travel<br />
<strong>Emissions</strong> From Contracted Services<br />
Upstream Production <strong>of</strong> Materials and Fuels<br />
Upstream and Downstream Transportation <strong>of</strong> Materials and Fuels<br />
Waste Related Scope 3 <strong>Emissions</strong><br />
Purchase <strong>of</strong> Electricity Sold to an End User<br />
Transmission and Distribution Losses from Consumed Electricity<br />
Other Scope 3<br />
POSSIBLE INFORMATION ITEMS<br />
Biogenic C02 from Combustion<br />
Carbon Offsets Purchased<br />
Carbon Offsets Sold<br />
Renewable Energy Credits (Green Power) Purchased<br />
Renewable Energy Credits Sold (GreenPower)<br />
Ozone-depleting Refrigerants/Fire Suppressants not in LGOP<br />
Other Information Items<br />
<strong>2005</strong>/<strong>2006</strong> <strong>San</strong> <strong>Diego</strong> <strong>County</strong> <strong>Greenhouse</strong> <strong>Gas</strong> <strong>Emissions</strong> <strong>Inventory</strong> X
Local Government Operations Standard <strong>Inventory</strong> Report<br />
4. Calculation Methodology Disclosure<br />
In addition to activity data, every emission source must be accompanied by the emission factor used, a reference for each emission factor, and the calculation<br />
BUILDINGS & OTHER FACILITIES (Chapter 6)<br />
SCOPE 1<br />
Stationary Combustion<br />
<strong>Emissions</strong> Source Name GHG Default/Alternate Emission Factor Emission Factor Sources and References<br />
CO 2 e<br />
Natural <strong>Gas</strong><br />
CO 2 Default 53.06 kg/MMBtu LGOP v1 Table G.1<br />
CH 4 Default 5 g/MMBtu LGOP v1 Table G.3<br />
N 2 O Default 0.1 g/MMBtu LGOP v1 Table G.3<br />
HFCs<br />
PFCs<br />
SF 6<br />
Generators-Diesel<br />
Generators-<strong>Gas</strong>oline<br />
CO 2 e<br />
CO 2 Default 73.15 kg/MMBtu LGOP v1 Table G.1<br />
CH 4 Default 11 g/MMBtu LGOP v1 Table G.3<br />
N 2 O Default .6 g/MMBtu LGOP v1 Table G.3<br />
HFCs<br />
PFCs<br />
SF 6<br />
CO 2 e<br />
CO 2 Default 70.88 kg/MMBtu LGOP v1 Table G.1<br />
CH 4 Default 11 g/MMBtu LGOP v1 Table G.3<br />
N 2 O Default .6 g/MMBtu LGOP v1 Table G.3<br />
HFCs<br />
PFCs<br />
SF 6<br />
Fugitive <strong>Emissions</strong><br />
<strong>Emissions</strong> Source Name GHG Default/Alternate Emission Factor Emission Factor Sources and References<br />
Refrigerants R410-A none GWP-1,725<br />
LGOP v1 Table<br />
E.1&E.2<br />
SCOPE 2<br />
Purchased Electricity<br />
<strong>Emissions</strong> Source Name GHG Default/Alternate Emission Factor Emission Factor Sources and References<br />
CO 2 e<br />
Electricity<br />
CO 2 Default 780.79 lbs /MWh LGOP, Table G.5<br />
CH 4 Default 0.029 lbs/ MWh LGOP, Table G.6<br />
N 2 O Default 0.011 lbs /MWh LGOP, Table G.6<br />
HFCs<br />
PFCs<br />
SF 6<br />
STREETLIGHTS AND TRAFFIC SIGNALS (Chapter 6.2)<br />
SCOPE 2<br />
Purchased Electricity<br />
<strong>Emissions</strong> Source Name GHG Default/Alternate Emission Factor Emission Factor Sources and References<br />
CO 2 e<br />
Electricity<br />
CO 2 Default 780.79 lbs /MWh LGOP, Table G.5<br />
CH 4 Default 0.029 lbs/ MWh LGOP, Table G.6<br />
N 2 O Default 0.011 lbs /MWh LGOP, Table G.6<br />
HFCs<br />
PFCs<br />
SF 6<br />
AIRPORT FACILITIES<br />
SCOPE 2<br />
Purchased Electricity<br />
<strong>Emissions</strong> Source Name GHG Default/Alternate Emission Factor Emission Factor Sources and References<br />
CO 2 e<br />
Electricity<br />
CO 2 Default 780.79 lbs /MWh LGOP, Table G.5<br />
CH 4 Default 0.029 lbs/ MWh LGOP, Table G.6<br />
N 2 O Default 0.011 lbs /MWh LGOP, Table G.6<br />
HFCs<br />
PFCs<br />
SF 6<br />
WATER DELIVERY FACILITIES (Chapter 6)<br />
SCOPE 2<br />
Purchased Electricity<br />
<strong>Emissions</strong> Source Name GHG Default/Alternate Emission Factor Emission Factor Sources and References<br />
CO 2 e<br />
Electricity<br />
CO 2 Default 780.79 lbs /MWh LGOP, Table G.5<br />
CH 4 Default 0.029 lbs/ MWh LGOP, Table G.6<br />
N 2 O Default 0.011 lbs /MWh LGOP, Table G.6<br />
HFCs<br />
PFCs<br />
SF 6<br />
<strong>2005</strong>/<strong>2006</strong> <strong>San</strong> <strong>Diego</strong> <strong>County</strong> <strong>Greenhouse</strong> <strong>Gas</strong> <strong>Emissions</strong> <strong>Inventory</strong> XI
SOLID WASTE FACILITIES (Chapters 6 and 9)<br />
SCOPE 1<br />
Fugitive <strong>Emissions</strong><br />
<strong>Emissions</strong> Source NameGHG Default/Alternate Emission Factor Emission Factor Sources and References<br />
CO 2 e<br />
Waste in Place<br />
CO 2<br />
CH 4<br />
N 2 O<br />
HFCs<br />
PFCs<br />
SF 6<br />
Default<br />
FOD model factors-see LGOP Section<br />
9.3.1<br />
Jesse Myott, Intern,<br />
Daly City 650-991-<br />
8054<br />
VEHICLE FLEET (Chapter 7)<br />
SCOPE 1<br />
Mobile Combustion<br />
<strong>Emissions</strong> Source Name GHG Default/Alternate Emission Factor Emission Factor Sources and References<br />
CO 2 e<br />
CO 2 Default 8.81 kg/gallon LGOP v1 Table G.9<br />
<strong>Gas</strong>oline<br />
Diesel<br />
CH 4 Default Varies by model year LGOP v1 Table G.10<br />
N 2 O Default Varies by model year LGOP v1 Table G.10<br />
HFCs<br />
PFCs<br />
SF 6<br />
CO 2 e<br />
CO 2 Default 10.15 kg/gallon LGOP v1 Table G.9<br />
CH 4 Default Varies by model year LGOP v1 Table G.10<br />
N 2 O Default Varies by model year LGOP v1 Table G.10<br />
HFCs<br />
PFCs<br />
SF 6<br />
Fugitive <strong>Emissions</strong><br />
<strong>Emissions</strong> Source Name GHG Default/Alternate Emission Factor Emission Factor Sources and References<br />
Refrigerants R134-A None GWP-1,300<br />
LGOP v1 Table<br />
E.1&E.2<br />
WASTE GENERATION (Scope 3)<br />
SCOPE 3<br />
<strong>Emissions</strong> Source NameGHG Default/Alternate Emission Factor Emission Factor Sources and References<br />
Generated Waste CH 4 Alternate Varies by waste type<br />
INFORMATION ITEMS<br />
EPA Waste<br />
Reduction Model<br />
http://www.epa.gov/cl<br />
imatechange/wycd/w<br />
aste/calculators/War<br />
m_home.html; Public<br />
Administration waste<br />
charaterization<br />
provided by CIWMB<br />
Stationary Combustion<br />
<strong>Emissions</strong> Source NameGHG Default/Alternate Emission Factor Emission Factor Sources and References<br />
http://www.epa.gov/o<br />
Ozone Depleting<br />
R-22 None GWP-1,700<br />
zone/science/ods/cla<br />
Refrigerants<br />
ssone.html<br />
POSSIBLE SOURCES OF OPTIONAL SCOPE 3 EMISSIONS<br />
Employee Commute<br />
Employee Business Travel<br />
<strong>Emissions</strong> From Contracted Services<br />
Upstream Production <strong>of</strong> Materials and Fuels<br />
Upstream and Downstream Transportation <strong>of</strong> Materials and Fuels<br />
Waste Related Scope 3 <strong>Emissions</strong><br />
Purchase <strong>of</strong> Electricity Sold to an End User<br />
Transmission and Distribution Losses from Consumed Electricity<br />
Other Scope 3<br />
POSSIBLE INFORMATION ITEMS<br />
Biogenic C0 2 from Combustion<br />
Carbon Offsets Purchased<br />
Carbon Offsets Sold<br />
Renewable Energy Credits (Green Power) Purchased<br />
Renewable Energy Credits Sold (GreenPower)<br />
Ozone-depleting Refrigerants/Fire Suppressants not in LGOP<br />
Other Information Items<br />
<strong>2005</strong>/<strong>2006</strong> <strong>San</strong> <strong>Diego</strong> <strong>County</strong> <strong>Greenhouse</strong> <strong>Gas</strong> <strong>Emissions</strong> <strong>Inventory</strong> XII
Appendix C:<br />
Government-Generated Solid Waste<br />
Methodology<br />
<strong>Emissions</strong> from the waste sector are an estimate <strong>of</strong> methane generation that will result from the anaerobic<br />
decomposition <strong>of</strong> all organic waste sent to landfill in the base year. It is important to note that although these<br />
emissions are attributed to the inventory year in which the waste is generated, the emissions themselves will occur<br />
over the 100+ year timeframe that the waste will decompose. This frontloading <strong>of</strong> emissions is the approach taken<br />
by EPA’s Waste Reduction Model (WARM). Attributing all future emissions to the year in which the waste was<br />
generated incorporates all emissions from actions taken during the inventory year into that year’s greenhouse gas<br />
release. This facilitates comparisons <strong>of</strong> the impacts <strong>of</strong> actions taken between inventory years and between<br />
jurisdictions. It also simplifies the analysis <strong>of</strong> the impact <strong>of</strong> actions taken to reduce waste generation or divert it<br />
from landfills.<br />
C.1 Estimating Waste Tonnages from the <strong>County</strong> <strong>of</strong> <strong>San</strong> <strong>Diego</strong>’s Operations<br />
Like most local governments, the <strong>County</strong> <strong>of</strong> <strong>San</strong> <strong>Diego</strong> does not directly track the amount <strong>of</strong> waste generated from<br />
its operations. Therefore, to estimate the amount <strong>of</strong> waste generated, ICLEI used (1) waste haul information derived<br />
from contracts with waste haulers and (2) directly weighed waste information provided by Allied Waste for<br />
compacted waste from <strong>San</strong> <strong>Diego</strong> <strong>County</strong> in <strong>2006</strong>. The information on the amount <strong>of</strong> waste from the second method<br />
is an accurate accounting; however, the amount <strong>of</strong> waste from the first method had to be estimated by compiling<br />
pick-up accounts. Garbage trucks do not weigh waste at each pick-up; therefore, it is not possible to directly track<br />
disposal figures in mass per facility. Mass <strong>of</strong> waste generation was estimated using volumetric container size<br />
(gallons, yards, etc.) data, along with pick-up frequency and average fill <strong>of</strong> containers. These data produced a<br />
comprehensive annual volumetric figure, which was then converted to mass using standard conversion factors<br />
supplied by the California Integrated Waste Management Board (CIWMB).<br />
C.2 <strong>Emissions</strong> Calculation Methods<br />
As some types <strong>of</strong> waste (e.g., paper, plant debris, food scraps, etc.) generate methane within the anaerobic<br />
environment <strong>of</strong> a landfill and others do not (e.g., metal, glass, etc.), it is important to characterize the various<br />
components <strong>of</strong> the waste stream. Waste characterization for government-generated solid waste was estimated using<br />
the CIWMB’s 2004 statewide waste characterization study. 27<br />
27 CIWMB Waste Characterization Study-Public Administration Group available at http://www.ciwmb.ca.gov/WasteChar/BizGrpCp.asps.<br />
<strong>2005</strong>/<strong>2006</strong> <strong>San</strong> <strong>Diego</strong> <strong>County</strong> <strong>Greenhouse</strong> <strong>Gas</strong> <strong>Emissions</strong> <strong>Inventory</strong> XIII
Most landfills in the <strong>San</strong> <strong>Diego</strong> region capture methane emissions either for energy generation or for flaring. EPA<br />
estimates that 60 percent to 80 percent 28 <strong>of</strong> total methane emissions are recovered at the landfills to which <strong>San</strong><br />
<strong>Diego</strong> <strong>County</strong> sends its waste. Following the recommendation <strong>of</strong> LGOP, ICLEI adopted a 75 percent methane<br />
recovery factor.<br />
Recycling and composting programs are reflected in the emissions calculations as reduced total tonnage <strong>of</strong> waste<br />
going to the landfills. The model, however, does not capture the associated emissions reductions in “upstream”<br />
energy use from recycling as part <strong>of</strong> the inventory. 29 This is in-line with the “end-user” or “tailpipe” approach taken<br />
throughout the development <strong>of</strong> this inventory. It is important to note that, recycling and composting programs can<br />
have a significant impact on greenhouse gas emissions when a full lifecycle approach is taken. Manufacturing<br />
products with recycled materials avoids emissions from the energy that would have been used during extraction,<br />
transporting and processing <strong>of</strong> virgin material.<br />
C.2.1 Methane Commitment Method<br />
CO 2 e emissions from waste disposal were calculated using the methane commitment method outlined in the EPA<br />
WARM model. This model has the following general formula:<br />
CO 2 e = W t * (1-R)A<br />
Where:<br />
W t is the quantity <strong>of</strong> waste type “t”<br />
R is the methane recovery factor,<br />
A is the CO 2 e emissions <strong>of</strong> methane per metric ton <strong>of</strong> waste at the disposal site (the methane factor)<br />
While the WARM model <strong>of</strong>ten calculates upstream emissions, as well as carbon sequestration in the landfill, these<br />
dimensions <strong>of</strong> the model were omitted for this particular study for two reasons:<br />
This inventory functions on an end-use analysis, rather than a life-cycle analysis, which would calculate upstream<br />
emissions), and this inventory solely identifies emissions sources, and no potential sequestration “sinks.”<br />
28 AP 42, section 2.4 Municipal Solid Waste, 2.4-6, http://www.epa.gov/ttn/chief/ap42/index.html<br />
29 “Upstream” emissions include emissions that may not occur in your jurisdiction resulting from manufacturing or harvesting virgin<br />
materials and transportation <strong>of</strong> them.<br />
<strong>2005</strong>/<strong>2006</strong> <strong>San</strong> <strong>Diego</strong> <strong>County</strong> <strong>Greenhouse</strong> <strong>Gas</strong> <strong>Emissions</strong> <strong>Inventory</strong> XIV
Appendix D:<br />
Community <strong>Inventory</strong> Methodology<br />
This appendix expands on the description <strong>of</strong> methodology provided in Section 2, describing in more detail the data<br />
sources and processes used to calculate emissions in the community inventory.<br />
D.1 Overview <strong>of</strong> <strong>Inventory</strong> Contents and Approach<br />
The community inventory describes emissions <strong>of</strong> the major greenhouse gases from the residential,<br />
commercial/industrial, transportation, solid waste, and wastewater sectors. As explained in Section 2, emissions are<br />
calculated by multiplying activity data—such as kilowatt hours or gallons <strong>of</strong> gasoline consumed—by emissions<br />
factors, which provide the quantity <strong>of</strong> emissions per unit <strong>of</strong> activity. Activity data is typically available from electric<br />
and gas utilities, planning and transportation agencies and air quality regulatory agencies. <strong>Emissions</strong> factors are<br />
drawn from a variety <strong>of</strong> sources, including the California Climate Action Registry, the Local Governments<br />
Operations Protocol, and air quality models produced by the California Air Resources Board (CARB).<br />
In this inventory, all GHG emissions are converted into carbon dioxide equivalent units, or CO 2 e, per guidance in<br />
the Local Government Operations Protocol (LGOP). The LGOP provides standard factors to convert various<br />
greenhouse gases into carbon dioxide equivalent units; these factors are known as Global Warming Potential<br />
factors, representing the ratio <strong>of</strong> the heat-trapping ability <strong>of</strong> each greenhouse gas relative to that <strong>of</strong> carbon dioxide.<br />
The community inventory methodology is based on guidance from ICLEI’s draft International Local Government<br />
GHG <strong>Emissions</strong> Analysis Protocol (IEAP), as well as methods utilized in the <strong>San</strong> <strong>Diego</strong> <strong>County</strong> <strong>Greenhouse</strong> <strong>Gas</strong><br />
<strong>Inventory</strong> produced by the University <strong>of</strong> <strong>San</strong> <strong>Diego</strong>’s Energy Policy Initiatives Center (EPIC)—which evaluated<br />
emissions <strong>County</strong>-wide, both incorporated and unincorporated—and methods used in ongoing climate change<br />
planning work at SANDAG.<br />
D.1.1 <strong>Emissions</strong> Sources Included and Excluded<br />
In general, local jurisdictions should seek to measure all emissions <strong>of</strong> the six Kyoto Protocol greenhouse gases 30<br />
occurring within the jurisdictional boundaries. In practice, this level <strong>of</strong> detail may not be feasible for the local<br />
jurisdiction. The table below describes sources included in this community inventory, followed by sources that<br />
were excluded:<br />
30 CO 2, CH 4, N 2 O, SF 6 , perfluorocarbons (PFCs) and hydr<strong>of</strong>luorocarbons (HFCs)<br />
<strong>2005</strong>/<strong>2006</strong> <strong>San</strong> <strong>Diego</strong> <strong>County</strong> <strong>Greenhouse</strong> <strong>Gas</strong> <strong>Emissions</strong> <strong>Inventory</strong> XV
Sector <strong>Emissions</strong> Source Sector <strong>Emissions</strong> Source<br />
Residential<br />
Bundled Electricity<br />
Direct Access Electricity<br />
Bundled Natural <strong>Gas</strong><br />
Direct Access Natural <strong>Gas</strong><br />
On-Road Transportation<br />
Travel on Local/Regional Roads<br />
Travel on State Highways<br />
Bundled Electricity<br />
Transportation<br />
Off-Road Sources<br />
Commercial<br />
/ Industrial<br />
Direct Access Electricity<br />
Bundled Natural <strong>Gas</strong><br />
Direct Access Natural <strong>Gas</strong><br />
Lawn and Garden Equipment<br />
Construction Equipment<br />
Industrial Equipment<br />
Solid Waste<br />
Community-generated Solid Waste<br />
Light Commercial Equipment<br />
Landfill Waste-in-Place Wastewater Community-generated Wastewater<br />
Local governments will <strong>of</strong>ten choose to exclude emissions sources that meet the following criteria:<br />
• Below the significance threshold. In the ICLEI reporting standard, emissions sources can be excluded<br />
from the analysis (e.g. are “de minimis”) if, when combined, the excluded emissions total less than 5%<br />
<strong>of</strong> the total <strong>of</strong> the emissions from the Community or Government <strong>Inventory</strong>. 31<br />
• Insufficient data or accepted standard methodology. The science is still evolving in many sectors,<br />
and accurate records or standards for measuring emissions are not always available. Examples include<br />
non-combustion industrial emissions sources or emissions from composting activities.<br />
• <strong>Emissions</strong> largely located outside the jurisdiction’s boundaries. These types <strong>of</strong> emissions could<br />
include such sources as aviation departing from local airports or regional transit emissions.<br />
In this inventory, the following emissions were below the significance threshold and were not included:<br />
• SF 6, perfluorocarbons (PFCs), and hydr<strong>of</strong>luorocarbon (HFCs) emissions<br />
• N 2 O emissions from transportation<br />
• <strong>Emissions</strong> <strong>of</strong> minor <strong>of</strong>f-road sources (those not included in the table above)<br />
• Stationary emissions from propane and diesel fuels<br />
31 Note: an inventory should include at least 95% <strong>of</strong> the emissions released by the government and community as a whole.<br />
Therefore, if a large number <strong>of</strong> small emissions sources occur within the jurisdiction, they cannot all be ignored.<br />
<strong>2005</strong>/<strong>2006</strong> <strong>San</strong> <strong>Diego</strong> <strong>County</strong> <strong>Greenhouse</strong> <strong>Gas</strong> <strong>Emissions</strong> <strong>Inventory</strong> XVI
• Non-combustion industrial emissions sources<br />
The following sources were excluded because they occurred largely outside the jurisdiction’s boundaries:<br />
• Aviation<br />
• Rail<br />
• Regional public transit<br />
D.2 <strong>Emissions</strong> Forecast<br />
This inventory includes a “business-as-usual” forecast to 2020, estimating emissions that will occur if no new<br />
emissions reduction policies are implemented. The forecast is based on household, population, and job projections<br />
from SANDAG’s 2030 Regional Growth Forecast Update. As a business-as-usual projection, the forecast does not<br />
take into account legislation or regulation currently under development, and relies on demographic data as the basis<br />
for estimating growth in each sector. The forecasting approach varies for each sector:<br />
• Residential emissions are based on projected growth in local jurisdiction households.<br />
• Commercial / industrial sector emissions are correlated with forecasted job growth in the local<br />
jurisdiction.<br />
• Transportation emissions are based on projected growth rates in regional vehicle miles traveled<br />
associated with SANDAG’s Regional Transportation Plan 2030.<br />
• Solid waste and wastewater emissions are correlated with forecasted population growth in the local<br />
jurisdiction.<br />
D.3 The Built Environment: Residential, Commercial, and Industrial Sectors<br />
Electricity and natural gas sold to <strong>San</strong> <strong>Diego</strong> <strong>Gas</strong> & Electric customers as bundled service (both energy generation<br />
and transmission/distribution) was provided by Benjamin Lopez at SDG&E. Direct access electricity and natural<br />
gas was also provided by SDG&E, which records the direct access resources that are distributed through its grid.<br />
Bundled SDG&E electricity emissions were calculated in ICLEI’s CACP s<strong>of</strong>tware using SDG&E-specific<br />
emissions factors provided by the California Climate Action Registry. Direct access electricity consumption was<br />
calculated in CACP using EPA eGrid emissions factors for the WECC California eGrid subregion. All natural gas<br />
emissions were calculated in CACP with default emissions factors from the Local Government Operations<br />
Protocol.<br />
<strong>2005</strong>/<strong>2006</strong> <strong>San</strong> <strong>Diego</strong> <strong>County</strong> <strong>Greenhouse</strong> <strong>Gas</strong> <strong>Emissions</strong> <strong>Inventory</strong> XVII
D.4 On-road Transportation and Off-road Mobile Sources<br />
D.4.1 On-road Transportation<br />
On-road transportation emissions were derived from local jurisdiction vehicle miles traveled (VMT) data and<br />
regional vehicle and travel characteristics. Observed <strong>2005</strong> VMT on non-state facilities (referred to in the inventory<br />
as “local roads”) was obtained from Caltrans’ Highway Performance Monitoring System reports. VMT on state<br />
highways in the local jurisdiction was derived from a GIS shapefile output from the SANDAG transportation<br />
model, which is the basis <strong>of</strong> air quality reporting associated with the Regional Transportation Plan. For state<br />
highway segments that crossed jurisdictional boundaries, the segments were clipped in GIS and only the portion<br />
within the boundaries was accounted for.<br />
The EMFAC2007 model developed by CARB was used to calculate emissions from these VMT figures. EMFAC<br />
defaults for <strong>San</strong> <strong>Diego</strong> <strong>County</strong> include regionally-specific information on the mix <strong>of</strong> vehicle classes and model<br />
years, as well as ambient conditions and travel speeds, that determine fuel efficiency. The model estimates carbon<br />
dioxide and methane emissions from these factors and inputted vehicle activity data.<br />
Because inputting local VMT without changing regional defaults for vehicle population and vehicle trips would<br />
result in an over-estimation <strong>of</strong> emissions, regionally-specific ratios <strong>of</strong> VMT to vehicle population and trips were<br />
held constant.<br />
EMFAC outputs are reported in short tons per day. Results were converted to metric tons per year. Because state<br />
highway VMT and associated emissions were based on average weekday traffic volumes, a 5-day to 7-day<br />
conversion factor was obtained from Caltrans and applied to the output to allow for annualizing. 32 Methane<br />
emissions were converted to carbon dioxide equivalent units based on the Global Warming Potential factor from<br />
LGOP.<br />
D.4.2 Off-road Mobile Sources<br />
Off-road emissions were obtained from the CARB OFFROAD2007 model. The model was run using default<br />
equipment population, usage, and efficiency data for <strong>San</strong> <strong>Diego</strong> <strong>County</strong>. <strong>Emissions</strong> outputs were scaled to the local<br />
jurisdiction level by population share. Results were converted from short tons per day to metric tons per year.<br />
Methane and nitrous oxide emissions were converted to carbon dioxide equivalent units based on the Global<br />
Warming Potential factors from LGOP.<br />
32 Provided by Kim Sturmer, Caltrans. The 2008 5-day to 7-day factor (only available) for state highways is 0.94.<br />
<strong>2005</strong>/<strong>2006</strong> <strong>San</strong> <strong>Diego</strong> <strong>County</strong> <strong>Greenhouse</strong> <strong>Gas</strong> <strong>Emissions</strong> <strong>Inventory</strong> XVIII
D.5 Solid Waste<br />
<strong>Emissions</strong> from solid waste were captured in two ways: emissions from landfills located in the jurisdiction in the<br />
base year (“landfill waste-in-place”), and future emissions from decomposition <strong>of</strong> waste generated in the local<br />
jurisdiction in the base year (“community-generated solid waste”).<br />
D.5.1 Landfill Waste-in-Place<br />
Methane emissions for <strong>County</strong> operated landfills (Bonsall, Valley Center and Jamacha) were based on observed<br />
emissions that were provided by <strong>San</strong> <strong>Diego</strong> <strong>County</strong> for a <strong>2006</strong> proxy year. For the other two landfills (Ramona and<br />
Borrego) that are not operated by the <strong>County</strong> emission data was obtained from CARB, which utilized a First Order<br />
Decay Model (FOD) to estimate emissions from waste disposal facilities located within the <strong>County</strong>. 33 The FOD<br />
incorporates data on waste disposal and facility conditions extending back several decades to calculate methane and<br />
carbon dioxide equivalent emissions. Data were not available for several inactive facilities in unincorporated <strong>San</strong><br />
<strong>Diego</strong> <strong>County</strong> that were closed prior to reporting regulations came into effect; emissions from these facilities were<br />
not reported.<br />
D.5.2 Community-Generated Solid Waste<br />
Community-generated solid waste emissions were calculated in CACP using waste disposal data obtained from the<br />
California Integrated Waste Management Board Disposal Reporting System, which records tonnages <strong>of</strong> municipal<br />
solid waste and alternative daily cover by local jurisdiction. <strong>Emissions</strong> were calculated using the same<br />
methodology as described in Appendix D for government-generated solid waste.<br />
D.6 Wastewater<br />
This inventory utilizes wastewater emissions estimates from the EPIC <strong>San</strong> <strong>Diego</strong> <strong>County</strong> inventory. EPIC obtained<br />
a per capita wastewater emissions estimate from CARB for <strong>2005</strong>. This figure was reduced to account for biogas<br />
capture at regional wastewater facilities using gas capture data provided by the <strong>San</strong> <strong>Diego</strong> <strong>County</strong> Air Pollution<br />
Control District. For the purposes <strong>of</strong> this inventory, this per capita <strong>County</strong>-wide emissions rate was scaled to the<br />
local jurisdiction level by population share.<br />
33 Provided by Larry Hunsaker, CARB, on November 27, 2007. This data is embedded in the community master data file<br />
provided to the local jurisdiction with this report.<br />
<strong>2005</strong>/<strong>2006</strong> <strong>San</strong> <strong>Diego</strong> <strong>County</strong> <strong>Greenhouse</strong> <strong>Gas</strong> <strong>Emissions</strong> <strong>Inventory</strong> XIX
Appendix E:<br />
Conducting a Monitoring <strong>Inventory</strong><br />
The purpose <strong>of</strong> this appendix is to assist <strong>San</strong> <strong>Diego</strong> <strong>County</strong> staff in conducting a monitoring inventory to measure<br />
progress against the baseline established in this inventory report. Conducting such an inventory represents milestone<br />
five <strong>of</strong> the Five- Milestone Process, and allows a local government to assess how well it is progressing toward<br />
achieving its emissions reduction targets.<br />
This inventory was conducted by ICLEI in conjunction with the Advance Planning Group in the Department <strong>of</strong><br />
Planning and Land Use at the <strong>County</strong> <strong>of</strong> <strong>San</strong> <strong>Diego</strong>, who provided resources and assisted in gathering data for the<br />
inventory. To facilitate a monitoring inventory, ICLEI has documented all <strong>of</strong> the raw data, data sources, and<br />
calculation methods used in this inventory. Future inventories should seek to replicate or improve upon the data and<br />
methods used in this inventory. Wherever possible, however, ICLEI strongly recommends institutionalizing internal<br />
data collection in order to be able to meet the recommended methods outlined in LGOP.<br />
E.1 ICLEI Tools for Local Governments<br />
ICLEI has created a number <strong>of</strong> tools for the <strong>County</strong> <strong>of</strong> <strong>San</strong> <strong>Diego</strong> to use to assist them in future monitoring<br />
inventories. These tools are designed to work in conjunction with LGOP, which is, and will remain, the primary<br />
reference document for conducting an emissions inventory. These tools include:<br />
• A “master data sheet” that contains most or all <strong>of</strong> the raw data (including emails), data sources,<br />
emissions calculations, data templates, notes on inclusions and exclusions, and reporting tools (charts<br />
and graphs and the excel version <strong>of</strong> LGOP reporting tool).<br />
• A copy <strong>of</strong> all electronic raw data, such as finance records or Excel spreadsheets.<br />
• LGOP reporting tool (included in the master data sheet and in Appendix B) that has all activity data,<br />
emissions factors, and methods used to calculate emissions for this inventory.<br />
• Sector-specific instructions that discuss the types <strong>of</strong> emissions, emissions calculations methods, and<br />
data required to calculate emissions from each sector, as well as instructions for using the data<br />
collection tools and calculators in the master data sheet.<br />
• The appendices in this report include detailed methodology for calculating emissions from Scope 3<br />
government-generated solid waste.<br />
<strong>2005</strong>/<strong>2006</strong> <strong>San</strong> <strong>Diego</strong> <strong>County</strong> <strong>Greenhouse</strong> <strong>Gas</strong> <strong>Emissions</strong> <strong>Inventory</strong> XX
It is also important to note that all ICLEI members receive on-demand technical assistance from their ICLEI liaison,<br />
which local staff should feel free to contact at any point during this process.<br />
E.2 Relationship to Other <strong>San</strong> <strong>Diego</strong> Regional Climate Protection Initiative<br />
Inventories<br />
While the emissions inventories for the 10 participating local governments were conducted simultaneously using the<br />
same tools, a local government operations inventory is based on data specific to each local government’s operations.<br />
For this reason, data must be collected internally within each local government, and the availability <strong>of</strong> data (and thus<br />
emissions estimation methods) will vary between local governments.<br />
That said, local governments in the <strong>San</strong> <strong>Diego</strong> Regional Climate Protection Initiative may benefit by cooperating<br />
during the re-inventorying process. For example, by coordinating inventories, they may be able to hire a team <strong>of</strong><br />
interns to collectively perform the inventories – saving money in the process. In addition, local staff may be able to<br />
learn from each other during the process or conduct group training sessions if necessary. As a whole, the Climate<br />
Protection Initiative provides the basis for a continuing regional platform for climate actions, and ICLEI<br />
recommends taking advantage <strong>of</strong> this opportunity during all climate actions, including conducting future greenhouse<br />
gas emissions inventories.<br />
E.3 Improving <strong>Emissions</strong> Estimates<br />
One <strong>of</strong> the benefits <strong>of</strong> a local government operations inventory is that local government staff can identify areas in<br />
their current data collection systems where data collection can be improved. For example, a local government may<br />
not directly track fuel consumption by each vehicle and instead will rely upon estimates based upon VMT or<br />
purchased fuel to calculate emissions. This affects both the accuracy <strong>of</strong> the emissions estimate and may have other<br />
implications for government operations as a whole.<br />
During the inventory process, ICLEI and local government staff identified the following gaps in data that, if<br />
resolved, would allow the <strong>County</strong> <strong>of</strong> <strong>San</strong> <strong>Diego</strong> to meet the recommended methods outlined in LGOP in future<br />
inventories.<br />
• Direct tracking <strong>of</strong> refrigerants recharged into vehicle fleet<br />
• Fuel consumption by mobile equipment<br />
• Fuel consumption by diesel and other generators<br />
• Tracking <strong>of</strong> emissions by wastewater treatment facilities<br />
• Tracking <strong>of</strong> employee commutes<br />
ICLEI encourages staff to review the areas <strong>of</strong> missing data and establish data collection systems for this data as part<br />
<strong>of</strong> normal operations. In addition, some information gathering methods could be improved, such as complete<br />
<strong>2005</strong>/<strong>2006</strong> <strong>San</strong> <strong>Diego</strong> <strong>County</strong> <strong>Greenhouse</strong> <strong>Gas</strong> <strong>Emissions</strong> <strong>Inventory</strong> XXI
ecords <strong>of</strong> vehicle miles traveled by each vehicle. In this way, when staff are ready to re-inventory for a future year,<br />
they will have the proper data to make a more accurate emissions estimate.<br />
E.4 Conducting the <strong>Inventory</strong><br />
ICLEI recommends the following approach for <strong>San</strong> <strong>Diego</strong> Regional Climate Protection Initiative local governments<br />
that wish to conduct a monitoring inventory:<br />
Step 1: Identify a Climate Steward<br />
This steward will be responsible for the jurisdiction’s climate actions as a whole and could serve as an ICLEI liaison<br />
in all future climate work. In the context <strong>of</strong> a monitoring inventory, the steward will be responsible for initiating<br />
discussions on a new inventory.<br />
Step 2: Determine which Sectors to <strong>Inventory</strong><br />
There are many ways to determine which sectors apply to a local government’s operations, but the easiest to review<br />
will be LGOP Standard Report, which is located both in Appendix B and in the master data sheet. This document<br />
clearly delineates which sectors will need to be inventoried within a local government’s operations and which<br />
LGOP sectors do not apply to a jurisdiction.<br />
Step 3: Gather Support: Identify Data Gathering Team and Leads<br />
Coordination and acceptance among all participating departments is an important factor in coordinating a successful<br />
inventory. To that end, the inventory coordinator should work with the <strong>County</strong> administrator to identify all staff<br />
who will need to be part <strong>of</strong> the inventory. To facilitate this process, ICLEI has documented all people associated<br />
with the inventory in the master data sheet—these names are located in the final completed data form for each<br />
sector. Once this team has been identified, the inventory coordinator should hold a kick<strong>of</strong>f meeting with the<br />
administrator, all necessary staff, and relevant department heads which clearly communicates the priority <strong>of</strong> the<br />
inventory in relationship to competing demands. At this meeting, the roles <strong>of</strong> each person, including the inventory<br />
coordinator, should be established.<br />
Step 4: Review Types <strong>of</strong> <strong>Emissions</strong> and Available Methodologies for Applicable Sectors<br />
Local staff should then review LGOP and the instructions documents provided through this inventory to better<br />
understand the types <strong>of</strong> emissions for each sector (for example, within Mobile <strong>Emissions</strong>, CO 2 emissions and<br />
CH 4 /N 2 O emissions represent two different data requirements and emissions calculations methodologies). Each<br />
emissions type may have more than one possible estimation methodology, and it is important that the inventory<br />
coordinator understands all possible methodologies and be able to communicate this to all parties assisting in the<br />
data gathering.<br />
<strong>2005</strong>/<strong>2006</strong> <strong>San</strong> <strong>Diego</strong> <strong>County</strong> <strong>Greenhouse</strong> <strong>Gas</strong> <strong>Emissions</strong> <strong>Inventory</strong> XXII
Step 5: Review Methodologies Used for the <strong>2006</strong> <strong>Inventory</strong> to Determine Data to Collect<br />
In order to duplicate or improve upon the methods used in this inventory, local staff should again review the<br />
methods used for this inventory—these methods are again located in Appendix B—and within the master data sheet.<br />
These methods reflect the data limitations for each local government (as many local governments could not obtain<br />
data necessary to meet the recommended methods in LGOP). Wherever possible, these methods should be<br />
duplicated or, if it is possible, replaced with the recommended methods outlined in LGOP. Using these<br />
methodologies, staff will determine what data needs to be collected and communicate this effectively to the data<br />
gathering team.<br />
Step 6: Begin Data Collection<br />
With the exception <strong>of</strong> electricity and natural gas for stationary sources, all data collection will be internal. To obtain<br />
stationary source energy consumption data, staff will need to contact the ICLEI representative to determine who the<br />
contact is for SDG&E data (other utilities will need to be contacted directly).<br />
Step 7: Use the Data Forms as a Resource During Data Gathering<br />
A number <strong>of</strong> questions will come up during the data gathering process that may be difficult to answer. ICLEI has<br />
attempted to capture all <strong>of</strong> the questions that arose during the <strong>2006</strong> inventory and how they were addressed through<br />
the master data sheet. Within the master data sheet, staff should review the raw data, working data, and completed<br />
data forms to review how raw data was converted to final data, and also to review any notes taken by ICLEI staff<br />
during the <strong>2006</strong> inventory process.<br />
For example, reviewing the stationary sources SDG&E data within the master data sheet will allow local staff to<br />
review how individual accounts were separated into each category and which counts may have been excluded from<br />
the inventory.<br />
Step 8: Use <strong>Emissions</strong> S<strong>of</strong>tware to Calculate <strong>Emissions</strong><br />
ICLEI has provided the staff lead on the <strong>2006</strong> inventory with a backup <strong>of</strong> the s<strong>of</strong>tware used to calculate many <strong>of</strong> the<br />
emissions included in this report. Staff should use this (or more current ICLEI s<strong>of</strong>tware) to calculate emissions by<br />
inputting the activity data into the s<strong>of</strong>tware. ICLEI staff and ICLEI trainings are available to assist local government<br />
staff in calculating emissions.<br />
Step 9: Report <strong>Emissions</strong><br />
The master data sheet also contains the LGOP Standard Reporting Template, which is the template adopted by<br />
CARB as the <strong>of</strong>ficial reporting template for government operations emissions inventory. This tool, as well as the<br />
<strong>2005</strong>/<strong>2006</strong> <strong>San</strong> <strong>Diego</strong> <strong>County</strong> <strong>Greenhouse</strong> <strong>Gas</strong> <strong>Emissions</strong> <strong>Inventory</strong> XXIII
charts and graphs tool provided by ICLEI can be used to report emissions from government operations. Also, local<br />
government staff should utilize this narrative report as guide for a narrative report if they so choose.<br />
Step 10: Standardize and Compare to Base Year<br />
Conducting a monitoring inventory is meant to serve as a measuring point against the baseline year represented in<br />
this report. In order to make a more accurate comparison, it is necessary to standardize emissions from stationary<br />
sources based upon heating and cooling degree days (staff can use a ratio <strong>of</strong> heating /cooling degree days to<br />
standardize across years).<br />
In addition, it is important, when comparing emissions across years, to clearly understand where emissions levels<br />
may have changed due to a change in methodology or due to excluding an emissions source. For example, if the<br />
default method was used to estimate refrigerant leakage in <strong>2006</strong> (this method highly overestimates these emissions),<br />
and the recommended method was available in a monitoring year, this would appear as a dramatic reduction in these<br />
emissions even though actual leaked refrigerants may be similar to the base year. Changes such as these should not<br />
be seen as progress toward or away from an emissions reduction target, but emissions estimates should be adjusted<br />
to create as much <strong>of</strong> an apples-to-apples comparison as possible. If such an adjustment is not possible, staff should<br />
clearly note the change in methodology between years when comparing emissions.<br />
<strong>2005</strong>/<strong>2006</strong> <strong>San</strong> <strong>Diego</strong> <strong>County</strong> <strong>Greenhouse</strong> <strong>Gas</strong> <strong>Emissions</strong> <strong>Inventory</strong> XXIV