County of San Diego 2005/2006 Greenhouse Gas Emissions Inventory
County of San Diego 2005/2006 Greenhouse Gas Emissions Inventory
County of San Diego 2005/2006 Greenhouse Gas Emissions Inventory

You also want an ePaper? Increase the reach of your titles
YUMPU automatically turns print PDFs into web optimized ePapers that Google loves.
4.2.3 Transportation Sector<br />
As with many other local governments, transportation within the jurisdictional boundaries <strong>of</strong> unincorporated <strong>San</strong><br />
<strong>Diego</strong> <strong>County</strong> constitutes the greatest percentage (69 percent) <strong>of</strong> community wide greenhouse gas emissions –<br />
2,909,342 metric tons CO 2 e.<br />
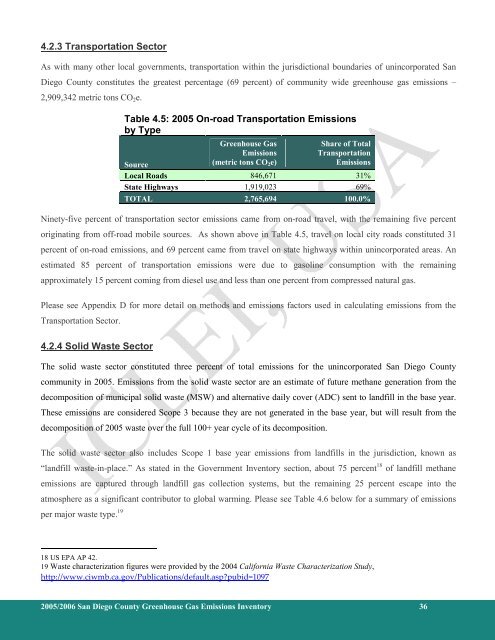
Table 4.5: <strong>2005</strong> On-road Transportation <strong>Emissions</strong><br />
by Type<br />
<strong>Greenhouse</strong> <strong>Gas</strong><br />
<strong>Emissions</strong><br />
(metric tons CO 2 e)<br />
Share <strong>of</strong> Total<br />
Transportation<br />
<strong>Emissions</strong><br />
Source<br />
Local Roads 846,671 31%<br />
State Highways 1,919,023 69%<br />
TOTAL 2,765,694 100.0%<br />
Ninety-five percent <strong>of</strong> transportation sector emissions came from on-road travel, with the remaining five percent<br />
originating from <strong>of</strong>f-road mobile sources. As shown above in Table 4.5, travel on local city roads constituted 31<br />
percent <strong>of</strong> on-road emissions, and 69 percent came from travel on state highways within unincorporated areas. An<br />
estimated 85 percent <strong>of</strong> transportation emissions were due to gasoline consumption with the remaining<br />
approximately 15 percent coming from diesel use and less than one percent from compressed natural gas.<br />
Please see Appendix D for more detail on methods and emissions factors used in calculating emissions from the<br />
Transportation Sector.<br />
4.2.4 Solid Waste Sector<br />
The solid waste sector constituted three percent <strong>of</strong> total emissions for the unincorporated <strong>San</strong> <strong>Diego</strong> <strong>County</strong><br />
community in <strong>2005</strong>. <strong>Emissions</strong> from the solid waste sector are an estimate <strong>of</strong> future methane generation from the<br />
decomposition <strong>of</strong> municipal solid waste (MSW) and alternative daily cover (ADC) sent to landfill in the base year.<br />
These emissions are considered Scope 3 because they are not generated in the base year, but will result from the<br />
decomposition <strong>of</strong> <strong>2005</strong> waste over the full 100+ year cycle <strong>of</strong> its decomposition.<br />
The solid waste sector also includes Scope 1 base year emissions from landfills in the jurisdiction, known as<br />
“landfill waste-in-place.” As stated in the Government <strong>Inventory</strong> section, about 75 percent 18 <strong>of</strong> landfill methane<br />
emissions are captured through landfill gas collection systems, but the remaining 25 percent escape into the<br />
atmosphere as a significant contributor to global warming. Please see Table 4.6 below for a summary <strong>of</strong> emissions<br />
per major waste type. 19<br />
18 US EPA AP 42.<br />
19 Waste characterization figures were provided by the 2004 California Waste Characterization Study,<br />
http://www.ciwmb.ca.gov/Publications/default.asp?pubid=1097<br />
<strong>2005</strong>/<strong>2006</strong> <strong>San</strong> <strong>Diego</strong> <strong>County</strong> <strong>Greenhouse</strong> <strong>Gas</strong> <strong>Emissions</strong> <strong>Inventory</strong> 36