County of San Diego 2005/2006 Greenhouse Gas Emissions Inventory
County of San Diego 2005/2006 Greenhouse Gas Emissions Inventory
County of San Diego 2005/2006 Greenhouse Gas Emissions Inventory

Create successful ePaper yourself
Turn your PDF publications into a flip-book with our unique Google optimized e-Paper software.
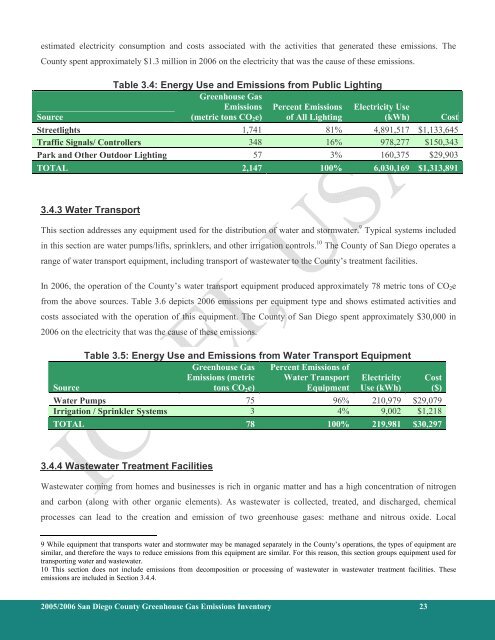
estimated electricity consumption and costs associated with the activities that generated these emissions. The<br />
<strong>County</strong> spent approximately $1.3 million in <strong>2006</strong> on the electricity that was the cause <strong>of</strong> these emissions.<br />
Table 3.4: Energy Use and <strong>Emissions</strong> from Public Lighting<br />
<strong>Greenhouse</strong> <strong>Gas</strong><br />
Source<br />
<strong>Emissions</strong><br />
(metric tons CO 2 e)<br />
Percent <strong>Emissions</strong><br />
<strong>of</strong> All Lighting<br />
Electricity Use<br />
(kWh) Cost<br />
Streetlights 1,741 81% 4,891,517 $1,133,645<br />
Traffic Signals/ Controllers 348 16% 978,277 $150,343<br />
Park and Other Outdoor Lighting 57 3% 160,375 $29,903<br />
TOTAL 2,147 100% 6,030,169 $1,313,891<br />
3.4.3 Water Transport<br />
This section addresses any equipment used for the distribution <strong>of</strong> water and stormwater. 9 Typical systems included<br />
in this section are water pumps/lifts, sprinklers, and other irrigation controls. 10 The <strong>County</strong> <strong>of</strong> <strong>San</strong> <strong>Diego</strong> operates a<br />
range <strong>of</strong> water transport equipment, including transport <strong>of</strong> wastewater to the <strong>County</strong>’s treatment facilities.<br />
In <strong>2006</strong>, the operation <strong>of</strong> the <strong>County</strong>’s water transport equipment produced approximately 78 metric tons <strong>of</strong> CO 2 e<br />
from the above sources. Table 3.6 depicts <strong>2006</strong> emissions per equipment type and shows estimated activities and<br />
costs associated with the operation <strong>of</strong> this equipment. The <strong>County</strong> <strong>of</strong> <strong>San</strong> <strong>Diego</strong> spent approximately $30,000 in<br />
<strong>2006</strong> on the electricity that was the cause <strong>of</strong> these emissions.<br />
Table 3.5: Energy Use and <strong>Emissions</strong> from Water Transport Equipment<br />
Source<br />
<strong>Greenhouse</strong> <strong>Gas</strong><br />
<strong>Emissions</strong> (metric<br />
tons CO 2 e)<br />
Percent <strong>Emissions</strong> <strong>of</strong><br />
Water Transport<br />
Equipment<br />
Electricity<br />
Use (kWh)<br />
Cost<br />
($)<br />
Water Pumps 75 96% 210,979 $29,079<br />
Irrigation / Sprinkler Systems 3 4% 9,002 $1,218<br />
TOTAL 78 100% 219,981 $30,297<br />
3.4.4 Wastewater Treatment Facilities<br />
Wastewater coming from homes and businesses is rich in organic matter and has a high concentration <strong>of</strong> nitrogen<br />
and carbon (along with other organic elements). As wastewater is collected, treated, and discharged, chemical<br />
processes can lead to the creation and emission <strong>of</strong> two greenhouse gases: methane and nitrous oxide. Local<br />
9 While equipment that transports water and stormwater may be managed separately in the <strong>County</strong>’s operations, the types <strong>of</strong> equipment are<br />
similar, and therefore the ways to reduce emissions from this equipment are similar. For this reason, this section groups equipment used for<br />
transporting water and wastewater.<br />
10 This section does not include emissions from decomposition or processing <strong>of</strong> wastewater in wastewater treatment facilities. These<br />
emissions are included in Section 3.4.4.<br />
<strong>2005</strong>/<strong>2006</strong> <strong>San</strong> <strong>Diego</strong> <strong>County</strong> <strong>Greenhouse</strong> <strong>Gas</strong> <strong>Emissions</strong> <strong>Inventory</strong> 23