County of San Diego 2005/2006 Greenhouse Gas Emissions Inventory
County of San Diego 2005/2006 Greenhouse Gas Emissions Inventory
County of San Diego 2005/2006 Greenhouse Gas Emissions Inventory

Create successful ePaper yourself
Turn your PDF publications into a flip-book with our unique Google optimized e-Paper software.
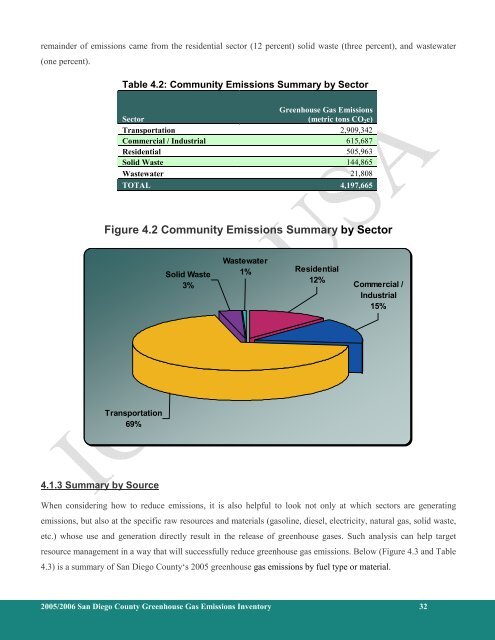
emainder <strong>of</strong> emissions came from the residential sector (12 percent) solid waste (three percent), and wastewater<br />
(one percent).<br />
Table 4.2: Community <strong>Emissions</strong> Summary by Sector<br />
<strong>Greenhouse</strong> <strong>Gas</strong> <strong>Emissions</strong><br />
Sector<br />
(metric tons CO 2 e)<br />
Transportation 2,909,342<br />
Commercial / Industrial 615,687<br />
Residential 505,963<br />
Solid Waste 144,865<br />
Wastewater 21,808<br />
TOTAL 4,197,665<br />
Figure 4.2 Community <strong>Emissions</strong> Summary by Sector<br />
Solid Waste<br />
3%<br />
Wastewater<br />
1% Residential<br />
12%<br />
Commercial /<br />
Industrial<br />
15%<br />
Transportation<br />
69%<br />
4.1.3 Summary by Source<br />
When considering how to reduce emissions, it is also helpful to look not only at which sectors are generating<br />
emissions, but also at the specific raw resources and materials (gasoline, diesel, electricity, natural gas, solid waste,<br />
etc.) whose use and generation directly result in the release <strong>of</strong> greenhouse gases. Such analysis can help target<br />
resource management in a way that will successfully reduce greenhouse gas emissions. Below (Figure 4.3 and Table<br />
4.3) is a summary <strong>of</strong> <strong>San</strong> <strong>Diego</strong> <strong>County</strong>‘s <strong>2005</strong> greenhouse gas emissions by fuel type or material.<br />
<strong>2005</strong>/<strong>2006</strong> <strong>San</strong> <strong>Diego</strong> <strong>County</strong> <strong>Greenhouse</strong> <strong>Gas</strong> <strong>Emissions</strong> <strong>Inventory</strong> 32