County of San Diego 2005/2006 Greenhouse Gas Emissions Inventory
County of San Diego 2005/2006 Greenhouse Gas Emissions Inventory
County of San Diego 2005/2006 Greenhouse Gas Emissions Inventory

Create successful ePaper yourself
Turn your PDF publications into a flip-book with our unique Google optimized e-Paper software.
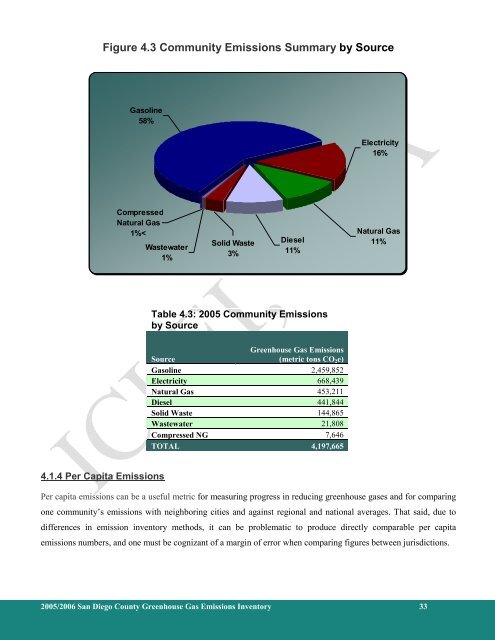
Figure 4.3 Community <strong>Emissions</strong> Summary by Source<br />
<strong>Gas</strong>oline<br />
58%<br />
Electricity<br />
16%<br />
Compressed<br />
Natural <strong>Gas</strong><br />
1%<<br />
Wastewater<br />
1%<br />
Solid Waste<br />
3%<br />
Diesel<br />
11%<br />
Natural <strong>Gas</strong><br />
11%<br />
Table 4.3: <strong>2005</strong> Community <strong>Emissions</strong><br />
by Source<br />
<strong>Greenhouse</strong> <strong>Gas</strong> <strong>Emissions</strong><br />
Source<br />
(metric tons CO 2 e)<br />
<strong>Gas</strong>oline 2,459,852<br />
Electricity 668,439<br />
Natural <strong>Gas</strong> 453,211<br />
Diesel 441,844<br />
Solid Waste 144,865<br />
Wastewater 21,808<br />
Compressed NG 7,646<br />
TOTAL 4,197,665<br />
4.1.4 Per Capita <strong>Emissions</strong><br />
Per capita emissions can be a useful metric for measuring progress in reducing greenhouse gases and for comparing<br />
one community’s emissions with neighboring cities and against regional and national averages. That said, due to<br />
differences in emission inventory methods, it can be problematic to produce directly comparable per capita<br />
emissions numbers, and one must be cognizant <strong>of</strong> a margin <strong>of</strong> error when comparing figures between jurisdictions.<br />
<strong>2005</strong>/<strong>2006</strong> <strong>San</strong> <strong>Diego</strong> <strong>County</strong> <strong>Greenhouse</strong> <strong>Gas</strong> <strong>Emissions</strong> <strong>Inventory</strong> 33