County of San Diego 2005/2006 Greenhouse Gas Emissions Inventory
County of San Diego 2005/2006 Greenhouse Gas Emissions Inventory
County of San Diego 2005/2006 Greenhouse Gas Emissions Inventory

You also want an ePaper? Increase the reach of your titles
YUMPU automatically turns print PDFs into web optimized ePapers that Google loves.
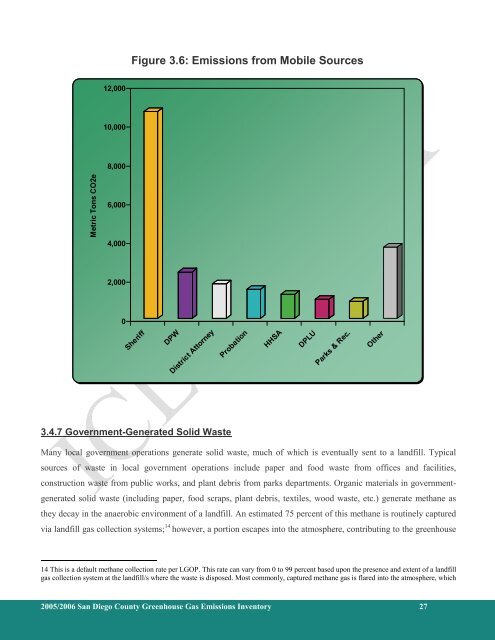
Figure 3.6: <strong>Emissions</strong> from Mobile Sources<br />
12,000<br />
10,000<br />
8,000<br />
Metric Tons CO2e<br />
6,000<br />
4,000<br />
2,000<br />
0<br />
Sheriff<br />
DPW<br />
District Attorney<br />
Probation<br />
HHSA<br />
DPLU<br />
Parks & Rec.<br />
Other<br />
3.4.7 Government-Generated Solid Waste<br />
Many local government operations generate solid waste, much <strong>of</strong> which is eventually sent to a landfill. Typical<br />
sources <strong>of</strong> waste in local government operations include paper and food waste from <strong>of</strong>fices and facilities,<br />
construction waste from public works, and plant debris from parks departments. Organic materials in governmentgenerated<br />
solid waste (including paper, food scraps, plant debris, textiles, wood waste, etc.) generate methane as<br />
they decay in the anaerobic environment <strong>of</strong> a landfill. An estimated 75 percent <strong>of</strong> this methane is routinely captured<br />
via landfill gas collection systems; 14 however, a portion escapes into the atmosphere, contributing to the greenhouse<br />
14 This is a default methane collection rate per LGOP. This rate can vary from 0 to 99 percent based upon the presence and extent <strong>of</strong> a landfill<br />
gas collection system at the landfill/s where the waste is disposed. Most commonly, captured methane gas is flared into the atmosphere, which<br />
<strong>2005</strong>/<strong>2006</strong> <strong>San</strong> <strong>Diego</strong> <strong>County</strong> <strong>Greenhouse</strong> <strong>Gas</strong> <strong>Emissions</strong> <strong>Inventory</strong> 27