Intervals of Increase and Decrease
Intervals of Increase and Decrease
Intervals of Increase and Decrease

You also want an ePaper? Increase the reach of your titles
YUMPU automatically turns print PDFs into web optimized ePapers that Google loves.
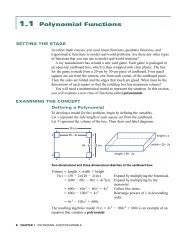
4.1 Analyzing a Polynomial Function:<br />
<strong>Intervals</strong> <strong>of</strong> <strong>Increase</strong> <strong>and</strong> <strong>Decrease</strong><br />
SETTING THE STAGE<br />
Explore the<br />
concepts in this<br />
lesson in more detail<br />
using Exploration 6 on<br />
page 570.<br />
The terms increasing <strong>and</strong> decreasing describe how a function changes over an<br />
interval. For example, the temperature usually increases from May to July <strong>and</strong><br />
decreases from October to December.<br />
The derivative <strong>of</strong> a function at a specific point is the slope <strong>of</strong> the tangent line<br />
at this point. The slopes, where the function is increasing <strong>and</strong> where it is<br />
decreasing, are different.<br />
In this section, you will use the first derivative to algebraically determine<br />
where a function is increasing or decreasing.<br />
EXAMINING THE CONCEPT<br />
Increasing <strong>and</strong> Decreasing Functions<br />
The values <strong>of</strong> y f (x) increase on<br />
the open intervals ∞ < x < a <strong>and</strong><br />
b < x < ∞. In these two intervals, the<br />
graph <strong>of</strong> y f (x) rises from left to right.<br />
The function decreases on the open<br />
interval a < x < b. In this interval, the<br />
graph falls from left to right.<br />
0<br />
y<br />
y = f(x)<br />
x<br />
a<br />
b<br />
Definition <strong>of</strong> Increasing <strong>and</strong> Decreasing Functions<br />
A function f (x) is increasing on the interval A function f (x) is decreasing on the interval<br />
I (a < x < b), if f (x 1<br />
)f (x 2<br />
) for all pairs <strong>of</strong><br />
numbers x 1<br />
<strong>and</strong> x 2<br />
in I such that x 1<br />
< x 2<br />
. numbers x 1<br />
<strong>and</strong> x 2<br />
in I such that x 1<br />
< x 2<br />
.<br />
f(x 1 )<br />
f(x 2 )<br />
f(x 2 )<br />
f(x 1 )<br />
a x 1 x 2 b<br />
Function f increases on an interval if<br />
the values <strong>of</strong> f (x) increase as x increases.<br />
a x 1 x 2 b<br />
Function f decreases on an interval if<br />
the values <strong>of</strong> f (x) decrease as x increases.<br />
268 CHAPTER 4 USING THE DERIVATIVE TO ANALYZE POLYNOMIAL FUNCTION MODELS
Example 1<br />
Determining <strong>Intervals</strong> <strong>of</strong> <strong>Increase</strong> <strong>and</strong><br />
<strong>Decrease</strong> Graphically<br />
State the intervals <strong>of</strong> increase <strong>and</strong> decrease.<br />
(a)<br />
y<br />
(b)<br />
10<br />
8<br />
6<br />
4<br />
2<br />
–10 –8 –6 –4 –2<br />
–2<br />
–4<br />
–6<br />
–8<br />
–10<br />
2 4 6 8 10<br />
x<br />
10<br />
8<br />
6<br />
4<br />
2<br />
–10 –8 –6 –4 –2<br />
–2<br />
–4<br />
–6<br />
–8<br />
–10<br />
y<br />
2 4 6 8 10<br />
x<br />
Solution<br />
(a) The graph is rising, <strong>and</strong> thus increasing, on the interval ∞ < x < 0.<br />
The graph is falling, <strong>and</strong> thus decreasing, on the interval 0 < x < ∞.<br />
The graph changes from increasing to decreasing at x 0.<br />
(b) For all values <strong>of</strong> x, the graph is always rising. Therefore, the function is<br />
increasing on the interval ∞ < x < ∞.<br />
EXAMINING THE CONCEPT<br />
Using the Derivative to Determine <strong>Intervals</strong> <strong>of</strong><br />
<strong>Increase</strong> or <strong>Decrease</strong><br />
y<br />
The derivative <strong>of</strong> a function at a point is the slope <strong>of</strong><br />
the tangent line at that point. How does the derivative<br />
change at various points? Study this diagram. Where<br />
y = f(x)<br />
is the slope <strong>of</strong> each tangent line positive? negative?<br />
Where f (x) is increasing <strong>and</strong> f ′(x) > 0, the slope <strong>of</strong><br />
each tangent line is positive. These lines slope up to<br />
the right. Where f (x) is decreasing <strong>and</strong> f ′(x) < 0, the<br />
slope <strong>of</strong> each tangent line is negative. These lines<br />
slope down to the right.<br />
This pattern suggests that you can use the sign <strong>of</strong> the derivative,<br />
f ′(x), to determine where a function is increasing or decreasing.<br />
0<br />
x<br />
Test for Increasing <strong>and</strong> Decreasing Functions<br />
If f ′(x) > 0 for all x in that interval, then f is increasing on the interval<br />
a < x < b.<br />
If f ′(x) < 0 for all x in that interval, then f is decreasing on the interval<br />
a < x < b.<br />
4.1 ANALYZING A POLYNOMIAL FUNCTION: INTERVALS OF INCREASE AND DECREASE 269
Example 2<br />
y<br />
10<br />
8<br />
6<br />
4<br />
2<br />
g(x) = x 2 – 2x + 3 x<br />
–4 –2 0<br />
–2<br />
2 4 6 8 10<br />
–4<br />
–6<br />
–8<br />
–10<br />
Using the Derivative to Determine <strong>Intervals</strong> <strong>of</strong><br />
<strong>Increase</strong> or <strong>Decrease</strong><br />
Determine the intervals where each function increases <strong>and</strong> decreases.<br />
(a) g(x) x 2 2x 3 (b) y 2 3 x3 x 2 12x 1<br />
Solution<br />
d<br />
(a) Start by finding the derivative. g′(x) d<br />
(x<br />
x<br />
2 2x 3)<br />
2x 2<br />
The function g(x) increases when g′(x) > 0 <strong>and</strong> decreases when g′(x) < 0.<br />
i. increasing when 2x 2> 0 ii. decreasing when 2x 2< 0<br />
2x > 2 2x < 2<br />
x > 1 x < 1<br />
The function g(x) is quadratic. The graph <strong>of</strong> the function is a parabola that<br />
opens up. The y-intercept is 3, since g(0) 3. The graph changes direction<br />
when x 1 at the vertex (1, 2).<br />
The function g(x) decreases when x < 1 <strong>and</strong> increases when x > 1.<br />
(b) The function y 2 3 x3 x 2 12x 1<br />
increases when y′ > 0 <strong>and</strong> decreases when y′ < 0.<br />
d<br />
y′ d x 2 3 x3 x 2 12x 1<br />
3 2 3 x 2 2x 12<br />
2x 2 2x 12<br />
Factor.<br />
2(x 2 x 6)<br />
2(x 3)(x 2)<br />
The function is increasing when 2(x 3)(x 2) > 0.<br />
2(x 3)(x 2) 0 when x 3 or when x 2.<br />
The numbers 3 <strong>and</strong> 2 divide the x-axis into three intervals:<br />
x < 2, 2 < x < 3, <strong>and</strong> x > 3.<br />
What is the sign <strong>of</strong> the derivative for each interval? Choose a value for x<br />
in each interval. Substitute this value into each factor <strong>and</strong> solve. Note the<br />
sign. Then multiply the signs to get the sign <strong>of</strong> the derivative.<br />
<strong>Intervals</strong><br />
x < –2 –2 < x < 3 x > 3<br />
–2 – – –<br />
(x – 3) – – +<br />
(x + 2) – + +<br />
Sign <strong>of</strong> y′ (–)(–)(–) = – (–)(–)(+) = + (–)(+)(+) = –<br />
→<br />
Behaviour <strong>of</strong> y decreasing increasing decreasing<br />
→<br />
→<br />
270 CHAPTER 4 USING THE DERIVATIVE TO ANALYZE POLYNOMIAL FUNCTION MODELS
Notice that the intervals are in order from left to right along the x-axis, so<br />
you can see where the function increases or decreases from left to right.<br />
This helps when graphing the function.<br />
A graph confirms the analysis.<br />
28<br />
24<br />
20<br />
16<br />
12<br />
8<br />
4<br />
–5 –4 –3 –2 –1<br />
–4<br />
–8<br />
–12<br />
–16<br />
–20<br />
y<br />
y =<br />
–2<br />
x 3 + x 2 + 12x – 1<br />
3<br />
1 2 3 4 5 6 7 8 9 10<br />
x<br />
The function y 2 3 x3 x 2 12x 1 is<br />
• decreasing on x < 2<br />
• increasing on 2 < x < 3<br />
• decreasing on x > 3<br />
Example 3<br />
Using the First Derivative to Analyze a Model<br />
ROXS, a music store, predicts that every dollar increase in the price <strong>of</strong> any<br />
CD will cause sales to decrease by 10 000 units a year. The store now sells<br />
300 000 CDs a year at $15 each.<br />
(a) Develop a model that represents the music store’s sales revenue.<br />
(b) Using this model, determine when revenue will increase <strong>and</strong> when it will<br />
decrease.<br />
(c) The store’s manager is thinking about raising the price <strong>of</strong> any CD by $2.<br />
At this new price, what is the rate <strong>of</strong> change in revenue?<br />
Solution<br />
(a) revenue price units sold<br />
Let x represent the price increase in dollars. Then price (15 x) <strong>and</strong><br />
units sold (300 000 10 000x).<br />
revenue (15 x)(300 000 10 000x)<br />
4 500 000 150 000x 300 000x 10 000x 2<br />
4 500 000 150 000x 10 000x 2<br />
Let R represent revenue. The model for sales revenue is<br />
R 4 500 000 150 000x 10 000x 2<br />
4.1 ANALYZING A POLYNOMIAL FUNCTION: INTERVALS OF INCREASE AND DECREASE 271
(b) Revenue will increase when R′ > 0. Revenue will decrease when R′ < 0.<br />
d<br />
R′ d<br />
(4 500 000 150 000x 10 000x<br />
x<br />
2 )<br />
150 000 20 000x<br />
R is increasing when<br />
150 000 20 000x > 0<br />
20<br />
0<br />
20<br />
00x<br />
000<br />
> 150<br />
000<br />
<br />
20<br />
000<br />
x < 7.5<br />
R is decreasing when<br />
150 000 20 000x < 0<br />
20<br />
0<br />
20<br />
00x<br />
000<br />
< 150<br />
000<br />
<br />
20<br />
000<br />
x > 7.5<br />
Revenue will increase if the price is raised by any amount up to $7.50.<br />
Revenue will decrease if the price is raised by more than $7.50.<br />
(c) The derivative represents the (instantaneous) rate <strong>of</strong> change at a point.<br />
To find the rate <strong>of</strong> change for a price increase <strong>of</strong> $2, evaluate R′(2).<br />
R′(2) 150 000 20000(2)<br />
150 000 40 000<br />
110 000<br />
Revenue would increase at a rate <strong>of</strong> $110 000 per dollar increase in price.<br />
CHECK, CONSOLIDATE, COMMUNICATE<br />
1. How can you estimate, from the graph <strong>of</strong> a polynomial function, the<br />
intervals where the function is increasing? decreasing?<br />
2. What is always true about the slopes <strong>of</strong> all tangent lines on a section<br />
<strong>of</strong> a curve that is rising? falling?<br />
3. Graph the function that is increasing on the interval 2 < x < 2,<br />
decreasing on the interval 2 < x < 4, <strong>and</strong> increasing on the interval<br />
4 < x < 7. Draw a smooth curve. Suggest the degree <strong>of</strong> a polynomial<br />
function that fits this description.<br />
KEY IDEAS<br />
• A function f (x) is increasing on the open<br />
interval I (a < x < b) if f (x 1<br />
) 0<br />
272 CHAPTER 4 USING THE DERIVATIVE TO ANALYZE POLYNOMIAL FUNCTION MODELS
• A function f (x) is decreasing on the<br />
open interval I (a < x < b) if<br />
f (x 1<br />
)>f (x 2<br />
) for all pairs <strong>of</strong> numbers,<br />
x 1<br />
<strong>and</strong> x 2<br />
, such that x 1<br />
< x 2<br />
in I.<br />
• For a function f that is continuous <strong>and</strong><br />
differentiable on an interval I,<br />
♦ f (x) is increasing if f ′(x) > 0 for all<br />
x in I<br />
♦ f (x) is decreasing if f ′(x) < 0 for all x in I<br />
y<br />
y = f(x)<br />
0<br />
f(x) decreasing; f‘(x) < 0<br />
x<br />
4.1 Exercises<br />
A<br />
1. Identify the intervals on which the function increases or decreases.<br />
(a)<br />
y<br />
10<br />
8<br />
6<br />
4<br />
2<br />
x<br />
–10 –8 –6 –4 –2 0<br />
–2<br />
2 4 6 8 10<br />
–4<br />
–6<br />
–8<br />
–10<br />
(b)<br />
y<br />
10<br />
8<br />
6<br />
4<br />
2<br />
x<br />
–10 –8 –6 –4 –2 0<br />
–2<br />
2 4 6 8 10<br />
–4<br />
–6<br />
–8<br />
–10<br />
(c)<br />
y<br />
10<br />
8<br />
6<br />
4<br />
2<br />
x<br />
–10 –8 –6 –4 –2 0<br />
–2<br />
2 4 6 8 10<br />
–4<br />
–6<br />
–8<br />
–10<br />
(d)<br />
y<br />
10<br />
8<br />
6<br />
4<br />
2<br />
x<br />
–6 –4 –2 0<br />
–2<br />
2 4 6<br />
–4<br />
–6<br />
–8<br />
–10<br />
2. (a) The function f (x) is an increasing function. Its derivative f ′(x) is<br />
defined for all x ∈ R. Can any values <strong>of</strong> f ′(x) be negative? Explain.<br />
(b) The function f (x) is a decreasing function. Its derivative f ′(x) is defined<br />
for all x ∈ R. Can any values <strong>of</strong> f ′(x) be positive? Explain.<br />
4.1 ANALYZING A POLYNOMIAL FUNCTION: INTERVALS OF INCREASE AND DECREASE 273
3. Determine the sign <strong>of</strong> dx<br />
at points A, B,<br />
C, <strong>and</strong> D.<br />
dy<br />
y<br />
A<br />
0<br />
B<br />
C<br />
D<br />
x<br />
B<br />
4. Solve for x, x ∈ R.<br />
(a) 3x 6 > 0 (b) 2x 8 < 0<br />
(c) (x 5)(x 2) > 0 (d) (3x 2)(x 4) < 0<br />
(e) x 2 81 > 0 (f) x 2 10x 24 > 0<br />
(g) x 2 x 30 < 0 (h) 8x 2 2x 3 > 0<br />
(i) 2x 2 3x 20 < 0 (j) 3x 2 11x > 4<br />
5. For each function f (x), determine f ′(x). Also determine when f ′(x) > 0.<br />
State the intervals on which f (x) is increasing.<br />
(a) f (x) 2x 10 (b) f (x) 4x 9<br />
(c) f (x) x 2 3 (d) f (x) 2x 2 8<br />
(e) f (x) 4x 2 8x (f) f (x) 5x 2 20x 3<br />
6. For each function f (x), determine f ′(x). Also determine when f ′(x) < 0.<br />
State the intervals on which f (x) is decreasing.<br />
(a) f (x) 3x 12 (b) f (x) 5x 35<br />
(c) f (x) 3x 2 13 (d) f (x) 3x 2 12<br />
(e) f (x) 3x 2 12x 2 (f) f (x) 4x 2 32x 5<br />
7. Determine the intervals where each function increases <strong>and</strong> decreases.<br />
(a) y 8x 16 (b) y 3x 1<br />
(c) y 5 (d) y x 2 4x 1<br />
(e) y 6 3x 2 (f) y x 2 2x 1<br />
(g) y x 3 12x 15 (h) y x 3 27x 10<br />
(i) y 2x 3 6x 2 (j) y x 3 2<br />
8. Determine the intervals where each function increases <strong>and</strong> decreases.<br />
(a) y 2x 4 10<br />
(b) y 3x 4 12x<br />
(c) y x 4 2x 2 1 (d) y 3x 4 4x 3 12x 2<br />
(e) y 2x 2 1 4 x4 (f) y x 4 x 2 1<br />
9. Knowledge <strong>and</strong> Underst<strong>and</strong>ing: Determine where<br />
g(x) 2x 3 3x 2 12x 15 is increasing <strong>and</strong> where it is decreasing.<br />
274 CHAPTER 4 USING THE DERIVATIVE TO ANALYZE POLYNOMIAL FUNCTION MODELS
10. A plastic pop bottle holds 2 L <strong>of</strong> liquid. In an experiment, a small hole is<br />
drilled in the bottom <strong>of</strong> the bottle. The volume <strong>of</strong> liquid, V, remaining<br />
t t2<br />
after t seconds can be modelled by V(t) 2 5 2 , where t ≥ 0.<br />
00<br />
(a) How long does it take for the 2 L <strong>of</strong> liquid to drain from the bottle?<br />
(b) Verify that the volume <strong>of</strong> liquid is always decreasing until the bottle is<br />
empty.<br />
4<br />
y<br />
11. Communication: Identify the intervals on which the function shown on the<br />
left is increasing or decreasing.<br />
3<br />
2<br />
1<br />
12. A slow-pitch pitcher lobs the ball toward home plate. The height <strong>of</strong> the ball<br />
in metres, h, at t seconds can be modelled by h(t) 4.9t 2 10.5t 0.2.<br />
(a) When is the height <strong>of</strong> the ball increasing? decreasing?<br />
(b) When is the velocity <strong>of</strong> the ball increasing? decreasing?<br />
–2 –1<br />
–1<br />
1 2<br />
x<br />
13. Application: The pr<strong>of</strong>it, P, in dollars for selling x hamburgers is modelled<br />
x2<br />
by P(x) 2.44x 20<br />
5000, where 0 ≤ x ≤ 35 000. For what<br />
000<br />
quantities <strong>of</strong> hamburgers is the pr<strong>of</strong>it increasing? decreasing?<br />
–2<br />
14. Graph f if f ′(x) < 0 when x < 2 <strong>and</strong> when x > 3, f ′(x) > 0 when<br />
2 < x < 3, <strong>and</strong> f (2) 0 <strong>and</strong> f (3) 5.<br />
15. Graph f if f ′(x) > 0 when x < 3 <strong>and</strong> when x > 1, f ′(x) < 0 when<br />
3 < x < 1, <strong>and</strong> f (3) 4 <strong>and</strong> f (1) 2.<br />
16. Use an example to show <strong>and</strong> verify the following: If functions f <strong>and</strong> g are<br />
increasing on an interval I, then f g must also be increasing on I.<br />
17. The world population from 1900 to 2000 can be modelled by<br />
P(t) 0.0012t 3 0.3197t 2 0.2109t 1688.951, where P is the<br />
population in millions <strong>and</strong> t is the number <strong>of</strong> years since 1900. Did the<br />
world population ever decrease in the 20th century? Justify your answer.<br />
18. Thinking, Inquiry, Problem Solving: After birth, a baby normally loses<br />
weight for a few days <strong>and</strong> then starts gaining. The table shows an infant’s<br />
weight during the first two weeks.<br />
Day 0 1 2 3 4 5 6 7 8 9 10 11 12 13 14<br />
Weight (kg) 3.14 3.03 2.95 2.80 2.77 2.76 2.79 2.84 2.93 2.95 3.01 3.14 3.32 3.49 3.68<br />
C<br />
Determine the best polynomial model for this data. Use your model to find<br />
the intervals on which the infant’s weight is increasing <strong>and</strong> decreasing.<br />
19. Check Your Underst<strong>and</strong>ing: A rock is thrown into the air from a bridge.<br />
Verify that its height decreases over the interval 1 < t < 2.2. The height <strong>of</strong><br />
the rock above the water, h, in metres at t seconds is modelled by<br />
h(t) 4.9t 2 9.8t 2.1.<br />
20. Determine the intervals in which f (x) ⏐x 2⏐ 3 increases <strong>and</strong><br />
decreases.<br />
4.1 ANALYZING A POLYNOMIAL FUNCTION: INTERVALS OF INCREASE AND DECREASE 275
21. For the cubic polynomial function f (x) ax 3 bx 2 cx d, where<br />
a ≠ 0, find conditions for a, b, c, <strong>and</strong> d to ensure that, for ∞ < x < ∞,<br />
f is always<br />
(a) increasing<br />
(b) decreasing<br />
22. Use calculus to prove that, for any quadratic function f (x) ax 2 bx c,<br />
b<br />
(a) if a > 0, then f is always decreasing when x < 2<br />
<strong>and</strong> increasing<br />
a<br />
b<br />
when x > <br />
2 a<br />
b<br />
(b) if a < 0, then f is always increasing when x < 2<br />
<strong>and</strong> increasing when<br />
a<br />
b<br />
x > <br />
2 a<br />
ADDITIONAL ACHIEVEMENT CHART QUESTIONS<br />
Knowledge <strong>and</strong> Underst<strong>and</strong>ing: Determine where the polynomial function<br />
f (x) 2x 3 9x 2 12x 2 is increasing <strong>and</strong> decreasing.<br />
–2 –1<br />
y<br />
6<br />
4<br />
2<br />
0<br />
–2<br />
–4<br />
–6<br />
y = f′(x)<br />
1 2<br />
x<br />
Application: A particle moves along a line. The particle’s distance from a fixed<br />
point, s, in metres as a function <strong>of</strong> time, t, in seconds can be modelled by<br />
s(t) 2t 3 6t 2 3, t ≥ 0. Determine when the particle is moving forward.<br />
Thinking, Inquiry, Problem Solving: Given the graph <strong>of</strong> f ′(x) on the left,<br />
determine where f (x) is increasing <strong>and</strong> decreasing.<br />
Communication: Suppose that you are riding on a Ferris wheel. Sketch a graph<br />
that represents your distance above the ground while you are on the Ferris<br />
wheel. When does the distance increase? When does the distance decrease?<br />
The Chapter Problem<br />
Trends in Post-Secondary Education<br />
Apply what you learned in this section to answer these questions about<br />
The Chapter Problem on page 264.<br />
CP1.<br />
Create a scatter plot using graphing technology. The independent<br />
variable is the number <strong>of</strong> years since 1980. Sketch the curve <strong>of</strong><br />
best fit.<br />
CP2.<br />
Using graphing technology, determine the equation <strong>of</strong> the<br />
polynomial that best models the given data.<br />
CP3.<br />
Use the mathematical model you found to determine when the<br />
enrollment is increasing <strong>and</strong> decreasing between 1980 <strong>and</strong> 1998.<br />
276 CHAPTER 4 USING THE DERIVATIVE TO ANALYZE POLYNOMIAL FUNCTION MODELS