LED System Simulation and Testing - fonarevka
LED System Simulation and Testing - fonarevka
LED System Simulation and Testing - fonarevka

You also want an ePaper? Increase the reach of your titles
YUMPU automatically turns print PDFs into web optimized ePapers that Google loves.
www.led-professional.com<br />
ISSN 1993-890X<br />
Review<br />
The technology of tomorrow for general lighting applications. Nov/Dec 2008 | Issue 10<br />
LpR<br />
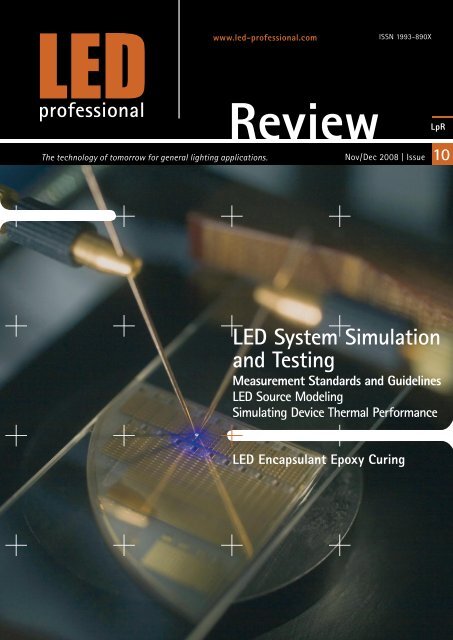
<strong>LED</strong> <strong>System</strong> <strong>Simulation</strong><br />
<strong>and</strong> <strong>Testing</strong><br />
Measurement St<strong>and</strong>ards <strong>and</strong> Guidelines<br />
<strong>LED</strong> Source Modeling<br />
Simulating Device Thermal Performance<br />
<strong>LED</strong> Encapsulant Epoxy Curing
Copyright © 2008 Luger Research & <strong>LED</strong>-professional. All rights reserved.<br />
Design of <strong>LED</strong><br />
Optics<br />
There are over 20 billion light fixtures using inc<strong>and</strong>escent, halogen,<br />
or fluorescent lamps worldwide. Many of these fixtures are used<br />
for directional light applications but are based on lamps that put<br />
out light in all directions. The United States Department of Energy<br />
(DOE) states that recessed downlights are the most common<br />
installed luminaire type in new residential construction. In addition,<br />
the DOE reports that downlights using non-reflector lamps are<br />
typically only 50% efficient, meaning half the light produced by<br />
the lamp is wasted inside the fixture.<br />
In contrast, lighting-class <strong>LED</strong>s offer efficient, directional light that<br />
lasts at least 50,000 hours. Indoor luminaires designed to take advantage of all the benefits of<br />
lighting-class <strong>LED</strong>s can exceed the efficacy of any inc<strong>and</strong>escent <strong>and</strong> halogen luminaire.<br />
Furthermore, these <strong>LED</strong>s match the performance of even the best CFL (compact fluorescent)<br />
recessed downlights, while providing a lifetime five to fifty times longer before requiring<br />
maintenance. Lastly, this class of <strong>LED</strong>s reduces the environmental impact of light (i.e. no mercury,<br />
less power-plant pollution, <strong>and</strong> less l<strong>and</strong>fill waste).<br />
Classical <strong>LED</strong> optics is composed of primary a optics for collimation <strong>and</strong> a secondary optics, which<br />
produces the required irradiance distribution. Efficient elements for primary optics are concentrators,<br />
either using total internal reflection or combined refractive/reflective versions. Secondary optics<br />
for homogeneous illumination of circular, square or oblong areas, or line foci is based on e.g., the<br />
honeycomb condenser principle, microlens arrays, etc. The design goals are high system transmission,<br />
minimum loss of etendue, reduction of straylight <strong>and</strong> a very short system length compared to<br />
conventional illumination schemes. Étendue, as a dominant optical design criterion, is the product<br />
or multiplication of the area of the emitter surface <strong>and</strong> the projected solid angle that the rays from<br />
the surface diverge into, <strong>and</strong> the units are mm 2 -Steradians. This is a three dimensional version of<br />
the Lagrange invariant from imaging or conventional lens design.<br />
The losses associated with secondary optics vary depending on the particular element used. Typical<br />
optical efficiency through each secondary optical element is between 85% <strong>and</strong> 90%.<br />
Traditional optical design is based on ray tracing or aberration theory. Ray tracing is essentially a<br />
sampling technique in which data for a few rays are extrapolated to indicate the performance of an<br />
entire system. Aberration theory provides a different type of sampling, in which low-order<br />
performance coefficients are balanced with high-order performance coefficients to establish<br />
overall performance.<br />
The September/October 2008 <strong>LED</strong> professional Review (LpR) issue highlights <strong>LED</strong> optics <strong>and</strong> points<br />
out how these technologies <strong>and</strong> methods can be applied in modern <strong>LED</strong> lighting systems.<br />
We would be delighted to receive your feedback about LpR or tell us how we can improve our<br />
services. You are also welcome to contribute your own editorials.<br />
Yours Sincerely,<br />
Siegfried Luger<br />
Publisher<br />
www.led-professional.com <strong>LED</strong> professional Review | Nov/Dec 2008 | page 1
Copyright © 2008 Luger Research & <strong>LED</strong>-professional. All rights reserved.<br />
Imprint<br />
<strong>LED</strong> professional Review (LpR)<br />
ISSN 1993-890X<br />
Publisher<br />
Luger Research<br />
Institute for Innovation & Technology<br />
dep <strong>LED</strong> professional<br />
Rhombergs Fabrik<br />
A 6850 Dornbirn, Austria / Europe<br />
phone +43 5572 394 489<br />
fax +43 5572 394 698<br />
editors@led-professional.com<br />
www.led-professional.com<br />
Publishing Editors<br />
Siegfried Luger<br />
Arno Grabher-Meyer<br />
Chrystyna Lucyk<br />
Account Manager<br />
Silvia Girardelli<br />
Front-page picture<br />
GaN based UV-<strong>LED</strong> testing<br />
© FBH/schurian.com<br />
Copyrights – Luger Research<br />
The editors make every reasonable effort to verify the<br />
information published, but Luger Research assumes no<br />
responsibility for the validity of any manufacturers, non<br />
profit organisations or individuals claims or statements.<br />
Luger Research does not assume <strong>and</strong> hereby disclaims any<br />
liability to any person for any loss or damage caused by<br />
errors or omissions in the material contained herein,<br />
regardless of whether such errors result from negligence,<br />
accident or any other cause whatsoever. You may not copy,<br />
reproduce, republish, download, post, broadcast, transmit,<br />
make available to the public, or otherwise use of <strong>LED</strong><br />
professional Review (LpR) content without the prior written<br />
permission from Luger Research – Institute for Innovation<br />
& Technology, Austria.<br />
<strong>LED</strong> professional Review (LpR) -<br />
Subsription<br />
LpR Digital Magazine – free version<br />
• pdf download<br />
• view only, low resolution<br />
• private use<br />
LpR Digital Magazine – full version<br />
annual subscription<br />
• pdf download<br />
• pictures <strong>and</strong> graphs in high<br />
resolutions, printable<br />
• 6 issues<br />
• access to all previous issues<br />
• commercial use<br />
• Euro 78.80<br />
LpR Printed Magazine – annual<br />
subscription<br />
• 6 issues<br />
• Euro 158.40<br />
Send E-mail to:<br />
editors@led-professional.com<br />
Next LpR Issue - Jan/Feb2009<br />
• <strong>LED</strong> <strong>System</strong> <strong>Simulation</strong> <strong>and</strong> <strong>Testing</strong><br />
www.led-professional.com <strong>LED</strong> professional Review | Nov/Dec 2008 | page 2
Copyright © 2008 Luger Research & <strong>LED</strong>-professional. All rights reserved.<br />
Content<br />
Advertising Index<br />
EVERLIGHT<br />
p C2<br />
Editorial<br />
Imprint<br />
Product News<br />
Research News<br />
IP News<br />
Correction<br />
p1<br />
p2<br />
p4<br />
p8<br />
p9<br />
p10<br />
OSRAM p 11<br />
INSTRUMENT SYSTEMS p 17<br />
SAMSUNG p 19<br />
ROAL LIVING ENERGY p 31<br />
POWER VECTOR p 31<br />
EDISON p 33<br />
<strong>LED</strong> TAIWAN 2009 p 37<br />
<strong>LED</strong> CHINA 2009 p 41<br />
INTERNATIONAL RECTIFIER<br />
p C3<br />
Characterization<br />
<strong>LED</strong> Lighting Technology Fundamentals <strong>and</strong> Measurement Guidelines<br />
by M. Nisa Khan, Ph.D., <strong>LED</strong> Lighting Technologies<br />
p12<br />
TRIDONIC.ATCO<br />
p C4<br />
CIE 1964 Colorimetric Observer Chart Improves White Light Quality<br />
by Peter Pachlar, Tridonic Atco Optoelectronics<br />
p16<br />
White Light <strong>LED</strong>s – Importance of Accepted Measurement St<strong>and</strong>ards<br />
by Dr. Thomas Nägele; Instrument <strong>System</strong>s GmbH<br />
p20<br />
The Role of Miniature Spectrometers in the <strong>LED</strong> Revolution<br />
by Jorge Macho, Ocean Optics<br />
p24<br />
Technology<br />
<strong>LED</strong> Encapsulant Epoxy Curing Optimization<br />
by Bit Tie Chan, Avago Technologies<br />
p28<br />
Optics<br />
<strong>LED</strong> Source Modeling Method Evaluations<br />
by Mark Jongewaard, LTI Optics <strong>and</strong> Kurt Wilcox, Ruud Lighting<br />
p32<br />
<strong>Simulation</strong> <strong>and</strong> Optimization of Optical <strong>System</strong>s<br />
by Dr. Norbert Harendt, IB/E OPTICS <strong>and</strong> Christoph Gerhard, LINOS Photonics<br />
p38<br />
Thermal Management<br />
Simulating Device Thermal Performance Using PLECS<br />
by Dr. John Schönberger, Plexim GmbH<br />
p42<br />
www.led-professional.com <strong>LED</strong> professional Review | Nov/Dec 2008 | page 3
Copyright © 2008 Luger Research & <strong>LED</strong>-professional. All rights reserved.<br />
Product News<br />
Avago Adds 3-Watt<br />
Moonstone to Portfolio<br />
At the Electronica - Munich, Avago Technologies, a leading supplier of<br />
analog interface components for communications, industrial <strong>and</strong><br />
consumer applications, announced the addition of new 3-Watt high<br />
power Cool-White (ASMT-Mx20) <strong>and</strong> Warm-White (ASMT-Mx22) lowprofile<br />
<strong>LED</strong>s to its Moonstone family. Avago’s ASMT-Mx20/-Mx22<br />
surface-mount <strong>LED</strong>s, which target designers of solid-state lighting<br />
applications, are capable of being driven at high currents with typical<br />
light output of 145 lumens (lm) of illumination to deliver one of the best<br />
output performances in the industry. These 3W <strong>LED</strong>s are ideal for use in<br />
streetlights, architectural, portable, retail, <strong>and</strong> lighting applications.<br />
Zenigata Line-Up: Sharp<br />
Introduces a New Series of<br />
High-Power <strong>LED</strong><br />
Right on time for electronica, the Sharp introduces a new series of<br />
high-power <strong>LED</strong> modules for lighting purposes. With a lighting<br />
performance of up to 540 lumens, the new “Zenigata” modules make a<br />
direct leap into the category of the 60W equivalent lamps with a power<br />
consumption of only 6.7 watts. Thanks to the light yield of up to 80<br />
lumens per watt (depending on the module), the <strong>LED</strong>s from Sharp are<br />
amongst the front-runners today in the field of energy efficiency in <strong>LED</strong><br />
lamps. In addition to their superb energy efficiency, 40,000 operating<br />
hours at an operating temperature of 80°C also ensure that the overall<br />
system costs stay low.<br />
Features:<br />
• Long operating life<br />
• Energy efficient<br />
• High flux output: delivers 145 lm typical @ 700 mA drive current<br />
• Electrically isolated heat sink is available<br />
• Heat <strong>and</strong> UV resistant silicone encapsulation<br />
• ESD resistance: 16kV<br />
• Moisture sensitivity level (MSL) 4<br />
• Pb-Free <strong>and</strong> RoHS compliant<br />
The Zenigata <strong>LED</strong> lighting module series, the core of Sharp’s <strong>LED</strong> Lighting products<br />
The 3-Watt Moonstone is pin-compatible to the whole Moonstone series<br />
Avago’s ASMT-Mx20/-Mx22 Moonstone <strong>LED</strong>s offer a wide 120-degree<br />
viewing angle, good color <strong>and</strong> light output uniformity, <strong>and</strong> low thermal<br />
resistance to maintain long-term device reliability. Moreover, the lowprofile<br />
design of these <strong>LED</strong>s is ideal for use in applications where height<br />
is a constraint. The ASMT-Mx20/-Mx22 are compatible with st<strong>and</strong>ard<br />
surface-mount technology (SMT) reflow soldering processes <strong>and</strong><br />
provide designers with ease of h<strong>and</strong>ling <strong>and</strong> more flexibility during<br />
assembly.<br />
Divided into sixteen parallel-switched series of three, the modules of<br />
the 540 lumen series are built up in a matrix of 48 <strong>LED</strong> dyes that provide<br />
an overall light output of between 350 <strong>and</strong> 540 lumens, depending on<br />
the module. In contrast, the <strong>LED</strong> modules of the 280 lumen series<br />
consist of ten parallel-switched series of three with a total of 30 <strong>LED</strong><br />
dyes. They provide a light output of 190 to 280 lumens. For both series<br />
(540 <strong>and</strong> 280 lumens), an aluminium-ceramic plate measuring 18 x 18<br />
x 1.5 millimetres is used as a substrate. Already equipped with mounting<br />
drill holes make it possible to fix the modules securely to a suitable<br />
cooling element without great effort.<br />
The colour temperature of the white light <strong>LED</strong> lighting module from Sharp<br />
lies within a range of 2,800 to 6,500 kelvins with the defining tones of<br />
“normal white light”, “warm white light”, comparable to a light bulb <strong>and</strong><br />
two types of “high colour rendering white”, attaining a CRI value of 90<br />
<strong>and</strong> thus providing high colour veracity <strong>and</strong> detail fidelity.<br />
www.led-professional.com <strong>LED</strong> professional Review | Nov/Dec 2008 | page 4
Copyright © 2008 Luger Research & <strong>LED</strong>-professional. All rights reserved.<br />
Cree Announces Commercial<br />
Availability of XLamp MC-E<br />
Cree, Inc. (Nasdaq: CREE), a market leader in <strong>LED</strong> lighting, announces<br />
the commercial availability of the XLamp(R) MC-E <strong>LED</strong>, the highestlumen<br />
<strong>LED</strong> in the award-winning XLamp family.<br />
The multi-chip XLamp MC-E retains the same 7mm x 9mm footprint as<br />
Cree’s existing XLamp XR family <strong>LED</strong>s while providing four times the<br />
light output of the existing XR-E, the highest lumen output commercially<br />
available for a package of this size. This powerful combination is<br />
designed to enable new applications <strong>and</strong> reductions in overall system<br />
cost compared to other <strong>LED</strong> packages. At 9.8W, the XLamp MC-E <strong>LED</strong><br />
provides up to 790 lumens at 6000K <strong>and</strong> up to 605 lumens at 3000K.<br />
designers to accelerate their time to market. The light engine provides a<br />
stable, intelligent platform for the design, development, test, <strong>and</strong><br />
manufacture of lighting systems.<br />
Its unique combination of high-power, simple integration <strong>and</strong> smart<br />
array technology provides lighting designers with user-friendly, highlyefficient,<br />
high powered single <strong>and</strong> multi colour light sources.<br />
Enfis’ arrays <strong>and</strong> light engines are available in four platforms: the<br />
QUATTRO, Enfis’ premium high-output product; QUATTRO MINI (up<br />
to 5,000 lumens), the UNO PLUS (up to 1,400) lumens, <strong>and</strong> the UNO<br />
(up to 1,000 lumens). The QUATTRO Mini <strong>and</strong> UNO Plus are available<br />
either as single colour/white or as RGBA, RGBW or High CRI (Ra>90)<br />
variable CCT.<br />
Enfis received prodigious interest during <strong>and</strong> after this year’s PLASA 08<br />
Show at Earls Court, London, particularly from those engaged in the<br />
development of complete lighting fixtures around a true, high power<br />
<strong>LED</strong> module, for Architainment, Entertainment <strong>and</strong> General display<br />
lighting.<br />
The multi-chip XLamp MC-E retains the same 7mm x 9mm footprint as Cree’s existing XLamp XR family <strong>LED</strong>s<br />
“Cree’s XLamp MC-E <strong>LED</strong> is a lighting-class solution for applications<br />
that require high lumen output in a small footprint,” said Norbert Hiller,<br />
Cree vice president <strong>and</strong> general manager for lighting <strong>LED</strong>s. “Imagine the<br />
design implications for something like a street light – if you could<br />
reduce the size by roughly 75 percent without compromising on lumen<br />
output. Or consider the efficiencies that could be gained in an MR16<br />
bulb application.”<br />
The MC-E has already been designed into a number of products <strong>and</strong><br />
applications, as customers can benefit from increased design flexibility<br />
<strong>and</strong> reduced overall system cost over other, lower flux-output <strong>LED</strong><br />
packages, without compromising on quality.<br />
New Copper <strong>LED</strong> Mounting<br />
Boards Accept Optical Solutions<br />
Introducing copper mounting boards for Cree XR, XP, <strong>and</strong> MC-E <strong>LED</strong>s<br />
<strong>and</strong> one new board for the Luxeon Rebel. Each board accepts a single<br />
<strong>LED</strong> <strong>and</strong> an optional 22mm optical package.<br />
AsianSignals released the first copper clad boards for the Luxeon Rebel<br />
a year ago, <strong>and</strong> through testing <strong>and</strong> use, customers are pleased to<br />
report that copper is outperforming aluminum clad boards. These<br />
boards are not only made from better thermal materials, but the <strong>LED</strong>s<br />
are bonded to the underlying heat sinks with solder, rather than glue<br />
resulting in more solid heat transfer characteristics. The entire thermal<br />
pathway is metallically bonded. On aluminum MCPCBs, the <strong>LED</strong> thermal<br />
pathway is inhibited by two adhesive barriers. Additionally, dielectric<br />
layers can’t compete with a copper path for thermal efficiency.<br />
ENFIS Launched World’s<br />
Brightest <strong>LED</strong> Array<br />
The world’s brightest <strong>LED</strong> Enfis Quattro, which generates 12,000 lumens<br />
from a single <strong>LED</strong> Array, has been launched by Enfis, global leader in<br />
light engines <strong>and</strong> arrays. Introduced at PLASA 2008 it comprises an<br />
<strong>LED</strong> Array, optics, thermal management <strong>and</strong> electronics, <strong>and</strong> enables<br />
Copper mounting boards for Cree XR, XP, <strong>and</strong> MC-E <strong>LED</strong>s, <strong>and</strong> Luxeon Rebel<br />
www.led-professional.com <strong>LED</strong> professional Review | Nov/Dec 2008 | page 5
Copyright © 2008 Luger Research & <strong>LED</strong>-professional. All rights reserved.<br />
To further benefit the design, copper plated screw holes are strategically<br />
placed near the <strong>LED</strong>s. The mounting screws facilitate heat sinking by<br />
creating an even “pressure line” right under the <strong>LED</strong>.<br />
The 3oz copper top <strong>and</strong> bottom layers are gold plated for a beautiful<br />
finish. Drilling template are also available for these boards.<br />
22mm optical lenses from <strong>LED</strong>iL.com <strong>and</strong> Fraen may be used on these<br />
products; however, holes will have to be h<strong>and</strong>-crafted into the plastic<br />
lens holders so they can be adapted to the boards.<br />
GK Technik Provides New<br />
MCPCB for Achriche for EU<br />
GK Technik announces today, that they have designed a new MCPCB,<br />
which fits to the Acriche <strong>LED</strong> from Seoul Semiconductor, in the 230V-<br />
Version 322x <strong>and</strong> 323x.<br />
Four-String HB <strong>LED</strong> Driver<br />
Maxim Integrated Products (NASDAQ: MXIM) introduces the MAX16826<br />
programmable, four-string high-brightness (HB) <strong>LED</strong> driver for white,<br />
RGB, <strong>and</strong> RGB-plus-amber <strong>LED</strong> configurations. Designed to enable the<br />
transition to green lighting technology in automotive applications, this<br />
device maximizes system flexibility <strong>and</strong> provides the lowest solution<br />
cost for backlight drivers.<br />
The MAX16826 integrates a switching regulator controller; a 4-channel,<br />
linear current-source driver; an ADC; <strong>and</strong> an I²C interface. The I²C<br />
interface allows dynamic programming of the output voltage to<br />
maximize power efficiency; it also allows manufacturers to program<br />
<strong>LED</strong> current for each string to accommodate <strong>LED</strong> binning variations,<br />
thereby reducing implementation cost.<br />
Offering an unparalleled combination of configurability <strong>and</strong><br />
performance, the MAX16826 is ideal for backlighting automotive<br />
infotainment displays, automotive display clusters, industrial <strong>and</strong><br />
desktop monitors, <strong>and</strong> LCD TVs. It is also well suited for adaptive front<br />
lights <strong>and</strong> low-/high-beam assemblies, as well as other solid-state<br />
lighting (SSL) applications.<br />
Acriche MCPCB fits all lenses without modifications<br />
“We have made a new, very careful design, to continue the VDE-, CE<strong>and</strong><br />
TUV proven design from SSC”, states Mr. Juergen Krueger, cofounder<br />
of Fa. GK Technik. “The new aluminum MCPCB can be directly<br />
connected to 230V AC. With a creepage of 6.3mm we address all<br />
customers who needs to make very reliable <strong>and</strong> save products.”<br />
The new MCPCB is a combined design, it contains the needed resistors<br />
<strong>and</strong> fits to the available lenses for 26,5mm diameter. The shape is an<br />
octagon with side-to-side distance of 35mm. It contains two holes for<br />
M3-screws. This new octagon MCPCB can be mounted together with all<br />
available lenses without modifications. The panel contains 30 pieces of<br />
this MCPCB, <strong>and</strong> the data for automatic populating, <strong>and</strong> for the<br />
solderpaste-stancel as well, are available free of charge. This new<br />
MCPCB is available from stock.<br />
GK Technik also provides support for your own OEM-design.<br />
Power Vector’s New<br />
TRINITY 6<br />
Power Vector’s new developed 240 watts <strong>LED</strong> Driver with improved<br />
dimming opportunities is currently available for prototype evaluation in<br />
limited quantities. UL <strong>and</strong> CE approved production units are targeted<br />
for January 2009.<br />
Power Vector’s New TRINITY 6 <strong>LED</strong> Driver Dimmer combines Power<br />
Isolation with a 240-Watt power supply, Analog or DMX 512A Dimming<br />
<strong>and</strong> Constant Current outputs for driving <strong>and</strong> dimming <strong>LED</strong> fixtures.<br />
The TRINITY 6 is able to drive <strong>and</strong> dim 6 <strong>LED</strong>s per channel (up to 27<br />
VDC <strong>and</strong> up to 72 <strong>LED</strong>s). The product can drive 700Ma, 1A, <strong>and</strong> 1.4A<br />
<strong>LED</strong>s <strong>and</strong> is ideal for high-powered applications in both architectural<br />
<strong>and</strong> entertainment applications.<br />
Power isolated TRINITY 6 <strong>LED</strong> Driver Dimmer<br />
www.led-professional.com <strong>LED</strong> professional Review | Nov/Dec 2008 | page 6
Copyright © 2008 Luger Research & <strong>LED</strong>-professional. All rights reserved.<br />
TRINITY 6 provides low-level dimming to 0.23 percent brightness. This<br />
feature is especially important for designers who use other lighting<br />
sources <strong>and</strong> require fluid dimming. Other products available in the<br />
industry typically drop off at 10% leaving a harsh step at the low end<br />
of the dimming sequence.<br />
For the first time Power Vector is pleased to offer an Analog dimming<br />
option for customers looking to dim their General Illumination or<br />
Monochromatic fixtures. Power Vector’s simple solution enables a<br />
simple connection from a 0-10VDC Slide or Rotary dimmer to the<br />
TRINITY 6 <strong>and</strong> then to the <strong>LED</strong> Fixture; No magic boxes, extra cabling,<br />
or extra cost. DMX is strongly recommended for color changing<br />
applications or where a large network installation are required. Power<br />
Vector’s products follow the USITT DMX512A st<strong>and</strong>ard.<br />
TRINITY 6 is a completely enclosed, convection cooled, fan-free,<br />
solution complete with mounting tabs, flying leads, <strong>and</strong> an input<br />
voltage of 115 Vac to 277 Vac. The unit provides output protection for<br />
over voltage, over current, <strong>and</strong> short circuit protection. The unit also<br />
offers over temperature protection, throttling back to 25% when<br />
ambient temperatures are exceeded.<br />
The Deca<strong>LED</strong>® Controller 3 Mini offers a solution for dimming all 12VDC<br />
products. The Deca<strong>LED</strong>® Controller 3 Mini is ideal for installation in<br />
small <strong>and</strong> narrow service rooms. The controller 3 mini combines a driver<br />
with a 100W PSU.<br />
The Deca<strong>LED</strong>® Controller 3 Mini is a small version of the Deca<strong>LED</strong>®<br />
Controller 3 <strong>and</strong> the lightest of all 24VDC controllers. The Controller 3<br />
Mini is a professional led controller for led products with a 24VDC input.<br />
The Deca<strong>LED</strong>® Controller 3 Mini is suited for powering <strong>and</strong> dimming of<br />
all 24VDC led products <strong>and</strong> can h<strong>and</strong>le a maximum load of 6Amps, with<br />
a maximum of 3Amps per output. The controller is 243 x 150 x 73 mm<br />
<strong>and</strong> needs a input voltage of 230VAC. The Deca<strong>LED</strong>® Controller 3 Mini<br />
is delivered with a remote control<strong>and</strong> an external infrared eye. With<br />
these accessories <strong>and</strong> the dipswitches it is possible to select a diversity<br />
of st<strong>and</strong>ard programs, colours <strong>and</strong> effects. The Controller 3 Mini is also<br />
equipped with professional XLR 3 connector <strong>and</strong> screw terminals for<br />
DMX signals.<br />
There are various accessories available for the Deca<strong>LED</strong>® Controller 3<br />
Mini like starter cables, spare remotes, spare infrared eye’s <strong>and</strong> the<br />
Deca<strong>LED</strong>® Setup Tool.<br />
Lagotronics: New Deca<strong>LED</strong>®<br />
Controller 3 Mini<br />
Lagotronics introduces the new Deca<strong>LED</strong>® Controller 3 Mini. The<br />
Deca<strong>LED</strong>® Controller 3 Mini is designed for 24VDC led installations, in<br />
which the power <strong>and</strong> 8 outputs of the Deca<strong>LED</strong>® Controller 3, or the<br />
high-amperage outputs from the Deca<strong>LED</strong>® Controller 4 aren’t<br />
needed.<br />
De Deca<strong>LED</strong>® Controller 3 Mini has a 100W PSU <strong>and</strong> 2 outputs with<br />
screwterminals. The Deca<strong>LED</strong>® Controller 3 Mini is ideal for installations<br />
in smaller venues in which fully RGB lit led products are requested.<br />
More information on the Deca<strong>LED</strong>® Controller 3 Mini <strong>and</strong> the products<br />
that may be used in conjunction with the controller can be found on<br />
the dedicated productpage.<br />
Eyeleds Launches New<br />
‚Outdoor Extreme‘<br />
“Excellent, robust <strong>LED</strong> lighting solution for ‘heavy’ projects outdoors”<br />
goes. Eyeleds International is happy to announce the official market<br />
release of the latest Product Innovation ‘Eyeleds Outdoor Extreme’.<br />
Eyeleds International offers ultra-slim, sustainable, ‘plug-<strong>and</strong>-play’ <strong>LED</strong><br />
lighting solutions for application in both indoor <strong>and</strong> outdoor<br />
environments. The current product range is used in both end consumer<br />
<strong>and</strong> professional projects for orientation, design <strong>and</strong> functional<br />
purposes.<br />
The new, robust Eye<strong>LED</strong>s ‘Outdoor Extreme’<br />
Considering the application of Eyeleds in outdoor environments, Eyeleds<br />
offers currently the successful Outdoor ‘Basic’ <strong>and</strong> Outdoor ‘Professional’<br />
series. Current developments in especially the project market dem<strong>and</strong><br />
an even more robust <strong>LED</strong> lighting solution, thanks to the growing<br />
awareness of the added value of <strong>LED</strong> products for large scaled l<strong>and</strong>scape<br />
projects.<br />
Deca<strong>LED</strong>® Controller 3 Mini<br />
www.led-professional.com <strong>LED</strong> professional Review | Nov/Dec 2008 | page 7
Copyright © 2008 Luger Research & <strong>LED</strong>-professional. All rights reserved.<br />
The new Eyeleds Outdoor Extreme is an innovative response to the<br />
market latest dem<strong>and</strong>. The product is able to operate – as the products’<br />
name assumes – under extreme circumstances. Therefore, application<br />
in ‘heavy’ loaded projects as e.g. airports, traffic areas, squares, shopping<br />
areas, etc. will be of no problem.<br />
Advanced Lumonics: New <strong>LED</strong><br />
Bulbs<br />
Advanced Lumonics introduces Earth<strong>LED</strong> ZetaLux a new, low cost,<br />
direct replacement <strong>LED</strong> Light bulb that uses only 7 watts. ZetaLux offers<br />
advanced features that make it ideal for use in general lighting<br />
applications.<br />
Following on the success of the EvoLux launch earlier this year, the<br />
Earth<strong>LED</strong> ZetaLux <strong>LED</strong> light bulb offers a price/performance ratio<br />
unmatched in the industry. The ZetaLux only consumes 7 watts yet<br />
offers performance comparable to a 50-60 watt light bulb. With a price<br />
of under $50 USD, the ZetaLux offers an unprecedented payback time<br />
of just over 2 years when operated 8 hours per day.<br />
ZetaLux is built upon the latest <strong>LED</strong> engine technology from CREE®<br />
allowing for amazing efficiency, high output <strong>and</strong> a new benchmark in<br />
Color Rendering Index (CRI) performance. CRI is a a good way to<br />
determine the quality of light <strong>and</strong> its faithfulness to render colors<br />
correctly, EvoLux features a a CRI of 75 for cool white <strong>and</strong> 80 for Warm<br />
White making them exceptional for <strong>LED</strong> Light Bulbs.<br />
Advanced Lumonics is also announcing enhanced versions of their<br />
successful EvoLux line. All EvoLux bulbs now feature lumen outputs<br />
exceeding 1000 Lumens along with a higher CRI <strong>and</strong> even greater<br />
efficiency. These enhancements further cement the position of EvoLux<br />
as the most advanced direct replacement <strong>LED</strong> light bulb on the market<br />
today. The ZetaLux along with the new enhanced EvoLux will be among<br />
the first direct replacement <strong>LED</strong> light bulbs to achieve UL certification<br />
later this year along with compliance with new DOE EnergyStar<br />
st<strong>and</strong>ards for <strong>LED</strong> lighting in 2009.<br />
Both ZetaLux <strong>and</strong> enhanced EvoLux are available today from The<br />
Earth<strong>LED</strong> Store <strong>and</strong> Advanced Lumonics distribution partners.<br />
The new ZetaLux <strong>and</strong> enhanced EvoLux join a fresh new lineup of<br />
Earth<strong>LED</strong> <strong>LED</strong> Lighting products for 2009 including:<br />
TriSpectra 3 - The World’s Most Powerful <strong>LED</strong> Based MR-16 Solution<br />
Direct<strong>LED</strong>-HL - The First Direct <strong>LED</strong> Replacement for G4 Halogen Lamps<br />
Direct<strong>LED</strong>-PL - The First Direct <strong>LED</strong> Replacement for PL Fluorescent<br />
Lamps DesignoLux - <strong>LED</strong>s Designed Specifically for Decorative Lighting<br />
Grow<strong>LED</strong> - A Comprehensive Range of Affordable <strong>LED</strong> Grow Lights.<br />
New Ocean Optics Light-<br />
Measurement Device<br />
Jaz from Ocean Optics is a modular, h<strong>and</strong>held optical-sensing instrument<br />
now available for radiometric analysis of <strong>LED</strong>s, flat panel displays, lamps<br />
<strong>and</strong> other radiant sources. With its small footprint <strong>and</strong> convenient<br />
onboard display, Jaz is ideal for relative intensity measurements of<br />
inc<strong>and</strong>escent, high-intensity discharge, UV curing <strong>and</strong> fluorescent<br />
lamps, as well as low-power sources such as <strong>LED</strong>s <strong>and</strong> O<strong>LED</strong>s.<br />
The new 7W Earth<strong>LED</strong> ZetaLux delivers 450lm (Cool White), 350lm (Warm White)<br />
The ZetaLux has been designed to the most exacting st<strong>and</strong>ards of any<br />
<strong>LED</strong> light bulb currently on the market. From its oversized aluminum<br />
heat sink to its flame retardant plastic, to its shatter proof lens, the<br />
ZetaLux is built to perform safely <strong>and</strong> efficiently for over 50,000 hours.<br />
The ZetaLux’s rugged design also allows it to perform under the harshest<br />
conditions including frigid -50 degree frost all the way up to scorching<br />
180 degree heat with 95% humidity.<br />
Jaz provides full spectral analysis in a simple, h<strong>and</strong>held unit<br />
Jaz is a family of stackable, modular <strong>and</strong> autonomous components that<br />
share common electronics <strong>and</strong> communications. Included in the Jaz<br />
stack is a CCD-array spectrometer that can be optimized for a variety of<br />
radiometric measurements <strong>and</strong> a microprocessor with onboard display.<br />
www.led-professional.com <strong>LED</strong> professional Review | Nov/Dec 2008 | page 8
Copyright © 2008 Luger Research & <strong>LED</strong>-professional. All rights reserved.<br />
Unlike traditional light meters, Jaz allows users to capture, process <strong>and</strong><br />
store full spectra without the need for a PC. Spectral data can be<br />
transferred to a laptop or desktop PC for additional post-acquisition<br />
processing, such as calculating colour temperature, spectral intensity<br />
<strong>and</strong> colour space values.<br />
Jaz’s Ethernet <strong>and</strong> battery modules offer unmatched portability. The<br />
Ethernet module has data storage capability via an SD card slot <strong>and</strong><br />
allows users to connect to the Jaz unit via the Internet -- making remote<br />
measurements such as solar irradiance possible <strong>and</strong> enabling the<br />
creation of networked sensing modules. The Lithium-Ion battery module<br />
is rechargeable in the field via a solar cell or in the QC lab using the<br />
Power over Ethernet connection (100 Mbps, IEEE 802.3-compliant<br />
10/100 single-cable), the USB 2.0 port or an external power supply. The<br />
battery module also has a power-conserving sleep mode for long-term<br />
measurements <strong>and</strong> two additional SD card slots for storing data.<br />
“Jaz offers an attractive combination of spectral sensing power <strong>and</strong><br />
h<strong>and</strong>held portability for all sorts of lighting measurements,” says Mike<br />
Kayat, Ocean Optics Vice President of Sales & Marketing. “As energy<br />
savings <strong>and</strong> cost concerns help drive dem<strong>and</strong> for more efficient <strong>LED</strong>s<br />
<strong>and</strong> other types of lighting, the value of simple, convenient diagnostic<br />
instrumentation is magnified.”<br />
The Jaz platform also exp<strong>and</strong>s to include light sources (VIS-NIR or <strong>LED</strong>)<br />
<strong>and</strong> additional spectrometer channels. Jaz can be connected to fibre<br />
optic sampling accessories such as integrating spheres (for collecting<br />
emission with a 360-degree Field of View), cosine correctors (collecting<br />
with 180-degree Field of View) <strong>and</strong> optical fibres. An add-on holster<br />
accessory makes the Jaz wearable, freeing h<strong>and</strong>s to manipulate sampling<br />
devices.<br />
Research News<br />
DOE recently Released Four<br />
New <strong>LED</strong> Reports<br />
DoE recently released two reports on “<strong>LED</strong> Area Lights” <strong>and</strong> “Residential<br />
<strong>LED</strong> Lighting”, as well as two new CALiPER Benchmark Reports. While<br />
the “Benchmark Reports” showed relatively poor results for the <strong>LED</strong><br />
replacement lamps, the tested products for residential <strong>and</strong> for<br />
commercial lighting showed convincing results.<br />
Commercial Garage <strong>LED</strong> Lighting Demonstration:<br />
These results indicate very similar minimum light levels produced by<br />
Version 1 of the <strong>LED</strong> luminaires <strong>and</strong> HPS, <strong>and</strong> possibly slightly higher<br />
minimum light levels with Version 2 of the <strong>LED</strong> luminaires. All results<br />
were above the IES recommended level of 1 fc. More than half felt the<br />
<strong>LED</strong> luminaires provided more light than the HPS sources <strong>and</strong> a majority<br />
expressed a preference for the new fixtures when viewing the relamped<br />
area through a security camera. PNNL also calculated simple payback<br />
<strong>and</strong> found that Version 1 showed paybacks of 6.5 yrs at $0.065/kWh<br />
<strong>and</strong> 4.1 yrs at $0.11/kWh while Version 2 showed paybacks of 6.3 yrs at<br />
$0.065/kWh <strong>and</strong> 3.9 yrs at $0.11/kWh.<br />
Residential <strong>LED</strong> Lighting Demonstration:<br />
The <strong>LED</strong> downlight product drew 12 Watts of power, reducing energy<br />
use by 82% compared to a 65W inc<strong>and</strong>escent reflector lamp <strong>and</strong> by<br />
84% compared to a 75W halogen reflector lamp. The <strong>LED</strong> undercabinet<br />
fixture drew 10 watts, cutting energy use by 83% to 90% compared to<br />
a halogen product, which was tested at two power settings – a low<br />
power setting that drew 60 watts <strong>and</strong> a high power setting that drew<br />
105 watts. Paybacks on the <strong>LED</strong> downlights ranged from 7.6 years<br />
(assuming electricity cost of 11 c/kWh) to 13.5 years (at 5c/kWh)a<br />
based on product costs of $95 per <strong>LED</strong> downlight <strong>and</strong> 3 hrs per day of<br />
usage. Paybacks on the <strong>LED</strong> undercabinet fixture in a new home ranged<br />
from 4.4 years (11c/kWh electricity) to 7.6 years (5c/kWh) based on<br />
product costs of $140 per <strong>LED</strong> undercabinet fixture at 2 hrs per day of<br />
usage.<br />
Performance of Inc<strong>and</strong>escent Lamps <strong>and</strong> <strong>LED</strong> Replacements:<br />
Most manufacturers claim much too high values for their products.<br />
Very often the <strong>LED</strong> lamps to replace inc<strong>and</strong>escent lamps produce only<br />
10-60% of their claimed light output, while carrying claims such as<br />
“equivalent to a 25-W lamp” or “replaces a 40-W lamp” or “90% more<br />
efficient than a 60-W lamp.”<br />
Performance of Halogen MR16 Lamps <strong>and</strong> <strong>LED</strong> Replacements:<br />
MR16 <strong>LED</strong> replacement lamps were compared to 20W halogen lamps.<br />
Wide variations were observed in tested performance. Even the best<br />
performing <strong>LED</strong> replacement lamp doesn’t reach the light output of the<br />
least efficient halogen lamp. DoE stated: For cases in which lower light<br />
levels are desirable, <strong>LED</strong> MR16 lamps may provide a more efficacious<br />
alternative to halogen lamps.<br />
Articles to all four <strong>LED</strong> reports can be found at the <strong>LED</strong>-professional<br />
Research area, or are available for download at www.netl.doe.gov/ssl.<br />
Cree Achieves 161lm/W from<br />
a High-Power <strong>LED</strong><br />
Cree, Inc. (Nasdaq: CREE), a leader in <strong>LED</strong> lighting, announces it has<br />
achieved industry-best reported R&D results of 161 lumens per watt<br />
for a white power <strong>LED</strong>.<br />
These results demonstrate Cree’s continued commitment to deliver<br />
industry-leading performance through a constant focus on innovation<br />
<strong>and</strong> R&D. Cree’s tests confirmed that the 1mm x 1mm <strong>LED</strong> produced<br />
173 lumens of light output <strong>and</strong> achieved 161 lumens per watt efficacy<br />
at a color temperature of 4689K. The tests were conducted under<br />
st<strong>and</strong>ard <strong>LED</strong> test conditions at a drive current of 350mA, at room<br />
temperature.<br />
www.led-professional.com <strong>LED</strong> professional Review | Nov/Dec 2008 | page 9
Copyright © 2008 Luger Research & <strong>LED</strong>-professional. All rights reserved.<br />
“Cree is inventing, commercializing <strong>and</strong> delivering <strong>LED</strong> lighting<br />
innovations that aim to obsolete the energy-inefficient light bulb,” said<br />
John Edmond, Cree co-founder <strong>and</strong> director of advanced optoelectronics.<br />
“Our advances in brightness <strong>and</strong> efficacy come from a focus on end-toend<br />
innovation that can enable <strong>LED</strong> lighting to address growing numbers<br />
of lighting applications while saving energy, saving money <strong>and</strong> helping<br />
to protect the environment.”<br />
While this level of performance is not yet available in production <strong>LED</strong>s,<br />
Cree continues to ship millions of 100+ lumen lighting-class XLamp®<br />
<strong>LED</strong>s.<br />
IP News<br />
Sharp <strong>and</strong> Nichia Enter into<br />
<strong>LED</strong> <strong>and</strong> Laser Diode Patent<br />
Cross-Licensing Agreement<br />
Sharp Corporation (head office: Osaka City, Osaka Prefecture; President:<br />
Mikio Katayama; below, “Sharp”) <strong>and</strong> Nichia Corporation (head office:<br />
Anan City, Tokushima Prefecture; President: Eiji Ogawa; below, “Nichia”)<br />
have entered into a patent cross-licensing agreement covering <strong>LED</strong>s<br />
(light-emitting diodes) <strong>and</strong> laser diodes.<br />
This cross-licensing agreement grants each other the right to use<br />
inventions related to <strong>LED</strong>s <strong>and</strong> laser diodes covered by the vast number<br />
of patents owned by the respective companies in Japan <strong>and</strong> in major<br />
countries.<br />
<strong>LED</strong>s feature long service life <strong>and</strong> low power consumption, <strong>and</strong> are<br />
increasingly expected to be the strongest c<strong>and</strong>idate for the next<br />
generation of lighting devices. At present, <strong>LED</strong>s have been adopted<br />
mainly for use in backlights for mobile phones <strong>and</strong> PDAs, but in the<br />
future, they are expected to gain acceptance not only for general<br />
illumination applications, but also for use in large numbers in the<br />
backlights of LCD TVs <strong>and</strong> for automotive lighting.<br />
At the same time, laser diodes have long been the key device used in<br />
recording <strong>and</strong> playback of optical disks such as CDs <strong>and</strong> DVDs. Today, as<br />
HDTV images become increasingly familiar, dem<strong>and</strong> is growing rapidly<br />
for blue-violet laser diodes as indispensable devices in recording <strong>and</strong><br />
playback of terrestrial digital broadcasts, <strong>and</strong> for Blu-ray Disc recorders<br />
<strong>and</strong> players.<br />
Sharp launched development of <strong>LED</strong>s in 1968 <strong>and</strong> began mass<br />
production in 1970. In addition, Sharp was the first in the world to<br />
begin mass production of infrared laser diodes for CDs in 1982, <strong>and</strong> in<br />
February of this year, initiated mass production of 250-mW, pulsedoutput,<br />
high-power blue-violet laser diodes, one of the highest levels in<br />
the industry.<br />
And now, by working toward development of a vertically integrated<br />
business model based on these two devices, including <strong>LED</strong> lighting <strong>and</strong><br />
Blu-ray Disc recorders, Sharp is aiming to create unique, one-of-a-kind<br />
products in the future that feature both devices at their core.<br />
By entering into this cross-licensing agreement, Sharp <strong>and</strong> Nichia will<br />
be aiming to create even higher-performance <strong>LED</strong>s <strong>and</strong> laser diodes,<br />
enabling the two companies to respond to rapidly exp<strong>and</strong>ing market<br />
dem<strong>and</strong>.<br />
SSC <strong>and</strong> TOE sign Cross<br />
License Agreement<br />
Seoul enters into a cross license agreement with TOE Europe <strong>and</strong> its<br />
patent partners. Based on this agreement, Seoul enhances its flexibility<br />
in manufacturing <strong>LED</strong>s.<br />
Seoul Semiconductor Co., Ltd. (“SSC”) today announced that SSC has<br />
entered into a Cross License Agreement regarding white <strong>LED</strong>s using<br />
silicate system phosphors with TridonicAtco Optoelectronics GmbH<br />
(“TOE”) <strong>and</strong> its patent partners.<br />
Phosphors are indispensable materials to manufacture white <strong>LED</strong>s.<br />
Especially, white <strong>LED</strong>s incorporating silicate system phosphors are<br />
covered by a wide variety of patents <strong>and</strong> are significantly different from<br />
conventional <strong>LED</strong>s using other phosphors.<br />
Under the Cross License Agreement, SSC is in a very strong position to<br />
manufacture <strong>and</strong> sell its own white <strong>LED</strong>s using silicate system phosphors<br />
as well as exp<strong>and</strong> <strong>and</strong> accelerate relevant R&D activities.<br />
Based on this agreement, SSC’s white <strong>LED</strong>s using silicate system<br />
phosphors can be covered by its patents <strong>and</strong> such license <strong>and</strong> thus<br />
SSC’s customers will be able to enjoy using SSC’s white <strong>LED</strong>s.<br />
Correction<br />
Optics<br />
Optical Research Association points out, that in “Microstructured<br />
Optics for <strong>LED</strong> Applications” of the September/October 2008 issue,<br />
page 24, of <strong>LED</strong> professional Review, Mr. Davis mischaracterizes the<br />
optimization capabilities of the recent LightTools version when he writes<br />
that, “ASAP has a linear optimizer..., TracePro <strong>and</strong> LightTools have none.”<br />
In fact, LightTools does provide a fully integrated optimizer with 3D<br />
solid modeling features <strong>and</strong> algorithms especially developed to solve<br />
illumination design problems. The LightTools optimizer has been<br />
available to all users since 2005, when it was introduced in Version<br />
5.2, <strong>and</strong> has been continuously upgraded <strong>and</strong> improved.<br />
www.led-professional.com <strong>LED</strong> professional Review | Nov/Dec 2008 | page 10
Copyright © 2008 Luger Research & <strong>LED</strong>-professional. All rights reserved.<br />
Characterization<br />
<strong>LED</strong> Lighting Technology<br />
Fundamentals <strong>and</strong><br />
Measurement Guidelines<br />
M. Nisa Khan, Ph.D., President, <strong>LED</strong> Lighting Technologies, USA<br />
Advances in solid state lighting has been remarkable considering<br />
how fast their efficiency, light output <strong>and</strong> quality have improved in<br />
the past few years. Today the illumination <strong>and</strong> display industries<br />
have many diverse applications that are gaining acceptance because<br />
<strong>LED</strong>s offer important energy savings; in addition, their flexible form<br />
factors, scaling, <strong>and</strong> attractive color combination capabilities offer<br />
many architectural <strong>and</strong> decorative lighting designs for residential<br />
<strong>and</strong> commercial buildings – both indoors <strong>and</strong> outdoors.<br />
While these SSL capabilities are unique <strong>and</strong> promising, the industry<br />
nevertheless is at an early stage <strong>and</strong> many fundamental technology<br />
underst<strong>and</strong>ings still need to become more ubiquitous. Here I shall<br />
attempt to lay some groundwork on SSL efficacy limits, efficacy <strong>and</strong><br />
CRI tradeoffs, <strong>and</strong> technologies for increasing efficacy, illuminance<br />
(the amount of light confined on a surface of a particular size), <strong>and</strong><br />
product yield; In addition, I shall attempt to establish some<br />
photometric measurements <strong>and</strong> guidelines that could leap the <strong>LED</strong><br />
lighting industry onward.<br />
Efficacy <strong>and</strong> Efficiency<br />
Luminous efficacy is a conventional measure of how efficient an<br />
electrical lighting element is. It is a measure of how much luminous flux<br />
is produced per unit of electrical input power <strong>and</strong> therefore is measured<br />
in ‘lumen/watt’ (lm/W). In contrast, luminous efficiency is given in<br />
percentages where both power units must be either in lumens or watts,<br />
depending on what efficiency one is interested in determining. If both<br />
power units are in watts, we get a complete idea of what percentage of<br />
electrical energy we have been able to convert to optical energy at one<br />
instant of time. This is very useful as the world now is more conscious<br />
about energy efficiency. However, when we need a certain amount of<br />
visible light for certain applications, it is helpful to know how many<br />
lumens are being generated per unit of electrical power, which then<br />
easily leads to how many total lumens we can get out of certain<br />
electrical wattage that goes into the lighting system. This is where<br />
efficacy is useful. But when we ask, for example, how much light is still<br />
available to us when a lamp is placed in a fixture where some light is<br />
being hindered by the fixture, we need to determine the luminaire<br />
efficiency which would then be defined by a ratio of two powers in<br />
lumens.<br />
These concepts are important for all lighting in general. For SSL, the<br />
industry focus has been largely on increasing efficacy, which is only a<br />
part of what our concentration needs to be. Further, a basic<br />
underst<strong>and</strong>ing of overall end-end system efficiency can help determine<br />
theoretical <strong>and</strong> practical efficacy limits – very important boundaries of<br />
which we need to be mindful.<br />
In order to determine the theoretical limit for efficacy for any lighting<br />
unit, one must first ask how lumens relate to watts, i.e., what is the watt<br />
equivalent of a lumen. One lumen (lm) is the equivalent of 1.46 milliwatt<br />
(mW) of radiant electromagnetic (EM) power at a frequency of 540<br />
terahertz, or 5.40 x 10¹⁴ Hz, which corresponds to the middle of the<br />
visible light spectrum at around 555 nanometers (nm). An EM field<br />
power level of 1.46mW is rather small; for example, the radio-frequency<br />
(RF) output of a children’s toy two-way radio is several times that<br />
amount.<br />
Since, 1 lm = 1.46 mW, then 1 W = 685 lm at 555 nm.<br />
Therefore highest efficacy theoretically attainable (i.e., 100% efficiency)<br />
is 685 lumens per watt - the output that would be obtained if all the<br />
input power were converted to green light at a 555 nm wavelength, the<br />
light wavelength to which the human eye is most sensitive. The<br />
maximum theoretical efficacy of any light source producing white light<br />
with its entire output power distributed uniformly with respect to<br />
wavelength within the visible region is only 200 lumens per watt. Thus,<br />
by concentrating the output wavelength of any light source near the<br />
555 nm point, we can improve the efficacy beyond that possible with<br />
‘perfect’ white light consisting all visible wavelengths with equal amount<br />
of power in each wavelength. The efficacy of average present-day<br />
fluorescent lamps is about 60 to 70 lumens per watt, although some<br />
high-end ones have higher efficacies.<br />
Here are some examples of efficiency levels of various light sources:<br />
Example 1: a typical inc<strong>and</strong>escent light with15 lm/W efficacy is about<br />
2% efficient; 98% of input power goes to heat.<br />
Example 2: an <strong>LED</strong> or CFL with 100 lm/W efficacy is about 14%<br />
efficient; 86% of input power still goes to heat.<br />
In an inc<strong>and</strong>escent lamp, typically 98% of input electrical power<br />
converts into radiant heat, whereas in a green <strong>LED</strong> with 70 lm/W for<br />
example, almost 90% converts into conductive heat, which must be<br />
removed from the <strong>LED</strong> chip for optimal performance.<br />
Earlier we discussed that if we create a white light source where the<br />
input electrical power is uniformly distributed over all wavelengths in<br />
the visible spectrum, we would achieve the maximum theoretical<br />
efficacy of 200 lm/W; this is a white light source with perfect color<br />
rendering index (CRI)! It then follows that if we attempt to increase this<br />
theoretical efficacy from 200 lm/W by concentrating more light output<br />
power near the green region, the CRI would decrease. Thus, there is an<br />
inherent trade-off between efficacy <strong>and</strong> CRI for white light sources.<br />
Figure1 is the CIE 1931 chromaticity diagram showing all the colors<br />
perceivable by the normal human eye; the point of equal energy line is<br />
shown near the center of the diagram.<br />
www.led-professional.com <strong>LED</strong> professional Review | Nov/Dec 2008 | page 12
Copyright © 2008 Luger Research & <strong>LED</strong>-professional. All rights reserved.<br />
The quaternary compound, AlInGaN has ηint of 50%. This internal<br />
quantum efficiency, which is the efficiency at which light is generated<br />
in the semiconductor via electroluminescence, is further reduced if the<br />
region where the electrical current passes through is not optimally<br />
overlapped with the active material region. This depends on <strong>LED</strong> device<br />
geometry, which in most current <strong>LED</strong> designs does not likely exceed<br />
55%.<br />
The amount of light coming out of the <strong>LED</strong> module is limited by ηext,<br />
which depends on internal reflection <strong>and</strong> absorption by various surfaces<br />
<strong>and</strong> materials in the system including phosphor. Appropriate index<br />
matching <strong>and</strong> high-quality phosphor <strong>and</strong> semiconductor materials will<br />
improve the overlap integral of optical power transfer from the chipencapsulation<br />
ensemble to the external region.<br />
Finally, the efficiency of the driver, ηdr, which delivers the injected<br />
current into the semiconductor diode, limits the overall ηT.<br />
At present, some of the best R&D white <strong>LED</strong>s have been demonstrated<br />
with efficacies of about 125 lm/W. This is likely achieved with the<br />
following efficiencies from the factors described above:<br />
hT = hint × hext × hdr = (AlGaInN:0.5)(device geometry: 0.55)(light<br />
extraction:0.7)(driver:0.95) = 0.182 → 18.2% efficient → 125 lm/W<br />
Figure 1. The CIE-1931 Chromaticity Diagram<br />
<strong>LED</strong> Luminaire Efficacy<br />
For conventional light sources, the lighting industry generally speaks of<br />
lamp efficacy <strong>and</strong> luminaire efficiency, because the lamp is detachable<br />
from the luminaire fixture. However in the case of <strong>LED</strong>s, this is not<br />
always the case. When the <strong>LED</strong> light source is fully integrated with its<br />
luminaire, the efficacy must be that of the entire <strong>LED</strong> luminaire system<br />
<strong>and</strong> luminaire efficiency, known as<br />
luminaire output (lm)<br />
luminaire efficiency (%) = × 100<br />
Eq. (1)<br />
lamp output (lm)<br />
no longer has any meaning. The <strong>LED</strong> luminaire efficacy depends on<br />
several types of efficiency factors; the product of all such factors yields<br />
the total SSL efficiency, ηT, from which one can estimate the <strong>LED</strong><br />
luminaire efficacy. As such,<br />
ηT = ηint × ηext × ηdr Eq. (2)<br />
where ηint, ηext, <strong>and</strong> ηdr are <strong>LED</strong> internal quantum efficiency, light<br />
extraction efficiency, <strong>and</strong> the driver efficiency respectively.<br />
Let us now see how one can arrive at some credible practical limit of a<br />
white <strong>LED</strong> luminaire, assuming that the present-day core technologies<br />
can still be further enhanced.<br />
Most white <strong>LED</strong>s currently use blue <strong>LED</strong>s combined with yellow or<br />
other-color phosphors. High power blue <strong>LED</strong>s use either InGaN of<br />
AlInGaN as the active material.<br />
Several design enhancements <strong>and</strong> strong engineering optimizations on<br />
the overlap integrals may lead to the following scenario:<br />
hT = hint × hext × hdr = (AlGaInN:0.5)(device geometry: 0.9)(light<br />
extraction:0.8)(driver:0.95) = 0.342 → 34.2% efficient → 234 lm/W<br />
The assumption made here is that lumen equivalency of one watt is<br />
taken from the green wavelength region, which is a good approximation<br />
when blue <strong>LED</strong>s are used with yellow phosphors to generate white light.<br />
This exercise shows that we can expect the practical efficacy limit of<br />
white <strong>LED</strong>s to be around 234 lm/W.<br />
<strong>LED</strong> Performance <strong>and</strong> Yield Improvements<br />
<strong>LED</strong> lighting efficacy, brightness, color quality <strong>and</strong> stability depend on<br />
many issues <strong>and</strong> the interdependency of these issues are quite complex.<br />
These depend on chip design, material quality, fabrication accuracy,<br />
robustness of packaging technologies, as well as the comprehensive<br />
mechanical, thermal, <strong>and</strong> optical design <strong>and</strong> engineering. Among these<br />
are material morphology <strong>and</strong> uniformity factors that largely contribute<br />
to the well-known compound semiconductor yield problem. High<br />
quality epitaxial growth of compound semiconductors on suitable<br />
substrates will help increase the product yield substantially. In order to<br />
make <strong>LED</strong> lights stable, manufacturers must perform firm burn-in,<br />
reliability, <strong>and</strong> accelerated aging tests at sufficiently high temperatures.<br />
Many of these technologies can be drawn from the vast work already<br />
done by the telecommunication lasers <strong>and</strong> <strong>LED</strong>s, which are documented<br />
in numerous Telcordia (formerly Bellcore) requirements.<br />
Even when white <strong>LED</strong>s will operate at much higher efficacies than today,<br />
there will still be a significant amount of heat that must be removed<br />
from the chip because of the practical efficacy limit I discussed earlier.<br />
www.led-professional.com <strong>LED</strong> professional Review | Nov/Dec 2008 | page 13
Copyright © 2008 Luger Research & <strong>LED</strong>-professional. All rights reserved.<br />
This will require very effective thermal management in the module that<br />
must be achieved via elements with suitable thermal conduction<br />
properties <strong>and</strong> mechanical design for optimum heat flow. Development<br />
<strong>and</strong> implementation of these technologies will ensure very long lifetimes<br />
<strong>and</strong> will also provide more uniform products; this will substantially<br />
reduce binning requirements for <strong>LED</strong> luminaires that greatly concern<br />
the customers today.<br />
Photometric Measurements <strong>and</strong> Guidelines<br />
The SSL industry has made notable progress in establishing photometric<br />
measurements <strong>and</strong> guidelines in the past few years. The recent updates<br />
<strong>and</strong> releases of IESNA LM-79, LM-80 <strong>and</strong> ANSI/NEMA/ANSLG C78.377<br />
st<strong>and</strong>ards are a testament to such. The United States DOE also recently<br />
published a preliminary document, “Manufacturer’s Guide for Qualifying<br />
Solid-State Lighting Luminaires,” that outlines performance benchmarks<br />
for its ‘Energy Star’ criteria. The document lists DOE’s certified facilities<br />
that conduct Energy Star qualification testing <strong>and</strong> details approval<br />
procedures.<br />
<strong>LED</strong>s have numerous applications in the lighting <strong>and</strong> display industries<br />
<strong>and</strong> therefore, many more st<strong>and</strong>ards <strong>and</strong> guidelines will need to be<br />
adopted in the near future. Since lighting <strong>and</strong> display products each<br />
provide distinctly different functions, primary purpose of the light<br />
sources need to be distinguished. A lighting unit needs to have certain<br />
amount of brightness, light distribution, <strong>and</strong> color properties because<br />
we need it to provide illumination in certain areas of interest so that we<br />
can effectively view other objects. In contrast, a display unit needs to<br />
have certain amount of brightness <strong>and</strong> color properties so that we can<br />
effectively view information on it, but it does not need to provide us<br />
illumination to view other objects.<br />
Today we often see <strong>LED</strong> manufacturers <strong>and</strong> retailers tout ‘super bright’<br />
<strong>LED</strong>s for many types of luminaires. This is not always desirable from the<br />
user’s st<strong>and</strong>point because they will not stare at the luminaires, but will<br />
require that it provides light where they want them; users need enough<br />
light for specific applications, but do not appreciate too much light that<br />
can produce glare <strong>and</strong> discomfort <strong>and</strong> wastes energy. Therefore a<br />
luminaire must be bright enough as well as have proper optical radiation<br />
properties to illuminate areas of interest.<br />
In order to design a luminaire, one must then design it for a certain level<br />
of brightness – the quantity known as luminance. Luminance is usually<br />
measured in nits, which is c<strong>and</strong>ela/square meter (cd/m2). A luminaire<br />
must be able to radiate certain amount of light to illuminate certain<br />
surface. An <strong>LED</strong> luminaire designer ultimately needs to measure the<br />
illuminance (the amount of light incident or confined on a surface) in<br />
lux or footc<strong>and</strong>les to ensure the desired amount of light hitting on a<br />
surface; lux is measured in lumen/square-meter (lm/m2).<br />
To simplify things <strong>and</strong> considering only normal incidence, luminance <strong>and</strong><br />
illuminance are related as the following: (Reference: IESNA TM-11-00)<br />
L × S<br />
E v<br />
= Eq. (3)<br />
2<br />
D<br />
Where E ν<br />
is the illuminance, L is the luminance of the luminaire, S is the<br />
surface area of the luminaire, <strong>and</strong> D is the normal distance from the<br />
center of the luminaire to the center of the illuminated surface. This is<br />
the well-known inverse square relation that Swiss German physicist<br />
Johann Lambert (1728 – 1777) helped formulate in the 18th century.<br />
Since many luminaire <strong>and</strong> lighting designers use ‘feet’ rather than<br />
‘meters’ for spatial parameters, this equation is often written as:<br />
Eq. (4)<br />
In this equation, the measurement units are the following:<br />
• L is in nits<br />
• S is in square-feet<br />
• D is in feet, <strong>and</strong><br />
• E ν<br />
is in footc<strong>and</strong>les.<br />
Using this functional relationship, the following section exemplifies the<br />
importance of a new luminaire design that is more energy efficient <strong>and</strong><br />
provides more light where the user needs it compared to the more<br />
popular designs seen today.<br />
Example of an <strong>LED</strong> luminaire application – under cabinet lighting<br />
Here I contrast two designs for an <strong>LED</strong> under cabinet luminaire that will<br />
demonstrate how to interplay brightness <strong>and</strong> size to achieve the desired<br />
illuminance at the counter top surface using less energy to produce<br />
more uniform illumination.<br />
In Design A (Figure 2), the <strong>LED</strong> luminaire surface area is approximately<br />
4.8 a.u. where a.u. is the arbitrary unit of square area. There are 40<br />
discrete <strong>LED</strong>s within this surface area. In Design B (Figure 3), the <strong>LED</strong><br />
luminaire surface area is approximately 3.0 a.u. <strong>and</strong> there are 18 <strong>LED</strong>s<br />
within this surface area.<br />
Since the distance D is the same in both cases, in order to produce the<br />
same illuminance at the counter top (assuming only normal angle<br />
incidence), the following yields:<br />
E<br />
L<br />
× S<br />
D<br />
E<br />
L<br />
× S<br />
A A<br />
B B<br />
vA<br />
= =<br />
2 vB<br />
=<br />
Eq.(5)<br />
2<br />
which follows that<br />
L ×<br />
A<br />
× S<br />
A<br />
= LB<br />
S <strong>and</strong> hence<br />
B<br />
D<br />
S<br />
L ×<br />
A<br />
B<br />
= LA<br />
;<br />
S<br />
B<br />
Since SA = 4.8 a.u. <strong>and</strong> SB = 3.0 a.u., LB = LA (1.6), meaning that the<br />
luminance in the Luminaire B group (3 luminaires) must be 60% more<br />
than that of the single Luminaire A. This implies that 18 <strong>LED</strong>s in the<br />
Luminaire B group need to produce 60% more brightness to equal the<br />
brightness from 40 <strong>LED</strong>s in Luminaire A. This means that the <strong>LED</strong>s in<br />
Luminaire B need to have more than twice the brightness than the <strong>LED</strong>s<br />
in Luminaire A.<br />
www.led-professional.com <strong>LED</strong> professional Review | Nov/Dec 2008 | page 14
Copyright © 2008 Luger Research & <strong>LED</strong>-professional. All rights reserved.<br />
The uniformity of light distribution in Design A is also much better <strong>and</strong><br />
the <strong>LED</strong>s will run more efficiently for a longer period of time compared<br />
to those in Design B.<br />
The reader should note that the calculations in this example ignore the<br />
cosine dependence of illuminance as well as the full integration over the<br />
counter surface in order to make simple arguments; nevertheless,<br />
comparisons in the designs provide sufficient validity on an “average”<br />
basis.<br />
However, most under cabinet luminaires available in retail today are<br />
discrete luminaires such as the ones in Design B; these typical under<br />
cabinet discrete luminaires of today as seen in the Figure 5 below is less<br />
effective in illuminating the counter top <strong>and</strong> they require excessive<br />
brightness to produce acceptable counter top illumination.<br />
Figure 2: Design A Schematic showing a single luminaire of 4.8 a.u. surface area containing 40 <strong>LED</strong>s<br />
Figure 5: Typical under cabinet lights from most retailers of today<br />
Figure 3: Design B Schematic showing 3 luminaires of 3.0 a.u. surface area containing 18 <strong>LED</strong>s<br />
There are many <strong>LED</strong> under-cabinet luminaires being offered by many<br />
retailers. Only a few resemble Design A, such as this one from Global<br />
Green Lighting shown in Figure 4.<br />
Conclusion<br />
In this paper, I have presented some fundamental basics on SSL efficacy<br />
limits <strong>and</strong> discussed the essential efficiency factors that comprise the<br />
efficacy of an <strong>LED</strong> luminaire. I have also emphasized the such key<br />
constituents for SSL development as efficacy <strong>and</strong> CRI tradeoffs, <strong>and</strong><br />
technologies for increasing efficacy, illuminance (light output), <strong>and</strong><br />
product yield; in addition, I have provided a real-life example of an<br />
under cabinet luminaire design to demonstrate the importance of<br />
interplaying size <strong>and</strong> brightness of a luminaire to provide more light<br />
where the user needs it while being significantly more energy efficient.<br />
This groundwork is intended to help the current industry further<br />
establish relevant sets of photometric measurements <strong>and</strong> guidelines<br />
that could accelerate the advancement of the <strong>LED</strong> lighting industry.<br />
Figure 4: Under cabinet light from Global Green Lighting retailer<br />
www.led-professional.com <strong>LED</strong> professional Review | Nov/Dec 2008 | page 15
Copyright © 2008 Luger Research & <strong>LED</strong>-professional. All rights reserved.<br />
CIE 1964 Colorimetric<br />
Observer Chart Improves<br />
White Light Quality<br />
Peter Pachlar, Tridonic Atco Optoelectronics<br />
The most popular concept of phosphor-converted white <strong>LED</strong>s relies on<br />
a mixture of blue <strong>LED</strong> light (a fraction of which is exciting green, yellow<br />
or red phosphors) <strong>and</strong> the phosphor emission to generate a broad white<br />
light spectrum. With the advent of a new generation of high brightness<br />
<strong>LED</strong>s especially in the blue spectral range this white light technology<br />
gains maturity for a successful market penetration within the next<br />
years [1-4]. None the less, there are still major challenges ahead which<br />
on the one h<strong>and</strong> are originating from the specific dem<strong>and</strong>s of the<br />
markets <strong>and</strong> on the other h<strong>and</strong> from the perception of the white light<br />
quality. To quantify the latter the spectral properties of the <strong>LED</strong> emission<br />
are reduced to chromaticity coordinates that are derived from the<br />
colour sensitivity of the human eye. Generally, the industrial approach<br />
on <strong>LED</strong> chromaticity is based on the CIE 1931 st<strong>and</strong>ard observer chart<br />
albeit latter is known to pose the problem of an incorrect blue color<br />
matching function (CMF) in combination with the narrow b<strong>and</strong> emission<br />
of the blue <strong>LED</strong> light [5]. Moreover, for some of the primary <strong>LED</strong><br />
applications like the lighting of a white wall or the backlighting of signs<br />
<strong>and</strong> boards the alternative CIE 1964 supplementary st<strong>and</strong>ard colorimetric<br />
observer chart provides better results with regard to color perception of<br />
the <strong>LED</strong> light than the CIE 1931 st<strong>and</strong>ard does. This behavior is not that<br />
striking since the two charts diverge in the evaluation of visual<br />
perception <strong>and</strong> the CIE 1964 chart has been recommended [6] <strong>and</strong><br />
proven [7] to be superior for visual color matching of fields having<br />
angular subtense of more than 4° at the eye of the observer.<br />
The black hexagon in Figure 1 depicts the tolerance window for TALEXX<br />
white <strong>LED</strong>s having a correlated color temperature (CCT) of 6500 K<br />
within the CIE 1931 chart. The yellow – blue line indicates the actual<br />
spread of fabrication of individual <strong>LED</strong>s (from a specific blue <strong>LED</strong> bin).<br />
For white <strong>LED</strong>s matching the extremal points of this line an observer<br />
perceives some yellowish – bluish differences of the hue pertaining to<br />
side by side application of suchlike <strong>LED</strong>s for the illumination of larger<br />
areas (e.g. a white wall) or backlighting of signs <strong>and</strong> boards. On the<br />
other h<strong>and</strong>, this conspicuity is much more pronounced along the other<br />
directions indicated within the tolerance window. For the green – pink<br />
line (the spread of fabrication typically matches about ¼ of the height<br />
of this distance) the intersections correspond to a MacAdam ellipse of<br />
step 6.6 while the intersections of the cyan – amber line roughly<br />
correspond to a MacAdam step 5 ellipse.<br />
Figure 2: Impact of the variation of the mean blue dominant wavelength (for <strong>LED</strong> bins of 455, 460 <strong>and</strong> 464 nm)<br />
on the CIE 1931 x,y coordinates for the same amount <strong>and</strong> composition of colour conversion material<br />
Figure 1: St<strong>and</strong>ard tolerance window for TALEXX white <strong>LED</strong>s having a correlated color temperature of 6500 K<br />
within the CIE1931 chart. The grey ellipse plotted in this image corresponds to a MacAdam step 5 ellipse<br />
Figure 2 shows the impact of a variation of the mean blue dominant<br />
wavelength (for three different <strong>LED</strong> bins) on the CIE x,y coordinates<br />
together with the spread of fabrication. As shown in this figure, using<br />
only one type of colour conversion material for the individual <strong>LED</strong> bins<br />
of different mean dominant blue wavelengths results in diverse CIE<br />
chromaticity coordinates of the respective white <strong>LED</strong>s, both for the x as<br />
well as the y coordinates. The st<strong>and</strong>ard process of TridonicAtco accounts<br />
for variation in wavelength of the blue <strong>LED</strong> bin by adjusting the amount<br />
<strong>and</strong> concentration of the colour conversion material. A combination of<br />
yellow <strong>and</strong> green phosphors <strong>and</strong> the adjustment of their fractions in<br />
dependence of the dominant wavelength allows one to counteract for<br />
the variation of the ycoordinates, while the variation of the x-coordinates<br />
can be easily counteracted by the overall phosphor concentration or<br />
the amount of colour conversion material. However, taking the CIE 1931<br />
chart as a reference system for color matching may pose some problems<br />
regarding reality, especially for applications like the side by side<br />
illumination of larger objects.<br />
www.led-professional.com <strong>LED</strong> professional Review | Nov/Dec 2008 | page 16
Copyright © 2008 Luger Research & <strong>LED</strong>-professional. All rights reserved.<br />
Figure 3: CIE 1931 x,y chromaticity coordinates for three <strong>LED</strong>s that partially were fabricated from different bins<br />
of mean dominant blue wavelengths (461 nm <strong>and</strong> 448 nm)<br />
Figure 3 shows the CIE 1931 x,y chromaticity coordinates of three white<br />
<strong>LED</strong>s that partially were fabricated from different bins of mean dominant<br />
blue wavelengths (<strong>LED</strong> W1: 461 nm, <strong>LED</strong>s W3 <strong>and</strong> W4: 448 nm). The<br />
corresponding emission spectra of the three white <strong>LED</strong>s W1, W3 <strong>and</strong><br />
W4 are depicted in Figure 4. Albeit the chromaticity coordinates of the<br />
<strong>LED</strong>s W1 <strong>and</strong> W4 show a high diversity, especially with respect to the y<br />
coordinate, they were found to reveal similar subjective color perception<br />
by a number of test persons when these <strong>LED</strong>s are mounted adjacent to<br />
each other <strong>and</strong> used for backlighting of signs or to illuminate white<br />
walls or milk glasses. As evident from a comparison of the <strong>LED</strong>s W1 <strong>and</strong><br />
W2, the lower the dominant wavelength of the blue <strong>LED</strong> bin the higher<br />
must be the value of the y coordinate in the CIE 1931 chart in order to<br />
achieve agreeing color perception for an observer.<br />
coordinates <strong>and</strong> which were fabricated from blue <strong>LED</strong>s having dominant<br />
wavelengths of 461 nm <strong>and</strong> 448 nm, respectively, the hue of the <strong>LED</strong><br />
pumped at 448 nm appears to be reddish in comparison to that of the<br />
<strong>LED</strong> pumped at 461 nm. Successively increasing the value of the y<br />
coordinate for the 448 nm <strong>LED</strong> reduces this difference till for a specific<br />
y value both <strong>LED</strong>s have the same color perception (see Figure 3). Further<br />
increasing the y value of <strong>LED</strong> to even higher values reverses the<br />
perception for an observer: the 448 nm <strong>LED</strong> becomes comparably<br />
greenish while the initially comparable greenish 461 nm <strong>LED</strong> becomes<br />
comparably reddish. This means that with respect to the real world<br />
observation the calculation of the chromaticity coordinates according<br />
to the CIE 1931 chart reveals a totally contrary result: the chromaticity<br />
coordinates of the <strong>LED</strong>s W1 <strong>and</strong> W4, which have an agreeing colour<br />
perception for an observer, show a strong deviation from each other.<br />
<strong>LED</strong>s W1 <strong>and</strong> W3 have pretty the same x <strong>and</strong> y-chromaticity coordinates<br />
(see Figure 3), which means that a st<strong>and</strong>ard observer shouldn’t be able<br />
to distinguish the color of the <strong>LED</strong>s W1 <strong>and</strong> W3, a behaviour that is also<br />
in contrast to the experimental observation. On the other h<strong>and</strong>, Figure<br />
5 depicts the corresponding chromaticity coordinates of the 3 <strong>LED</strong>s<br />
within the CIE 1964 10° supplementary st<strong>and</strong>ard colorimetric observer<br />
chart. In total accordance with the experimental observation, in this<br />
chart the <strong>LED</strong>s W1 <strong>and</strong> W4 have more or less congruent chromaticity<br />
coordinates, while especially the y- chromaticity coordinate for the <strong>LED</strong><br />
W3 shows a significant deviation from that of the two other <strong>LED</strong>s,<br />
which agrees with the noticeable deviation of the color perception of<br />
this <strong>LED</strong> by an observer.<br />
Figure 5: Chromaticity coordinates according to CIE 1964 chart for the three <strong>LED</strong>s W1, W3 <strong>and</strong> W4<br />
Figure 4: Emission spectra of the <strong>LED</strong>s W1, W3 <strong>and</strong> W4 (see Figure 3)<br />
On the other h<strong>and</strong> if the amount of color conversion material applied to<br />
the <strong>LED</strong>s of different dominant blue wavelength bins was adjusted in<br />
order to achieve the same CIE 1931 x,y coordinates (<strong>LED</strong>s W1 <strong>and</strong> W3),<br />
the subjective color perception was found to be different. If one opposes<br />
the white <strong>LED</strong>s W1 <strong>and</strong> W3, which have the same CIE 1931 chromaticity<br />
With regard to this, the CIE 1964 supplementary st<strong>and</strong>ard colorimetric<br />
observer chart turns out to be superior <strong>and</strong> more suitable than the CIE<br />
1931 chart in order to valuate the chromaticity of <strong>LED</strong>s, in particular for<br />
illumination <strong>and</strong> signage applications. Therefore, the chromaticity<br />
assessment of TALEXX products will be further on h<strong>and</strong>led on the basis<br />
of the large field CIE 1964 supplementary st<strong>and</strong>ard colorimetric observer<br />
chart in order to provide the costumers individual <strong>LED</strong>s with best-inclass<br />
<strong>and</strong> reliable color matching <strong>and</strong> to guarantee <strong>LED</strong>s that excel by<br />
the conformity of their visual perception.<br />
References:<br />
[1] E. F. Schubert <strong>and</strong> J. K. Kim, “Solid-state light sources getting smart” Science vol. 308, 1274 – 1278, (2005)<br />
[2] A. A. Bergh, “Blue laser diode (LD) <strong>and</strong> light emitting diode (<strong>LED</strong>) applications”, Phys. Stat. Solidi (a) vol. 201,<br />
2740 - 2754, (2004)<br />
[3] E. F. Schubert, J. K. Kim, H. Luo, J. Q. Xi, “Solid-state lighting – A benevolent technology”, Rep. Prog. Phys. vol.<br />
69, 3069 - 3099, (2006)<br />
[4] M. R. Krames, O. B. Shchekin, R. Mueller-Mach, G. O. Mueller, L. Zhou, G. Harbers, M. G. Craford, “Status <strong>and</strong><br />
Future of High-Power Light-emitting Diodes for Solid-State Lighting”, J. Display Technol. vol. 3, 160 – 175, (2007)<br />
[5] Á. Borbély, J. Sch<strong>and</strong>a, “Colour matching using <strong>LED</strong>s as primaries”, Col. Res. & Appl. 29, 360-364, (2004)<br />
[6] A. R. Robertson, “Colorimetry”, Rep. Prog. Phys. 41, 469 – 510, (1978)<br />
[7] I. Nimeroff, “Field trial of the 1959 CIE supplementary st<strong>and</strong>ard observer proposal”, J. Opt. Soc. Am. 54, 696<br />
– 704, (1964)<br />
www.led-professional.com <strong>LED</strong> professional Review | Nov/Dec 2008 | page 18
Copyright © 2008 Luger Research & <strong>LED</strong>-professional. All rights reserved.<br />
White Light <strong>LED</strong>s –<br />
Importance of Accepted<br />
Measurement St<strong>and</strong>ards<br />
> Dr. Thomas Nägele; Instrument <strong>System</strong>s GmbH, Munich<br />
The breathtaking development of white light <strong>LED</strong>s in recent years has led<br />
to significant market potential for a range of br<strong>and</strong> new applications. The<br />
high efficiency of these <strong>LED</strong>s now means that solutions for room lighting,<br />
automotive headlights <strong>and</strong> backlighting for LCD displays can be realized.<br />
The advantages of their reduced energy requirements are apparent - for<br />
example, the running time of battery operated devices such as mobile<br />
phones <strong>and</strong> notebook computers can be extended considerably.<br />
For general room lighting, the ability to vary the color temperature of a<br />
<strong>LED</strong> lamp allows new lighting designs. In automotive applications, the<br />
reduced energy requirement helps to reduce petrol consumption <strong>and</strong><br />
CO2 emissions. Moreover, their long lifetime minimizes service<br />
requirements for headlights - i.e. the <strong>LED</strong>s will in all probability outlive<br />
the lifetime of the car itself. And lastly, the technical characteristics of<br />
<strong>LED</strong>s also bring significant advantages for adaptable headlight<br />
technology when compared to conventional forms of lighting. All of<br />
these aspects additionally mean that these developments in automotive<br />
safety may also find application in a wider market.<br />
Attaining <strong>and</strong> maintaining the necessary regulatory lighting st<strong>and</strong>ards<br />
still represents challenges for <strong>LED</strong> manufacturers, <strong>and</strong> much research is<br />
currently being made into methods to reduce <strong>and</strong> control the varying<br />
quality inherent in the production process. Indeed, the proper<br />
characterization of the light emission parameters forms an important<br />
aspect of the quality control process. However, this characterization, in<br />
particular for white light <strong>LED</strong>s, is as a consequence of their optical<br />
properties somewhat complicated.<br />
Optical Properties of White Light <strong>LED</strong>s<br />
The intercomparability of measurement results is influenced by a variety of<br />
factors. Both the fundamental technology underlying the structure of the<br />
<strong>LED</strong> itself <strong>and</strong> the measurement system used for characterization can play<br />
a decisive role. In order to ensure precise measurement of the <strong>LED</strong> emission,<br />
spectroradiometers have now become the preferred tool of choice over<br />
photometers <strong>and</strong> colorimeters. Spectroradiometers achieve better accuracy<br />
by obviating the need for optical filters <strong>and</strong> by making a computational<br />
calculation for the photometric <strong>and</strong> colorimetric parameters.<br />
Inherent properties of the <strong>LED</strong>s directly resulting from the manufacturing<br />
process also influence the measurement results. White light <strong>LED</strong>s,<br />
usually comprising a blue emitting <strong>LED</strong>-chip coated with a yellow<br />
emitting phosphor, are particularly difficult to manufacture with<br />
consistent characteristics. Furthermore, well known factors such as<br />
burn-in time, operating temperature, aging behavior, etc., each make<br />
their own contribution to the emission performance of the <strong>LED</strong>.<br />
Dependence on Temperature<br />
Above all for modern high-power <strong>LED</strong>s, proper thermal management<br />
<strong>and</strong> the operating temperature of the <strong>LED</strong> play a critical role in terms of<br />
reproducibility of operation. The energy density in such devices is<br />
considerably higher than that for conventional <strong>LED</strong>s, resulting in the<br />
generation of significantly more heat. Continuous operation of highpower<br />
<strong>LED</strong>s remains a major technical challenge, as varying temperature<br />
can be responsible for changes in the emission spectrum.<br />
Figure 1: Dependence of the spectral emission of white light <strong>LED</strong>s on temperature<br />
Figure 1 illustrates the spectral dependence of an <strong>LED</strong> emitting warm<br />
white light over a temperature range from 20° to 80°C. Generally, in<br />
order to maintain a constant <strong>and</strong> uniform impression of brightness <strong>and</strong><br />
color in continuous operation, the heat generated in high-power <strong>LED</strong>s<br />
must be effectively dissipated. For characterization purposes, however,<br />
unambiguous indication of the thermal behavior of an <strong>LED</strong> is best<br />
gained through active cooling, for example through the use of a Peltier<br />
element, thus allowing examination of the <strong>LED</strong> at predetermined<br />
temperatures. As can be clearly seen in Figure 1, for increasing<br />
temperature the blue emission peak shifts to longer wavelengths <strong>and</strong><br />
the total emission intensity decreases (the latter effect being typical of<br />
<strong>LED</strong>s in general). These spectral <strong>and</strong> intensity changes also cause an<br />
alteration in the perceived color. In all industries associated with light<br />
emission, perceived color has long been described by the concept of<br />
color temperature. Table 1 below shows the calculated effective (i.e.<br />
nearest) color temperature for the <strong>LED</strong> emission illustrated in Figure 1.<br />
Operating Temperature [°C] Color Temperature [K]<br />
80 3222<br />
70 3203<br />
60 3187<br />
50 3173<br />
40 3161<br />
30 3151<br />
20 3144<br />
10 3141<br />
Table 1: Change in the color temperature Tn for changing operating temperature of a white light <strong>LED</strong><br />
www.led-professional.com <strong>LED</strong> professional Review | Nov/Dec 2008 | page 20
Copyright © 2008 Luger Research & <strong>LED</strong>-professional. All rights reserved.<br />
Between 20° <strong>and</strong> 80° C, the effective color temperat ure is shifted<br />
considerably <strong>and</strong> leads to a significant change in the perceived color.<br />
This property of white light <strong>LED</strong>s is especially problematic in general<br />
lighting applications <strong>and</strong> hinders the development of qualitative highgrade<br />
products.<br />
An additional issue is visible during the burn-in process for <strong>LED</strong>s. That<br />
is, as long as thermal equilibrium has not yet been reached, the electrical<br />
<strong>and</strong> optical characteristics of the <strong>LED</strong> also undergo change.<br />
Using a combination of goniometer <strong>and</strong> spectroradiometer, the luminous<br />
intensity distribution <strong>and</strong> the color temperature can be measured over<br />
the spatial radiation pattern of a white light <strong>LED</strong>. Figure 3 depicts these<br />
measurements for both a modern high-power white light <strong>LED</strong> <strong>and</strong> a<br />
st<strong>and</strong>ard 5mm <strong>LED</strong>.<br />
Figure 2: The red squares show the dependence of the total irradiance of a white light <strong>LED</strong> after switching on, the<br />
blue squares show the changing color temperature Tn<br />
Figure 2 illustrates the burn-in process of a white light <strong>LED</strong> stabilized to<br />
40°C - the photometric luminous flux (black squares) of the <strong>LED</strong> falls<br />
over a period of 10 seconds, while at the same time the effective color<br />
temperature rises (white squares). This relatively long stabilization<br />
phase must be accounted for if comparison of measurement data is to<br />
be made, i.e. measurements made in the production environment can<br />
differ from those made under stable laboratory conditions.<br />
The final production step for <strong>LED</strong>s is the optical characterization <strong>and</strong><br />
the subsequent sorting into so-called BINS. Typically, this measurement<br />
<strong>and</strong> classification process occurs 20 to 30ms after the <strong>LED</strong> is switched<br />
on, even if the <strong>LED</strong> has not yet been thermally stabilized. Nonetheless,<br />
the specifications given by the manufacturer in the data sheet usually<br />
correspond to this type of production environment measurement.<br />
Customers receiving the <strong>LED</strong> must then often perform their own<br />
measurement under stable conditions in order to appropriately<br />
characterize the <strong>LED</strong> for the intended use.<br />
Spatial Radiation Pattern<br />
In order to properly determine their color temperature, the spatial<br />
radiation pattern of white light <strong>LED</strong>s has to be considered. Contrary to<br />
single color <strong>LED</strong>s, the perceived color of a white light <strong>LED</strong> can change as<br />
a function of the emission angle. This is a direct consequence of the<br />
nature of the technology utilized by the manufacturer to coat the blue<br />
<strong>LED</strong>-chips with phosphors. Differing st<strong>and</strong>ards among manufacturers<br />
mean that this change can amount to more than 1000 K.<br />
Figure 3: Spatial radiation pattern <strong>and</strong> color temperature of the emission of white light <strong>and</strong> st<strong>and</strong>ard <strong>LED</strong>s, measured<br />
at a distance of 250mm<br />
The luminous flux of high-power <strong>LED</strong>s is usually measured with an<br />
integrating sphere, alternatively the averaged luminous intensities<br />
I<strong>LED</strong>-A or I<strong>LED</strong>-B. With an integrating sphere, the measured spectrum is<br />
integrated over the entire emission hemisphere, whereas a simple<br />
luminous intensity measurement only gathers light over a narrow solid<br />
angle. If the color temperature is determined under conditions for<br />
measuring I<strong>LED</strong>- B, the result is different to that obtained with an<br />
integrating sphere (table 2).<br />
Color temperature<br />
high-power <strong>LED</strong> [K]<br />
Color temperature<br />
5mm <strong>LED</strong> [K]<br />
Iled B 3145 5748<br />
Integrating sphere 3112 6804<br />
Table 2: The effective color temperatures for both <strong>LED</strong>s as determined from measurement conditions appropriate<br />
to that for an integrating sphere <strong>and</strong> for I<strong>LED</strong>-B<br />
Were the discrepancy for the measured effective color temperatures of<br />
a white light <strong>LED</strong> as apparent as that for the st<strong>and</strong>ard <strong>LED</strong> (table 2), the<br />
measurement geometry used to determine the specifications would<br />
have to be indicated appropriately in the data sheet.<br />
Aging of white light <strong>LED</strong>s<br />
Modern high-power <strong>LED</strong>s require a relatively long burn-in phase until<br />
little or no further change occurs over time. The aging process of a 1W<br />
white light <strong>LED</strong> over a time period of 2000 hours is shown in Figure 4 [1].<br />
Over this time frame not only the brightness varies, but also the spectral<br />
distribution. During the aging process, the effective color temperature<br />
changes by several 100K from 6900 to 6200K.<br />
www.led-professional.com <strong>LED</strong> professional Review | Nov/Dec 2008 | page 21
Copyright © 2008 Luger Research & <strong>LED</strong>-professional. All rights reserved.<br />
of the spectrometer is too low, the blue range can be falsely represented.<br />
Just as for a laser line, the measured blue spectrum of the <strong>LED</strong> is<br />
broadened <strong>and</strong> the peak reduced. In contrast, the broader, yellowish<br />
component of the phosphor emission is not affected. The net result<br />
however is a change to the overall spectrum.<br />
The effect that the spectrometer resolution can have on a measurement<br />
is illustrated in table 3. The same <strong>LED</strong> was measured using a spectrometer<br />
with variable resolution.<br />
Figure 4: Aging of a high-power white light <strong>LED</strong><br />
Spectral<br />
resolution [nm]<br />
Photometric Integral<br />
[cd]<br />
Color Temperature<br />
[K]<br />
1 0.877 5699<br />
2 0.875 5695<br />
5 0.872 5692<br />
10 0.873 5676<br />
Table 3: Dependence of the effective color temperature on the spectral resolution<br />
Lighting manufacturers have to take this behavior into account at the<br />
design stage of the product in order to ensure that there are no quality<br />
issues associated with degradation of performance. Intelligent feedback<br />
<strong>and</strong> control of the <strong>LED</strong> over its entire lifetime is one solution to this<br />
problem.<br />
Measurement Technology<br />
As highlighted above, spectroradiometers have now become the<br />
st<strong>and</strong>ard for the measurement of the optical parameters of <strong>LED</strong>s.<br />
Compared to currently available photometers <strong>and</strong> colorimeters,<br />
spectroradiometers obviate the need for the spectral filters that,<br />
through tolerances in the manufacturing process, are often not<br />
spectrally matched to the tristimulus curves. However, the optical<br />
performance of the spectrometer is also a determining factor for the<br />
validity of the measurement result. Two critical parameters are the<br />
spectral resolution <strong>and</strong> the suppression of stray light.<br />
Spectral Resolution<br />
In general, the spectral resolution of a spectrometer can be determined<br />
by measuring laser light whose spectral linewidth is much smaller – the<br />
resulting “full width half maximum” of the spectrum then corresponds<br />
to the spectral resolution of the spectrometer.<br />
For broad-b<strong>and</strong> continuous light sources such as halogen lamps, the<br />
spectral performance of a spectrometer has no recognizable influence<br />
on the measurement. However, for narrow-b<strong>and</strong> <strong>LED</strong> sources, insufficient<br />
spectral resolution can artificially broaden the measured emission<br />
spectrum <strong>and</strong> thus lead to falsification of the color values.<br />
The emission from white light <strong>LED</strong>s usually consists of a relatively<br />
narrow b<strong>and</strong> of blue emission superimposed on the spectrally broad<br />
emission of the coating phosphor. For proper determination of the<br />
effective color temperature, it is important to know the exact height<br />
<strong>and</strong> width relationship for the blue component of the light relative to<br />
that of the spectrally broader yellow phosphor. If the spectral resolution<br />
While the photometric value remains more or less unchanged, the effective<br />
color temperature shifts by 24 Kelvin. In order to guarantee sufficient<br />
accuracy for the measured color coordinates, the spectral resolution of<br />
the spectrometer should generally be in the range of 2 to 3nm.<br />
Stray Light<br />
In addition to the spectral resolution, the stray light performance of a<br />
spectrometer also plays a critical role for the correct measurement of<br />
color coordinates for white light <strong>LED</strong>s.<br />
The exact determination of the stray light behavior of a spectrometer<br />
over the entire spectral range normally requires the use of a tunable<br />
laser source in a complex measurement scheme [2]. However, with help<br />
from a halogen lamp <strong>and</strong> a suitable 450nm long pass optical filter, the<br />
stray light suppression afforded by a spectrometer for broad-b<strong>and</strong> light<br />
sources can be adequately assessed. Figure 5 shows measurement of<br />
the filtered light from the halogen lamp for 3 different spectrometer<br />
types - 2 array spectrometers <strong>and</strong> a double monochromator. The former<br />
achieve 2.5 or 3.5 orders of magnitude for stray light suppression, the<br />
double monochromator significantly more.<br />
Figure 5: Stray light suppression for different spectrometers for filtered light from a halogen lamp: double monochromator<br />
(black), array spectrometer #2 (blue), array spectrometer #1 (red)<br />
www.led-professional.com <strong>LED</strong> professional Review | Nov/Dec 2008 | page 22
Copyright © 2008 Luger Research & <strong>LED</strong>-professional. All rights reserved.<br />
In the case of spectroradiometers, these are usually calibrated with the<br />
use of halogen lamps with broad-b<strong>and</strong> emission. A common st<strong>and</strong>ard,<br />
available from almost all national laboratories, is a 1000W FEL lamp<br />
with a color temperature of approx. 3100 K.<br />
Halogen lamps have the disadvantage that the emission energy in the<br />
blue spectral range only reaches roughly 10% of that at 800nm. The<br />
total signal measured per wavelength interval during the calibration<br />
process is the sum of the light from the halogen lamp in that same<br />
interval plus the stray light component. Insufficient stray light<br />
suppression in the blue can thus lead to erroneous values in this region<br />
of the calibration file. For the array spectrometer #1, the stray light<br />
contribution around 430nm amounts to almost 5%, while that for the<br />
reference double monochromator is negligible due to its superior stray<br />
light suppression.<br />
The effect this can have on measured values for white light <strong>LED</strong>s is seen<br />
in Figure 6. The spectrum from the same <strong>LED</strong> as in Figure 5 is recorded<br />
by the same 3 spectrometers using coupling optics corresponding to<br />
those required for I<strong>LED</strong>-B measurements. For the array spectrometer<br />
#2 (the one with the highest stray light contribution), the blue spectral<br />
peak is noticeably smaller than for the other two spectrometers.<br />
Normalization of the actual measurement values is made through use<br />
of the calibration file, but the erroneous values in the blue spectral<br />
region within this file lead to wrongly normalized data in this part of the<br />
spectrum.<br />
The color coordinates <strong>and</strong> the color temperature are affected directly<br />
(see table 4), while the photometric values are not.<br />
Spectrometer<br />
Photometric x- y-<br />
Integral [cd] coordinate coordinate<br />
Tn[K]<br />
Double Monochromator 51.9 0.3169 0.3425 6209<br />
Array Spectrometer #1 52.1 0.3173 0.3444 6186<br />
Array spectrometer #2 51.8 0.3181 0.3453 6138<br />
Table 4: Effect of the stray light suppression of the different spectrometers on the color values<br />
Figure 6: Spectrum of a white light <strong>LED</strong> measured with three calibrated, but different spectrometers<br />
Summary<br />
As the key light source for the future, white <strong>LED</strong>s represent a major<br />
challenge for optical measurement methods. Factors directly affecting<br />
the light source itself, such as operating temperature, the burn-in phase,<br />
aging behavior, etc., have to be analyzed <strong>and</strong> specified properly in order<br />
to ensure good reproducibility of the measurements. Furthermore,<br />
proper optical parameters for the measurement system also determine<br />
whether characterization of <strong>LED</strong>s can be made accurately <strong>and</strong><br />
reproducibly. Differing measurement geometries for the very same <strong>LED</strong><br />
can also lead to entirely different results. All of these factors have to be<br />
accounted before proper internationally comparable quality st<strong>and</strong>ards<br />
can be established.<br />
References:<br />
[1] Dr. Adrian Mahlkow; O.U.T e.V.; private communication; May 2008<br />
[2] Yuqin Zong et al; NIST; Simple spectral stray light correction method for array spectrometers, Applied Optics, Vol 45, No 6; Feb. 2008<br />
www.led-professional.com <strong>LED</strong> professional Review | Nov/Dec 2008 | page 23
Copyright © 2008 Luger Research & <strong>LED</strong>-professional. All rights reserved.<br />
The Role of Miniature<br />
Spectrometers in the <strong>LED</strong><br />
Revolution<br />
> Jorge Macho, Director of Technical Service, Ocean Optics<br />
Fiber optics miniature spectrometers use significant technological<br />
advancements derived from the semiconductors industry (detectors),<br />
fiber optics, computers <strong>and</strong> electronics. A decade <strong>and</strong> a half ago the<br />
“primal stew” combining these technologies resulted in a simple device<br />
that revolutionized the use of spectroscopic techniques beyond the<br />
realm of research laboratories, projecting spectroscopy into the field,<br />
industry <strong>and</strong> even outer space. These light measuring devices have<br />
progress from mere technological oddities to trustworthy analytical<br />
instruments with great value due to their small finger print, competitive<br />
features <strong>and</strong> low cost.<br />
Miniature spectrometers measure the interaction of light with matter<br />
<strong>and</strong> provide important information in fields that can go from Emission<br />
spectroscopy, to find poisonous lead in toys, to Fluorescence<br />
spectroscopy used to determine the amount of chlorophyll of crops to<br />
determine optimal harvest time. All over the world, these “photonic<br />
engines” are the foundation of h<strong>and</strong>held spectrometers, process control<br />
systems or st<strong>and</strong>-alone units for materials analysis, chemicals<br />
identification, optical sensors <strong>and</strong> other innovative devices. The fiber<br />
optic based spectrometers are capable of detecting spectral information<br />
ranging from 150 to 2500 nm or more by properly designing the optical<br />
bench <strong>and</strong> selecting the best available detectors. Latest designs can<br />
provide the users with resolutions as good as 0.02 nm.<br />
Today we are witnessing another photonics revolution; the advent of<br />
<strong>LED</strong>’s as reliable light sources for a large number of applications, going<br />
from accurate light sources for life saving medical devices to mega<br />
sized screens used in concerts or skyscrapers for entertaining <strong>and</strong><br />
advertising. The vintage days of <strong>LED</strong>s as useful light indicators for<br />
electrical device’s power status has dramatically changed thanks to the<br />
appropriate combination of available state of the art technology, energy<br />
conservation trends <strong>and</strong> low cost of mass production. This emerging<br />
multibillion-dollar market requires appropriate st<strong>and</strong>ardization of<br />
important parameters <strong>and</strong> characterization techniques in order to<br />
appropriately define the industry’s baseline. The <strong>LED</strong> users are requiring<br />
repetitive <strong>and</strong> accurate parameters for emission wavelengths (peak <strong>and</strong><br />
dominant), color measurement (as related to the human viewer) <strong>and</strong><br />
power <strong>and</strong> light flux (inherent <strong>and</strong> as compared with traditional lighting).<br />
Thereby the <strong>LED</strong> manufacturer, the systems integrator <strong>and</strong> the final user<br />
should use the same measuring devices, st<strong>and</strong>ard operating procedures<br />
<strong>and</strong> reference materials to avoid conflicts <strong>and</strong> streamline the technology<br />
behind the <strong>LED</strong> market.<br />
One of the most important features of an <strong>LED</strong> is its capacity to emit<br />
light at certain wavelength which in time will define its color as<br />
interpreted by the human eye. A commonly used scientific definition of<br />
color states that is a visible perception dependant spectral energy<br />
distribution, interaction of light with the illuminated sample <strong>and</strong> the<br />
spectral response related to the wavelength. How human brain can<br />
determine these three parameters accurately is obviously unknown <strong>and</strong><br />
only highly complicated mathematical models try to accurately define<br />
color.<br />
Color a human subjective discernment is now one of the more<br />
challenging <strong>LED</strong>’s characterization issues resulting in a <strong>LED</strong> dedicated<br />
“jargon” inherited from other fields <strong>and</strong> that deal with terms such as:<br />
color coordinates, color temperature, dominant/complementary<br />
wavelength <strong>and</strong> very important CRI (Color Rendering Index) <strong>and</strong> CCT<br />
(Correlated Color Temperature). <strong>LED</strong> characterization becomes more<br />
complicated by combining the aforementioned parameters with other<br />
lighting industry commonly used measurements such as c<strong>and</strong>elas or<br />
luminous intensity (power emitted directionally), foot-c<strong>and</strong>les or Lux<br />
(luminous emittance), watts/cm2 (irradiance), lumens (perceived power<br />
of light) or watts (power).<br />
Traditionally light emitting devices such as light bulbs, fluorescent lights<br />
<strong>and</strong> other use photometers to characterize their optical output.<br />
Photometers utilize broadb<strong>and</strong> detectors <strong>and</strong> optical filters as a way to<br />
simulate the spectral luminous efficiency of human eyes. On the other<br />
h<strong>and</strong>, spectroradiometers are devices that can be calibrated to<br />
characterize radiant energy as a function of wavelength. The actual<br />
photometric values are directly calculated from the measured spectrum<br />
with no simulations or mathematical models involved.<br />
In summary, a radiometric measurement results are reported in power<br />
units while photometric results are a function of spectral luminous<br />
efficiency. 1<br />
Miniature spectrometers have the unique characteristic of being able to<br />
work in both worlds. The can be used as photometer with the appropriate<br />
filters <strong>and</strong> algorithms through software <strong>and</strong> as spectroradiometers in<br />
conjunction with light collecting devices such as integrating spheres<br />
cosine correctors <strong>and</strong> others. In the later case, a radiometric calibration<br />
of the system is required to achieve the accurate <strong>and</strong> repetitive<br />
radiometrically measurements of <strong>LED</strong>s.<br />
Another consideration of prime importance for the characterization of<br />
<strong>LED</strong>s is their requirement for stable current <strong>and</strong> voltage. Since <strong>LED</strong>s are<br />
semiconductors that convert electricity into light trough the appropriate<br />
management <strong>and</strong> design of solid-state doping of the silicon material<br />
base to create p-n junctions. The “cold” light emitted by these devices<br />
uses electrical energy in a very efficient way since most of the luminous<br />
energy radiates in the visible spectral range. In order to maximize the<br />
www.led-professional.com <strong>LED</strong> professional Review | Nov/Dec 2008 | page 24
Copyright © 2008 Luger Research & <strong>LED</strong>-professional. All rights reserved.<br />
light emitting efficiency of the <strong>LED</strong>s the drive current should be carefully<br />
controlled. If the current is too high throughout the chip’s junction heat<br />
will be generated, not only affecting the <strong>LED</strong>’s efficiency to “convert”<br />
electrons into photons but also will damage the crystalline structure of<br />
the <strong>LED</strong> die. If this happens light will not be generated in the overheated<br />
<strong>and</strong> damaged sections creating the so-called “darkling defects”.<br />
Miniature spectrometers size <strong>and</strong> flexibility advantages come into play<br />
once again due to their capacity to be controlled by an external<br />
computer that can synchronize the spectral acquisition with electrical<br />
current management through customized software. This feature proves<br />
to be an excellent tool not only for laboratory applications, but also for<br />
<strong>LED</strong>s manufacturing purposes by providing spectral input <strong>and</strong> control<br />
capabilities to PLC systems. Some examples of these industrial<br />
applications are shown in two different industrial sourcing machines in<br />
Figure 2. These sorting machines can analyze more than 8,000 pieces<br />
per hour. The optical engine behind these devices measures <strong>and</strong><br />
processes individual <strong>LED</strong> spectral data within 10 to 50 milliseconds. The<br />
instrument’s computer quickly processes spectral information; analyzing<br />
data for dominant <strong>and</strong> peak value wavelength, CIE color <strong>and</strong> irradiance<br />
(lumens). Based on these results, the sorter then transports each<br />
individual bulb to the appropriate collection bin for storage. Even under<br />
rigorous 18-hour workdays, the miniature spectrometers spectrometer<br />
are capable of maintaining consistent speed <strong>and</strong> accuracy.<br />
are commonly employed by some manufacturers for process control.<br />
Unfortunately, there are typically two major disadvantages with these<br />
applications: cost <strong>and</strong> “rigidness of implementation.” Purchase <strong>and</strong><br />
maintenance of equipment is costly, so only the most critical processes<br />
employ such systems. The rigidness of implementation refers to the<br />
fact that once the equipment is installed, it often is difficult <strong>and</strong><br />
expensive to change, modify <strong>and</strong> maintain. Modularity permits dynamic<br />
configuration by the user - i.e., conversion of optical <strong>and</strong> mechanical<br />
<strong>and</strong> is ass simple as screwing <strong>and</strong> unscrewing spectrometers, light<br />
sources <strong>and</strong> sampling optics foe easy <strong>and</strong> cost effective modifications<br />
<strong>and</strong> maintenance of the equipment. Furthermore, the miniature<br />
spectrometers dependence on the use of optical fibers to collect the<br />
light from the sample is also one of their main advantages compared<br />
with other larger <strong>and</strong> complicated spectrometers. Optical fiber can<br />
transport light over great distances <strong>and</strong> around corners, virtually<br />
bringing the spectrometer to the sample. The notion of commercially<br />
viable fiber-based spectroscopy dates at least to the early ‘80s, with<br />
large fiber optic spectrophotometer developed by Guided Wave, Inc.,<br />
which was used in chemical, petrochemical <strong>and</strong> other process industries.<br />
Such flexibility of the light analyzing system obviously permits<br />
installation on production lines, in process streams, <strong>and</strong> in injectionmolding<br />
machines <strong>and</strong> other <strong>LED</strong> manufacturing processes besides<br />
final product sorting <strong>and</strong> characterization.<br />
An important advantage of miniaturized spectroscopic systems is that<br />
the same exact system can be use in a laboratory for research purposes<br />
<strong>and</strong> scale up to production floors almost instantaneously with no<br />
detrimental effects to the results <strong>and</strong> final application. In Figure 2 we<br />
show a typical system for <strong>LED</strong> optical characterization. The system<br />
includes a CCD miniature spectrometer, optical fiber, controlled <strong>LED</strong><br />
power supply <strong>and</strong> light collecting fixture, an integrating sphere in this<br />
example.<br />
Figure 1: CCD-array miniature spectrometer accurate color measurements in this <strong>LED</strong> sorting machines<br />
The rapid development of the aforementioned industrial applications of<br />
miniature spectrometers is just part of the dem<strong>and</strong>, from different<br />
industrial markets, for optical-sensing instrumentation that is more<br />
versatile <strong>and</strong> adaptable than ever, which has challenged technology<br />
suppliers to provide rugged, reliable <strong>and</strong> customized solutions with<br />
mass production economics.<br />
Industry is constantly looking for ways better manage their supply<br />
chains, reduce waste from off-specification product, increase yields n<br />
manufacturing, <strong>and</strong> build value in the br<strong>and</strong> or selling of their products.<br />
Small savings or subtle<br />
improvements often drive the difference between organic growth <strong>and</strong><br />
merely surviving. Certainly this idea is not new, techniques such as<br />
photometry, visual inspection, <strong>and</strong> even spectroscopy, such as FT-IR,<br />
Figure 2: Typical <strong>LED</strong> characterization set-up with controlled NIST traceable power supply (left), integrating<br />
sphere (center) <strong>and</strong> fiber coupled miniature spectrometer (right)<br />
www.led-professional.com <strong>LED</strong> professional Review | Nov/Dec 2008 | page 25
Copyright © 2008 Luger Research & <strong>LED</strong>-professional. All rights reserved.<br />
In the same fashion, the software utilized by the fiber-coupled<br />
spectrometer can be customized to be used in a PLC process control<br />
system or a sorting machine like the ones previously mentioned. In<br />
Figure 3 we show the radiometric results of a white <strong>LED</strong>. White <strong>LED</strong>s are<br />
one of the more challenging characterization situations since this<br />
lighting fixture will be the ones with the broadest market once their<br />
fabrication <strong>and</strong> light characteristic tuning provide a cost effective<br />
option for household illumination <strong>and</strong> take over the inc<strong>and</strong>escent <strong>and</strong><br />
fluorescent light bulbs.<br />
system specially designed for this purpose <strong>and</strong> commonly use to<br />
characterize coatings used in <strong>LED</strong> lenses <strong>and</strong> windows. Once again, the<br />
heart of this device is a miniature spectrometer, light source <strong>and</strong><br />
customized software as shown in Figure 5.<br />
Figure 4: Thin film characterization system, utilizes interferometry <strong>and</strong> special software to measure thin film<br />
thickness directly in large samples or in small samples by adapting the fibers probes to a microscope<br />
Figure 3: White <strong>LED</strong> characterization radiometric results, showing spectral features of wavelength (nm) vs. Radiant<br />
Flux (µW/nm) as well as the chromaticity diagram <strong>and</strong> several options for color values<br />
The role of miniature spectrometer in the <strong>LED</strong> market place does not<br />
end with the characterization of the final products but it also plays an<br />
important part on the development <strong>and</strong> characterization of <strong>LED</strong>’s raw<br />
materials, from the diodes materials to the phosphor coatings, lenses<br />
<strong>and</strong> other materials 2-5 .<br />
Modularity permits dynamic configuration by the user -- i.e., conversion<br />
of optical systems from transmission to reflection or fluorescence, for<br />
example, is as simple as screwing <strong>and</strong> unscrewing spectrometers, light<br />
sources <strong>and</strong> sampling optics from the fibers to which they’re attached.<br />
Optical fiber also permits applications not easily implemented with<br />
st<strong>and</strong>ard optical sensing techniques, such as the measurement of<br />
diffuse reflection from solid surfaces. This application requires the<br />
exclusion of specular reflection (light coming from an equal but opposite<br />
angle to the detector field of view) <strong>and</strong> is typically accomplished -- as<br />
in the case of an integrating sphere -- by removing a port, or by<br />
mounting the illuminator <strong>and</strong> spectrophotometer at different angles<br />
(45° <strong>and</strong> 90°). Using optical fiber, it is possible to overlap the illumination<br />
<strong>and</strong> detection fields in a small, easily deployed reflection probe. When<br />
the probe is positioned at 45° to the surface, only diffuse reflection is<br />
sensed. At 90°, diffuse plus specular reflection is sampled. In addition,<br />
the sampled area can be made larger or smaller by changing the sampleto-probe<br />
distance. Spot sizes as small as the characters on this page<br />
can be measured. The same optical fiber reflection probes can be used<br />
to measure thin films by interferometry as shown in Figure 4 which a<br />
Figure 5: Thin film thickness measurement of a silicon film on a glass substrate<br />
Again, the size <strong>and</strong> flexibility of the devices makes them suitable for<br />
scale up applications <strong>and</strong> with the appropriate accessories the systems<br />
are used in vacuum chambers for monitoring real-time thin-film<br />
deposition at the laboratory or on industrial environments.<br />
Figure 6: Portable spectrometer measuring single <strong>LED</strong>s(left) that will be used for entertainment light fixtures as<br />
the one shown at a concert hall on the right photograph<br />
<strong>LED</strong>s started as low intensity low quality lighting options derived as<br />
scientific curiosities of the semiconductor industry research <strong>and</strong><br />
development efforts. Miniature spectrometers had their roots in the<br />
same semiconductor field that paved the road for the development of<br />
www.led-professional.com <strong>LED</strong> professional Review | Nov/Dec 2008 | page 26
Copyright © 2008 Luger Research & <strong>LED</strong>-professional. All rights reserved.<br />
efficient detectors originally designed for the telecommunications<br />
industry. These two innovative photonic fields that developed from an<br />
industry that is now considered commoditized have the potential to<br />
develop new <strong>and</strong> interesting applications thanks to the relentless<br />
advances of related technologies.<br />
All the advances in spectroscopy of the last decade -- the breakthroughs<br />
in optics, detectors <strong>and</strong> fibers -- could be the tip of the iceberg. Today,<br />
there are spectral sensors that are very small, consume little power <strong>and</strong><br />
have built-in communications protocols <strong>and</strong> electronics that allow it to<br />
“talk” over the Internet. This spectrometer-as-Web appliance could have<br />
an enormous impact on research, industrial <strong>and</strong> field measurements,<br />
with implications for everything from how we combat the outbreak of<br />
disease all the way up to provide us with better entertaining options<br />
such as TV sets, O<strong>LED</strong> screens or architectural illumination The same<br />
device that is used to measure single <strong>LED</strong>s in a laboratory <strong>and</strong> then<br />
transferred to fine-tune the illumination provided by an <strong>LED</strong> spot fixture<br />
at a concert hall can be used to characterize the Red <strong>and</strong> NIR <strong>LED</strong>s used<br />
to monitor oxygen in blood at hospital patients. These smart <strong>and</strong><br />
innovative portable spectrometers will st<strong>and</strong>ardize the spectrometric<br />
measurements that control the production of <strong>LED</strong>s <strong>and</strong> O<strong>LED</strong>s at the<br />
manufacturer’s plant with the portable spectrometers that will be used<br />
to confirm the quality of such <strong>LED</strong>s at their final use <strong>and</strong> destination.<br />
The final user, from hospitals to automotive dealership repair shops<br />
would be able to negotiate their require <strong>LED</strong>’s parameters based on the<br />
same spectrometer, which will be calibrated <strong>and</strong> customized by the <strong>LED</strong><br />
manufacturer for their customer’s use. Using the “same ruler” for the<br />
same measurement at remote places. A good example of this concept is<br />
shown in Figure 6 where a JAZ® portable spectrometer is used to<br />
characterize the <strong>LED</strong>s that ended out being part of an <strong>LED</strong> light fixture<br />
used at a concert hall. On the same principle spectrophotometric<br />
devices such as the “Color Bug”®, featured in Figure 7, which can provide<br />
measurements for color (CIE 1931; x,y,z) <strong>and</strong> luminance values Lux/fc<br />
communicating the results wirelessly to an iPhone® or iPod® devices.<br />
Photonics markets such as the <strong>LED</strong> industry <strong>and</strong> the miniature<br />
spectroscopy markets value ease of use, convenience, timesavings,<br />
quality <strong>and</strong> continuous innovation. What will distinguish top industrial<br />
photonic systems providers is the ability to rapidly develop applicationspecific<br />
systems. Specifically, spectroscopy-based devices like the ones<br />
mentioned in this publication provide the framework for such systems.<br />
Portable, independent <strong>and</strong> “smart” instruments that have all the<br />
advantages of spectroscopy –including multi-channel capability – plus<br />
features like a microprocessor <strong>and</strong> onboard display that eliminate the<br />
need for a PC; stackable, autonomous instrument modules that make it<br />
simple to customize the system to changing application needs; <strong>and</strong><br />
Ethernet connectivity for remote operation. That’s a lot of functionality<br />
required around one core spectroscopy technology. Just as the<br />
functionality expected around <strong>LED</strong> based lighting <strong>and</strong> devices.<br />
Figure 7: H<strong>and</strong>held spectrophotometer with the latest advances in wireless communications <strong>and</strong> compatibility<br />
with other common h<strong>and</strong>held devices such as the iPhone<br />
References:<br />
1) Measurement of <strong>LED</strong>s, Commission Internationale de L’Eclairage, CIE 127:2007 2nd Edition.<br />
2) P Thiyagarajan, M Kottaisamy <strong>and</strong> M S Ramach<strong>and</strong>ra Rao, J. Phys. D: Appl. Phys. 39 2701-2706<br />
3) Xueying Wang, Hai Lin, Changmin Li<strong>and</strong> Setsuhisa Tanabe, Meas. Sci. Technol. 18 1348-1352<br />
4) P. Thiyagarajan, M. Kottaisamy, <strong>and</strong> M S Ramach<strong>and</strong>ra Rao, Material Research Bulletin, 42-4, 2007, Pages<br />
753-761<br />
5) J. Park, Growth <strong>and</strong> Characterization of GaN <strong>and</strong> AlGan Thin Films…, Dissertation for North Carolina State<br />
University, 2005.<br />
www.led-professional.com <strong>LED</strong> professional Review | Nov/Dec 2008 | page 27
Copyright © 2008 Luger Research & <strong>LED</strong>-professional. All rights reserved.<br />
Technology<br />
<strong>LED</strong> Encapsulant Epoxy<br />
Curing Optimization<br />
> Bit Tie Chan, Avago Technologies - Optoelectronic Product<br />
Division<br />
Cured epoxy polymer is a thermoset plastic that is created by combining<br />
a resin made of chains of epoxide rings with an appropriate hardener.<br />
Epoxy hardeners are not catalysts, <strong>and</strong> their specific reaction with the<br />
resins greatly contributes to the ultimate properties of the cured epoxy<br />
resin system. The curing profile of the mixed resin <strong>and</strong> hardener also<br />
affect the properties of the resulting cured material. The specific<br />
characteristics required of a cured epoxy depend on the application.<br />
This article presents an approach to optimizing the curing profile of the<br />
optical grade resin-hardener system used to encapsulate a surfacemount<br />
PLCC-2 (plastic leaded chip carrier - two lead) <strong>LED</strong> package.<br />
Following the initial experimental results, the samples were subjected<br />
to thermal cycling tests to validate the performance of the recommended<br />
optimum curing profile.<br />
Introduction<br />
Epoxy resins, widely used in insulators in electrical <strong>and</strong> electronic<br />
applications, offer great versatility in properties <strong>and</strong> cures. These resins<br />
can be cured at ambient or elevated temperatures, depending upon the<br />
choice of curing agents. In the two-part formulation, the resin <strong>and</strong><br />
hardener are mixed immediately before the encapsulating application.<br />
The cure kinetics <strong>and</strong> the glass transition temperature (Tg) of the cured<br />
system are dependent on the molecular structure of the hardener (the<br />
glass transition is the temperature where the polymer goes from a hard<br />
glasslike state to a flexible state). The physical characteristics of the<br />
epoxy resin system that influence the behavior of hardeners include<br />
atmospheric temperature, curing temperature <strong>and</strong> relative humidity.<br />
In many cases, more than one step is recommended for curing epoxy<br />
used for encapsulation. The first curing step determines the properties<br />
of the cured epoxy, <strong>and</strong> a relatively low temperature is usually<br />
recommended to reduce the internal stress. The second (or sometimes<br />
third) step in curing is used to enhance the adhesion bond between the<br />
epoxy <strong>and</strong> the substrate. The second step curing temperature is usually<br />
10 ºC to 20 ºC higher than that used for the first curing step.<br />
The curing profile recommended by the epoxy supplier might not be the<br />
optimum for a specific application. It is crucial to determine the optimum<br />
profile <strong>and</strong> mix ratio for the particular application to ensure the optimal<br />
performance of the cured epoxy. This article presents work that has<br />
been done to determine the optimum curing profile <strong>and</strong> mix ratio of a<br />
bispheol A resin <strong>and</strong> anhydride hardener system used in surface-mount<br />
technology (SMT) <strong>LED</strong> packages. A PLCC-2 (Plastic Leaded Chip Carrier<br />
– two lead) package was used as the vehicle in this study (Figure 1). This<br />
package has a substrate made up of a molded plastic reflector sitting<br />
on top of a bent lead frame. The die is attached within the reflector<br />
cavity <strong>and</strong> the cavity is encapsulated using the epoxy blend.<br />
Figure 1: Subject PLCC <strong>LED</strong> Package<br />
First, the isothermal cure kinetic of the specific epoxy resin was<br />
examined to study the catalyst kick off temperature <strong>and</strong> the maximum<br />
curing temperature. The pre-cure temperature can be predicted from<br />
the initial catalyst kick off temperature, <strong>and</strong> the maximum cure<br />
temperature helps to determine the post-cure temperature. Next, the<br />
epoxy resin was soaked at different combinations of temperature <strong>and</strong><br />
time to determine the optimum post‐cure duration. An internal stress<br />
analysis of the cured epoxy was then performed at different pre-cure<br />
durations to finalize the optimum curing profile. Finally, the samples<br />
were subjected to a thermal cycle test after moisture soak at 85 ºC/60%<br />
relative humidity (RH) to validate the performance of the recommended<br />
optimum curing profile.<br />
Experimental Approach<br />
Methodology<br />
Differential scanning calorimetry (DSC) experiments were performed<br />
on the liquid epoxy resin using a Perkin Elmer Pyris 6 DSC instrument to<br />
investigate the cure behavior of epoxy. In the two-part formulation, the<br />
components are mixed right before the encapsulating application<br />
occurs. The mix ratio recommended in the technical datasheet was used<br />
in this study. The DSC sample size was in the range of 10-14 mg. The<br />
DSC scan was performed between +30 ºC <strong>and</strong> +250 ºC at a constant<br />
heating rate of 10 ºC/minute to investigate cure behavior of the resin.<br />
The glass transition temperature (Tg) is also determined using the Pyris<br />
6 DSC, with the same scanning rate.<br />
To obtain the thermal transition characteristic of the epoxy resin after<br />
curing, a dynamic mechanical analysis (DMA) was performed using a<br />
Perkin Elmer Pyris 7 DMA instrument in single cantilever beam mode.<br />
The DMA scan was performed between +30 ºC <strong>and</strong> +250 ºC at a<br />
constant heating rate of 5 ºC/min. To obtain data on the dimensional<br />
change of the epoxy, a thermomechanical analysis (TMA) was performed<br />
using the penetration mode, <strong>and</strong> scanned from +30 ºC to 250 ºC at a<br />
constant heating rate of 5 ºC /min.<br />
www.led-professional.com <strong>LED</strong> professional Review | Nov/Dec 2008 | page 28
Copyright © 2008 Luger Research & <strong>LED</strong>-professional. All rights reserved.<br />
Isothermal cure kinetic<br />
Displayed in Fig. 2 are the DSC isothermal cure curves for the epoxy<br />
resin at different isothermal temperatures. The epoxy resin was heated<br />
from +30 ºC to +250 ºC at a constant rate of 10 ºC/min. at +110 ºC,<br />
+120 ºC, +130 ºC, +140 ºC <strong>and</strong> +150 ºC. As shown in Fig. 2, exothermic<br />
reaction peaks at +110 ºC <strong>and</strong> +120 ºC were not detectable. This implied<br />
that the catalyst reaction was not started at these temperatures. The<br />
catalyst started to kick off at +130 ºC, as denoted by the small peak in<br />
Figure 2. The maximum curing reaction was observed at +150 ºC. This<br />
explanation was supported by the glass transition temperature (Tg)<br />
measurement in the second DSC scan. In Appendix 1, a significant<br />
uncured peak was observed at +110 ºC <strong>and</strong> +120 ºC. The extent of cure<br />
(cure percentage) is calculated by:<br />
∆H of uncured epoxy - ∆H of uncured peak of cured epoxy<br />
∆H of uncured epoxy<br />
X 100%<br />
Table 2 <strong>and</strong> Figure 3 summarize the Tg of this study. The values for Tg at<br />
+130 ºC, +140 ºC <strong>and</strong> +150 ºC are equally stable over time. This is in line<br />
with isothermal cure kinetic study results where the catalyst starts to<br />
kick off at +130 ºC. As suggested by the isothermal cure kinetic study,<br />
this epoxy resin reaches the maximum cure at +150 ºC. Hence, a postcure<br />
temperature of +150 ºC was identified as optimum. The glass<br />
transition temperature was stable from four to eight hours of curing at<br />
a temperature above +130 ºC. Hence, a five-hour curing time was<br />
recommended for the post-curing duration. Based on this study, +150<br />
ºC for five hours was then identified as optimum post cure condition,<br />
<strong>and</strong> was used in the subsequent study to determine the pre-cure<br />
condition.<br />
Cure Time (hr)<br />
Temp (ºC) 2 4 8<br />
110 97.6 ºC 109.1 ºC 112.7 ºC<br />
120 113.5 ºC 121.0 ºC 125.2 ºC<br />
130 125.4 ºC 126.6 ºC 127.8 ºC<br />
140 127.8 ºC 128.1 ºC 128.5 ºC<br />
150 129.8 ºC 129.9 ºC 131.1 ºC<br />
Table 2: Glass Transition Temperature (Tg) of epoxy resin soak time study<br />
Figure 2: DSC isothermal cure curves for epoxy resin<br />
Table 1 summarizes the percentage of cure <strong>and</strong> glass transition<br />
temperature (Tg) at different temperatures. The table shows that +110<br />
ºC +120 ºC can be ruled out as pre-cure temperatures due to the<br />
presence of high degree of uncured reaction.<br />
Note: Uncured ∆H = 410.88J/g from the liquid DSC thermogram<br />
Temp. ºC ∆H of uncured/ J/g % cure<br />
110 107.565 73.8%<br />
120 26.672 93.5%<br />
130 9.694 97.6%<br />
140 0 100.0%<br />
150 0 100.0%<br />
Table 1: Percentage of cure vs. temperature<br />
Soak time study<br />
Five samples that were cured at different temperatures (+110 ºC / +120<br />
ºC / +130 ºC / +140 ºC / +150 ºC) were then subjected to cure at soaking<br />
time of two, four, six <strong>and</strong> eight hours to figure the optimum cure<br />
condition. The pre-cure <strong>and</strong> post-cure condition was then be derived<br />
from this study.<br />
Figure 3: Glass Transition Temperature (Tg) of epoxy resin soak time study<br />
Determining pre-cure conditions<br />
Pre-cure temperature is an important indicator for the reactivity of the<br />
resin mixture. The higher the pre-cure temperature, the higher the Tg.<br />
Too low a pre-cure temperature leads to low resin reactivity, <strong>and</strong> the<br />
polymer cross-linked structure cannot be fully formed. This causes risks<br />
to reliability, such as the potential for broken bond wires. Too high a<br />
pre-cure temperature gives high reactivity to the resin mixture <strong>and</strong> the<br />
potential to build up high internal stress in the epoxy network. This<br />
affects reliability by yielding the possibility of cracks or delamination.<br />
Thermo-mechanical properties of this epoxy resin under three different<br />
pre-cure conditions as listed below were then studied to determine the<br />
optimum pre-cure profile for PLCC package.<br />
• pre-cure: +135 ºC for 0.5 hr <strong>and</strong> post-cure: +150 ºC for 5 hrs<br />
• +135 ºC for 1 hr <strong>and</strong> 150 ºC for 5 hrs<br />
• +135 ºC for 2 hr <strong>and</strong> 150 ºC for 5 hrs<br />
www.led-professional.com <strong>LED</strong> professional Review | Nov/Dec 2008 | page 29
Copyright © 2008 Luger Research & <strong>LED</strong>-professional. All rights reserved.<br />
Table 3 <strong>and</strong> Figure 4 summarize the thermo-mechanical properties of the<br />
epoxy resin at different pre-cure conditions. The results suggests that<br />
+135 ºC/ 1 hr <strong>and</strong> 150 ºC/ 5 hrs represents the optimum curing profile,<br />
with lower internal stress compared to +135 ºC/ 2 hrs <strong>and</strong> 150 ºC/ 5 hrs.<br />
Curing at 135 ºC/ 0.5 hr <strong>and</strong> +150 ºC/ 5 hrs was out of consideration as<br />
the percentage cure after the pre-cure stage was
Copyright © 2008 Luger Research & <strong>LED</strong>-professional. All rights reserved.<br />
Fig. 2: Isothermal Cure: 120 ºC<br />
Fig. 3: Isothermal Cure: 130 ºC<br />
Fig. 4: Isothermal Cure: 140 ºC<br />
Fig. 5: Isothermal Cure: 150 ºC<br />
www.led-professional.com <strong>LED</strong> professional Review | Nov/Dec 2008 | page 31
Copyright © 2008 Luger Research & <strong>LED</strong>-professional. All rights reserved.<br />
Optics<br />
<strong>LED</strong> Source Modeling<br />
Method Evaluations<br />
> Mark Jongewaard, Director of Engineering, LTI Optics; Kurt<br />
Wilcox, Engineering Manager, Ruud Lighting<br />
Producing accurate simulations of <strong>LED</strong> based optical systems requires<br />
accurate source models. This means the source models must not only<br />
produce the correct distribution of light in a far field measurement,<br />
they must also produce the correct near field behavior since secondary<br />
<strong>LED</strong> optics are often employed in very close proximity to the <strong>LED</strong>.<br />
Accurate simulations are vital to the design process especially with lens<br />
optics commonly used on <strong>LED</strong>s given the high cost <strong>and</strong> long lead times<br />
for lens tooling. The data presented in this paper is a direct result of the<br />
lessons learned by one manufacturer about the importance of simulation<br />
accuracy.<br />
Type 3 - Self-generated intensity distribution resulting from detailed<br />
source geometry <strong>and</strong> luminance data. An example of the source model<br />
geometry for the Seoul Semiconductor P4 <strong>LED</strong> in Photopia’s source<br />
library is shown in Figure 2. This type of model uses the luminance data<br />
for the <strong>LED</strong> chip itself to generate initial rays, which then interact with<br />
the surrounding primary optical components such as reflectors <strong>and</strong><br />
lenses. This type of model creates the most accurate representation of<br />
the source behavior, that is to say the most accurate 3D ray emanation<br />
points <strong>and</strong> directions, since it replicates the actual light paths from the<br />
chip out of the primary optics.<br />
Overview<br />
3 main source modeling methods1 can be used, having a very different<br />
approach:<br />
Type 1 - Luminance data that is based on calibrated digital images<br />
taken from viewpoints all around the source. There is no geometry<br />
included with this type of source model. The image data is used to<br />
create 3D rays representing the initial emanation of light from the<br />
source. Figure 1 shows one of many images taken of an <strong>LED</strong>. The image<br />
was viewed in Radiant Imaging’s ProSourceTM software.<br />
Figure 2: Type 3 Source Model Geometry<br />
As previous work1 documents, Type 1 & 2 source models have a limited<br />
range of applications in which they can be used before loss of accuracy<br />
is experienced. The purpose of this article is to present 3 case studies<br />
that compare the use of these 2 source model types to show their<br />
relative performance. This is very important in cases where a designer<br />
has both types of source models available for a given <strong>LED</strong> <strong>and</strong> needs to<br />
know which type will produce more accurate results for their project.<br />
Furthermore, it is important to underst<strong>and</strong> the expected level of<br />
accuracy when only a Type 1 source model is available.<br />
Type 1 models are commonly used for <strong>LED</strong>s since many <strong>LED</strong> manufactures<br />
distribute 3D ray sets built from the digital images <strong>and</strong> as a result, many<br />
optical software products do not see a need to create separate Type 3<br />
models. While several companies offer services to measure the digital<br />
images, the results in this paper are based on image data measured by<br />
Radiant Imaging. Type 3 models are commonly used only when they are<br />
provided in the source library distributed with the optical software.<br />
Figure 1: Calibrated Image of <strong>LED</strong><br />
Type 2 - Goniometric intensity distribution with source geometry <strong>and</strong><br />
surface luminance data. This type of model distributes ray emanation<br />
points across the luminous surfaces of the source geometry considering<br />
the relative luminance values of the various source surfaces. The ray<br />
directions are determined by the intensity distribution assigned to the<br />
source, which is generally a measured far field distribution.<br />
To illustrate the differences in the way rays are generated between a<br />
Type 3 <strong>and</strong> 1 model, Figures 3 <strong>and</strong> 4 show the CREE XR-E <strong>LED</strong> model<br />
which is included in the Photopia software library. The left side of each<br />
image shows the light field inside the <strong>LED</strong> while the right side shows the<br />
source geometry. In the Type 1 model, the geometry is only for reference<br />
as it is not part of the model. The location of the <strong>LED</strong> chip is near the top<br />
of these images, just above the bright region of light in the Type 3<br />
model image.<br />
www.led-professional.com <strong>LED</strong> professional Review | Nov/Dec 2008 | page 32
Copyright © 2008 Luger Research & <strong>LED</strong>-professional. All rights reserved.<br />
Case Studies<br />
These case studies use data collected by Beta<strong>LED</strong>TM during the<br />
development of their NanoOpticTM <strong>LED</strong> outdoor area lighting lens<br />
optics. The data includes measured luminous intensity distributions<br />
along with simulations using both Type 1 <strong>and</strong> Type 3 source models in<br />
Photopia. The optics were measured at Independent <strong>Testing</strong> Laboratories,<br />
Inc. (ITL) in Boulder, Colorado, USA. The simulations used lens geometry<br />
that was scanned from the physical as-built parts. This is important<br />
since the as-built parts did not always perfectly match the intended<br />
design, which removes a potential source of difference between<br />
measured <strong>and</strong> simulated performance.<br />
Figure 3: Type 3 Source Model<br />
Case 1 – Roadway Type 5 Distribution Lens (Wide round pattern optic<br />
with a gel filled gap between <strong>LED</strong> <strong>and</strong> lens)<br />
Figure 5 shows very significant beam deviations between the measured<br />
(blue) <strong>and</strong> simulated (red) data for the Type 1 model, especially in the<br />
higher angle range. This is a critical part of the beam on this type of<br />
optic since the goal is to direct as much light as possible just below the<br />
cutoff angle of 80 deg. If the simulations are under predicting these<br />
values, then the optimization of the optic will be misdirected. The Type<br />
3 model plots in Figure 6 show closer correlation to the measured data,<br />
especially in the higher angles. The lower angles do deviate from the<br />
measured data, but generally follow the same trends in the beam<br />
pattern.<br />
Case 2 – Roadway Type 5 Distribution Lens (Wide round pattern optic<br />
without gel)<br />
Figure 4: Type 1 Source Model<br />
Artifacts in the light field as a consequence of the specific methods<br />
used to create the 3D ray emanation points in the Type 1 model are<br />
clearly seen in Figure 4. The light field is generated in a region well in<br />
front of the actual chip location. To underst<strong>and</strong> why such artifacts are<br />
present, one must underst<strong>and</strong> how the 3D rays are generated from a<br />
set of digital images. The digital images are collected from many viewing<br />
angles around the source. These 2 dimensional images all center around<br />
some reference point on the source. For this <strong>LED</strong>, that reference point is<br />
in the center of the metal ring, near the base of the glass dome. From<br />
this set of 2D image data, 3D emanation points are determined. As seen<br />
in Figure 1, precise data is available in the plane of each image so the<br />
local X & Y values for a ray point can be determined, but no data is<br />
explicitly known about the 3rd dimension, essentially the Z value of the<br />
ray out of the plane of the image. The software that creates the 3D ray<br />
sets provides various geometric surface options to which the 3rd<br />
dimension can be mapped. Figure 4 uses the “undefined” option since it<br />
is often used in the ray sets distributed by the <strong>LED</strong> manufactures, which<br />
makes it a good reference for these case studies.<br />
The differences between the Type 1 <strong>and</strong> Type 3 model performance are<br />
not as great as in the first optic, but the Type 1 model in Figure 7 does<br />
show an upward shift in the beam angle <strong>and</strong> significantly more light<br />
directly below the luminaire. Accurately predicting the peak vertical<br />
angle in the intensity distribution is another critical issue in this type of<br />
lens. Figure 8 shows more accurate overall beam shapes as well as peak<br />
beam angles.<br />
Case 3 – Medium Beam Lens (With a gel filled gap between the <strong>LED</strong> <strong>and</strong><br />
lens)<br />
This case illustrates how the differences between the 2 model types<br />
remains significant when a gel is used between the <strong>LED</strong> <strong>and</strong> lens even<br />
in a much narrower beam distribution. The higher intensities seen in the<br />
central part of the beam using the Type 1 model in Figure 9 result from<br />
the extra lumens that were not directed to the higher angles in the<br />
distribution where they belonged. The Type 3 model results shown in<br />
Figure 10 show a much closer beam shape at the full range of angles in<br />
this distribution.<br />
www.led-professional.com <strong>LED</strong> professional Review | Nov/Dec 2008 | page 34
Copyright © 2008 Luger Research & <strong>LED</strong>-professional. All rights reserved.<br />
Figure 5: Type 1 Model <strong>Simulation</strong>s: polar c<strong>and</strong>ela plots along chip (left) <strong>and</strong> diagonal to chip (right)<br />
Figure 6: Type 3 Model <strong>Simulation</strong>s: along chip (left) <strong>and</strong> diagonal to chip (right)<br />
Figure 7: Type 1 Model <strong>Simulation</strong>s: polar c<strong>and</strong>ela plots along chip (left) <strong>and</strong> diagonal to chip (right)<br />
www.led-professional.com <strong>LED</strong> professional Review | Nov/Dec 2008 | page 35<br />
Figure 8: Type 3 Model <strong>Simulation</strong>s: along chip (left) <strong>and</strong> diagonal to chip (right)
Copyright © 2008 Luger Research & <strong>LED</strong>-professional. All rights reserved.<br />
Summary<br />
The 3 cases presented illustrate that there are significant differences in<br />
simulated results depending on the source modeling method used.<br />
These results show that a Type 3 model more closely matches the<br />
measured performance than the Type 1 model for both wide <strong>and</strong><br />
medium beam lenses. The differences are greatest when an index<br />
matching gel is used between the <strong>LED</strong> <strong>and</strong> lens. The main reasons for<br />
this are that in addition to the challenge Type 1 models have in creating<br />
accurate 3D ray emanation points, all of their digital images showing<br />
the luminous view of the source are measured in air. When a gel is used<br />
between the <strong>LED</strong> <strong>and</strong> the lens, light never exits from the <strong>LED</strong> primary<br />
lens into air so the measurements are inappropriate. Since Type 3 models<br />
include the lens geometry, the material can simply be changed to<br />
account for the glass / gel interface instead of glass / air.<br />
Figure 9: Type 1 Model <strong>Simulation</strong>s: polar c<strong>and</strong>ela plots along chip (left) <strong>and</strong> diagonal to chip (right)<br />
The 2nd set of data shows that the Type 1 model fairs better when there<br />
is no gel, yet it does not outperform the Type 3 model. Wider beam<br />
optics are more sensitive than narrower beam optics to exactly how<br />
much light is directed onto each part of the lens. As the beam gets<br />
narrower, more light is directed to the same angles in the beam <strong>and</strong><br />
differences in the amount of light sent to each part of the lens between<br />
the simulation <strong>and</strong> physical reality become less important. It should<br />
also be noted that other 3D ray emanation point geometry mapping<br />
options were tested such as mapping the points to a sphere <strong>and</strong> the<br />
results did not vary significantly from those presented here.<br />
Given a choice between Type 1 <strong>and</strong> Type 3 source models for the same<br />
<strong>LED</strong>, a Type 3 model will likely produce more accurate results, especially<br />
as the beam gets wider. If gels are used between the <strong>LED</strong> <strong>and</strong> lens, then<br />
Type 1 models should not be used since the measurements on which<br />
they are based is not appropriate for this situation.<br />
Figure 10: Type 3 Model <strong>Simulation</strong>s: along chip (left) <strong>and</strong> diagonal to chip (right)<br />
www.led-professional.com <strong>LED</strong> professional Review | Nov/Dec 2008 | page 36
Copyright © 2008 Luger Research & <strong>LED</strong>-professional. All rights reserved.<br />
<strong>Simulation</strong> <strong>and</strong> Optimization<br />
of Optical <strong>System</strong>s<br />
> Dr. Norbert Harendt, Project Manager Illumination Design, IB/E<br />
OPTICS, Christoph Gerhard, Product Manager/Optics, LINOS<br />
Photonics<br />
Due to the rapid further development, Light Emitting Diodes (<strong>LED</strong>) have<br />
become a well-established alternative to classic inc<strong>and</strong>escent lamps.<br />
<strong>LED</strong> feature numerous advantages such as high luminous efficiency (up<br />
to 110 lm/W) <strong>and</strong> a high switching speed. Thus, <strong>LED</strong> can be used for a<br />
variety of applications, already replacing filament bulbs in headlights,<br />
operating mode displays <strong>and</strong> traffic lights. In addition, <strong>LED</strong> are used for<br />
lots of analytical <strong>and</strong> medical methods, varying from distance<br />
measurement to spectroscopy <strong>and</strong> polymerization of materials by UV<br />
irradiation. However, by reason of <strong>LED</strong>’s directional characteristics,<br />
simulating <strong>and</strong> optimizing optical systems <strong>and</strong> illumination systems<br />
that contain <strong>LED</strong> light sources requires sophisticated design software.<br />
In this paper, we present the simulation <strong>and</strong> optimization of such an<br />
optical system. In this connection, the TracePro suite of optical <strong>and</strong><br />
illumination design software was used in combination with the<br />
optimization tool OptiBelPro.<br />
<strong>Simulation</strong> <strong>and</strong> Optimization Software<br />
The design software TracePro is a versatile software tool for modeling<br />
the propagation of light in imaging <strong>and</strong> non-imaging opto-mechanical<br />
systems. The 3D models can be directly created or imported from a lens<br />
design or a CAD program. This makes it possible to design systems<br />
where optical elements can be extended to the very boundaries of the<br />
mechanical surroundings, as shown in figure 1.<br />
applied to the solid model. In addition, the so-called Surface Source<br />
Property Utility [1] allows converting manufacturer’s data sheets to<br />
light source properties by importing given values for spectral distribution<br />
<strong>and</strong> polar radiation pattern distribution, as shown in figure 2.<br />
Figure 2: Surface Source Property Utility for importing spectral distribution <strong>and</strong> polar radiation pattern<br />
distribution<br />
Hence, TracePro allows modeling <strong>and</strong> simulating optical systems<br />
containing <strong>LED</strong> <strong>and</strong> analyzing light distributions, stray light, scattered<br />
light <strong>and</strong> aperture diffraction, throughput, loss, system transmittance,<br />
flux or power absorbed by surfaces <strong>and</strong> bulk media, light scattering in<br />
biological tissue, fluorescence <strong>and</strong> birefringence effects of such<br />
systems.<br />
To be suitable for illumination design on the other h<strong>and</strong> the design<br />
software has to provide automated system optimization, since<br />
illumination systems are usually designed to meet certain requirements.<br />
Maximized efficiency is one prominent example, maximized uniformity<br />
of irradiance distribution another one. Therefore OptiBelPro – the nonlinear<br />
optimization module for TracePro – gives access to gradual<br />
modifications of the weightings between intensity <strong>and</strong> uniformity<br />
targeted optimization. Since OptiBelPro is tied to TracePro using its<br />
programming interface Scheme, the designer can implement every<br />
thinkable way of changing the model or calculation of merit value,<br />
which makes this tool extremely powerful.<br />
Figure 1: Representation of a <strong>LED</strong> Package with a TIR Lens in TracePro<br />
These models can then be provided with different properties such as<br />
absorption, reflection <strong>and</strong> transmission, fluorescence <strong>and</strong> scatter.<br />
Furthermore, grid, surface <strong>and</strong> file sources can be modeled in this vein.<br />
For this purpose, measured data of particular <strong>LED</strong> can be imported <strong>and</strong><br />
Defining a Variety of Optimization Aims<br />
The design of an illumination system with the highest possible efficiency<br />
in terms of maximized irradiance on the target surface is often one of<br />
the easy tasks. This allows reducing the number of rays to be used in<br />
simulation, which results in rather short optimization cycles. Switching<br />
to maximization of uniformity on the other h<strong>and</strong> results in optimizations<br />
with increased time consumption, since this involves calculation of a<br />
higher number of rays. The irradiance map of an illumination system<br />
designed for maximized efficiency (as illustrated in figure 3) often lacks<br />
any uniformity, whereas maximized uniformity is often bound to poor<br />
efficiency.<br />
Going from a single setting on intensity or uniformity weighting to a<br />
mixture of both, an increase in uniformity can be achieved with a<br />
gradually controllable loss in intensity, as shown in figure 4.<br />
www.led-professional.com <strong>LED</strong> professional Review | Nov/Dec 2008 | page 38
Copyright © 2008 Luger Research & <strong>LED</strong>-professional. All rights reserved.<br />
Figure 5: Example of multi target configuration setting up a horizontally line of irradiance<br />
Figure 3: Example of a system optimized for maximum efficieny<br />
Practical Example: Zoom Lens Design<br />
The design of a zoom lens for illumination purposes is an example of a<br />
task going far beyond simple analysis of intensity <strong>and</strong>/or uniformity on<br />
just one target surface. Because of the high luminous efficiency of <strong>LED</strong><br />
they are prone for assembly of small lightweight illumination devices.<br />
Variable characteristic of light output is one of the prominent<br />
requirements targeted to such a device. Using TracePro <strong>and</strong> OptiBelPro<br />
this goal can be achieved with respect to the dem<strong>and</strong>s a customer will<br />
make on it.<br />
Zoom lens design requires the possibility of simultaneously optimizing<br />
different configurations. With OptiBelPro it is possible to define multiple<br />
configurations in one model. A zoom lens, as shown in figure 6, needs<br />
at least two different configurations: one representing the spot<br />
irradiation, which contributes to the merit value calculation by the total<br />
intensity achieved in a comparably small target area only. The wide<br />
angle configuration is characterized by a mixture of mainly uniformity<br />
weighting <strong>and</strong> a small intensity weighting for a large target area.<br />
Figure 4: Result for Optimization on uniformity with slight respect to intensity added<br />
The list of additional features contains freely definable model parameters<br />
together with optimization toggle <strong>and</strong> boundary settings, multiple<br />
target optimization, controlled interrupt <strong>and</strong> resume capabilities <strong>and</strong><br />
comfortable logging abilities. Since the extension of the theoretically<br />
infinite list of model parameters may result in very long optimization<br />
cycles, one can have a set of intermediate models <strong>and</strong> irradiance maps<br />
saved to be reviewed without interruption of the optimization process.<br />
Especially OptiBelPro’s ability of multiple target optimization is an<br />
interesting feature for illumination designers, since this provides an<br />
easy approach to customized irradiation distributions. Figure 5 shows<br />
an example. Five target surfaces are configured in such a way, that an<br />
optimization will produce a horizontal line of maximized intensity with<br />
vanishing intensity at the vertical axis. The modeling of more complex<br />
irradiation distributions is also possible<br />
Figure 6: Example of two-elment <strong>LED</strong> zoom configuration<br />
www.led-professional.com <strong>LED</strong> professional Review | Nov/Dec 2008 | page 39
Copyright © 2008 Luger Research & <strong>LED</strong>-professional. All rights reserved.<br />
Since production costs are often the main concern for such a system, a<br />
reasonable setup consists of one TIR lens in front of the <strong>LED</strong> <strong>and</strong> one<br />
focusing lens, which position can be varied in order to achieve the<br />
switch between spot <strong>and</strong> wide angle irradiation characteristic. Both<br />
lenses have to be made out of plastic, since this will provide the desired<br />
combination of low production costs <strong>and</strong> total aspherical surface design<br />
for all lenses involved.<br />
Since non-linear optimization is an art, which can produce absurd results,<br />
one needs to have a good starting point, which means to start with a very<br />
limited set of model parameters, a weighting fixed to intensity<br />
maximization only <strong>and</strong> a profound idea of the most effective boundary<br />
conditions. Starting with just two plane sheets of plastic <strong>and</strong> a vast<br />
amount of model parameters had never lead to a good system design.<br />
The uniformity of the wide angle configuration looks not optimal, since<br />
uniformity is often a trade-off between efficiency <strong>and</strong> uniformity.<br />
Using OptiBelPro’s fine grained control to shift the weighting gaining<br />
more influence on uniformity a final configuration could be achieved.<br />
While leaving spot irradiance untouched uniformity for the wide angle<br />
configuration is increased with an efficiency reduction of 4% only. The<br />
most severe disturbances of uniformity, the center spot <strong>and</strong> ring, have<br />
vanished, as figure 9 shows. Since the customer requested a smooth<br />
drop of irradiance at the edge of the irradiance map, the achieved<br />
configuration was acceptable. If a customized design task could cover<br />
an increase in system costs generated by a rising number of lenses <strong>and</strong><br />
complexity of mechanics, the uniformity can surely be optimized even<br />
more by introducing additional lenses in the system.<br />
A reasonable starting point for the zoom lens delivered an optimized<br />
configuration with a zoom range between 9° <strong>and</strong> 35° illumination angle,<br />
an efficiency of 72% for the spot configuration <strong>and</strong> 82% for the wide<br />
angle configuration, as shown in the figures 7 <strong>and</strong> 8.<br />
Figure 9: Optimized irradiation map of wide angle configuration shows an efficiency of 78% <strong>and</strong> a viewing<br />
angle of 35°<br />
Figure 7: The irradiation map of spot configuration shows an efficiency of 72% <strong>and</strong> a viewing angle of 9°<br />
Conclusion<br />
The combination of TracePro <strong>and</strong> OptiBelPro provides a mighty <strong>and</strong><br />
flexible tool for every designer of opto mechanical illumination systems.<br />
The feature of automated system optimization saves time <strong>and</strong> effort in<br />
development <strong>and</strong> gains quality <strong>and</strong> compliance with the specifications.<br />
The possibility to fine grain the balance of intensity <strong>and</strong> uniformity<br />
weightings enables the designer to remain within the restrictions of the<br />
design specifications while extending the quality of the irradiance<br />
achieved. Limitations of the st<strong>and</strong>ard configuration can be pushed away<br />
since OptiBelPro allows for vast feature extension because of the mighty<br />
macro interface of TracePro. Finally, the ability to model actual <strong>LED</strong><br />
packages either by real ray sets or by radiation distribution patterns<br />
provides even more advantages to an optical designer of <strong>LED</strong> based<br />
illumination systems.<br />
Figure 8: The first irradiation map of wide angle configuration shows an efficiency of 82% <strong>and</strong> a viewing<br />
angle of 35°<br />
References:<br />
[1] “Model <strong>and</strong> Predict the Performance of <strong>LED</strong>s for Solid State Lighting - Accurately <strong>and</strong> Quickly“, Technical<br />
Note, Lambda Research Corporation 2007<br />
www.led-professional.com <strong>LED</strong> professional Review | Nov/Dec 2008 | page 40
Copyright © 2008 Luger Research & <strong>LED</strong>-professional. All rights reserved.<br />
Thermal Management<br />
Simulating Device Thermal<br />
Performance Using PLECS<br />
> Dr. John Schönberger, Plexim GmbH<br />
In many industries, power electronic engineers face increased pressure<br />
to design converters that push the envelope in realms of efficiency, size<br />
<strong>and</strong> performance. For such highly-constrained applications, multidomain<br />
simulation tools are useful for taking into account factors such as<br />
thermal <strong>and</strong> EMI performance, which may impinge on the final design.<br />
One such simulation tool, PLECS, has inbuilt thermal domain modeling<br />
capabilities which permit the thermal behavior of a circuit to be<br />
simulated alongside the electrical circuit. In this article, the thermal<br />
modeling capabilities <strong>and</strong> simulation approach offered by PLECS will be<br />
explained. A case study, in which the temperature rise of a MOSFET in a<br />
flyback converter-based <strong>LED</strong> power supply is simulated, will be presented<br />
to demonstrate the application of the thermal modeling technique.<br />
Thermal simulation using PLECS<br />
PLECS is a circuit simulation toolbox for Simulink that is well suited for<br />
simulations of switching electrical systems that comprise both an<br />
electrical circuit <strong>and</strong> control system. The hallmark feature of PLECS is its<br />
use of ideal switches <strong>and</strong> its piecewise linear approach to solving<br />
switched electrical systems. Rather than simulating switching transitions<br />
using a small simulation time step <strong>and</strong> non-linear component models,<br />
PLECS uses ideal switching events. After each switching occurence,<br />
PLECS immediately jumps to the new operating point by forming a new<br />
set of circuit equations. This approach permits the use of a larger time<br />
step <strong>and</strong> the simplification of component models. The end result is that<br />
electrical simulations are fast <strong>and</strong> robust. Although PLECS was originally<br />
designed as an electrical circuit simulator, its simulation capabilities<br />
have been extended to the thermal domain. One-dimensional modeling<br />
of thermal structures <strong>and</strong> simulation of thermal power flows is possible<br />
through the use of PLECS’ thermal library.<br />
A thermal simulation is created in PLECS by adding loss information<br />
to electrical component models <strong>and</strong> by defining the thermal network<br />
between the loss-producing components <strong>and</strong> the environment. The<br />
key component in the thermal network is the heatsink. Unique to<br />
PLECS, this component is a uniform temperature surface that is the<br />
link between the electrical <strong>and</strong> thermal domains. Losses from all<br />
components mounted on the heatsink are automatically injected into<br />
the thermal network.<br />
Switching <strong>and</strong> conduction losses are defined for components by<br />
extending the st<strong>and</strong>ard electrical component models. Switching losses<br />
are defined by creating a 3-D lookup table in which the losses are<br />
defined as a function of junction temperature, blocking voltage <strong>and</strong><br />
conducting current. The lookup tables are created by the user using an<br />
inbuilt visual editor. During a simulation, switching energy loss values<br />
are obtained from the lookup table after each switching instant. This<br />
lookup table-based approach adopted by PLECS is much faster when<br />
compared with the alternative method of calculating the losses from<br />
the current <strong>and</strong> voltage waveforms across the device. The alternative<br />
approach requires detailed physical device models in conjunction with<br />
a small simulation time step, resulting in slow simulations.<br />
Conduction losses are defined in a similar manner to switching losses.<br />
A 2-D lookup table is defined in which the forward voltage drop is<br />
characterized as a function of junction temperature <strong>and</strong> conducting<br />
current. During each simulation time step, the conduction loss is<br />
calculated by multiplying the device’s forward voltage drop with the<br />
conducting current.<br />
Switching frequency<br />
42 kHz<br />
Duty cycle 11 %<br />
Transformer leakage inductance<br />
2.06 mH<br />
Input voltage<br />
325 V<br />
Load current<br />
700 mA<br />
Rth case-heatsink<br />
23K/W<br />
Table 1: Converter Parameters<br />
Figure 1: Flyback converter <strong>LED</strong> supply - Fairchild FEB228 evaluation board. Switching MOSFET is mounted underneath<br />
the PCB<br />
During an electrical-thermal simulation, interaction occurs between the<br />
electrical <strong>and</strong> thermal domains. Component losses are computed in the<br />
electrical domain <strong>and</strong> the results are fed to the thermal circuit. With<br />
each update of the thermal circuit, the junction temperatures are fed to<br />
the electrical circuit in order to account for the temperature dependency<br />
of the component losses.<br />
Case Study<br />
To demonstrate the thermal modeling capabilities of PLECS, the<br />
temperature rise of the FCD4N60 MOSFET in a single-switch flyback<br />
converter for an <strong>LED</strong> supply was simulated. The results are compared<br />
with experimental measurements. The flyback converter, shown in<br />
Figure 1, converts a rectified 230 Vrms mains input into a constant DC<br />
current output of 700 mA for supplying a load of three series-connected<br />
<strong>LED</strong>s. The converter parameters are shown in Table 1.<br />
<strong>Simulation</strong> Model<br />
The electrical simulation model is designed to replicate the conditions<br />
experienced by the MOSFET in the target circuit. The PLECS circuit<br />
schematic is shown in Figure 2 with the FCD4N60 MOSFET mounted on<br />
the heatsink in order to collect the conduction <strong>and</strong> switching losses.<br />
www.led-professional.com <strong>LED</strong> professional Review | Nov/Dec 2008 | page 42
Copyright © 2008 Luger Research & <strong>LED</strong>-professional. All rights reserved.<br />
Due to the static operating point of the converter, several simplifications<br />
were made to the electrical circuit. The input rectifier stage was replaced<br />
with a 325 V DC bus <strong>and</strong> the current control loop was omitted. The<br />
simulation model operates in open loop current control mode, regulating<br />
the peak voltage across the 1 ! current sense resistor to 0.4 V. It should<br />
be noted that the switching logic for the current controller is not shown<br />
in the circuit schematic because this is modeled in the Simulink<br />
worksheet that hosts the PLECS circuit.<br />
To complete the simulation model, thermal loss information was added<br />
to the MOSFET. Lookup tables were added to the MOSFET model to<br />
account for the turn-on <strong>and</strong> turn-off losses. The loss values used,<br />
shown in Table 2, were obtained from experimental measurements<br />
taken at 27°C <strong>and</strong> 100°C. To obtain the measurements, the MOSFET was<br />
mounted on a separate heatsink with thermal glue. The thermal<br />
resistance of the heatsink structure was approximately 23 K/W.<br />
Temperature Turn on loss (uJ) Turn off loss (uJ)<br />
27° C 2.475 1.444<br />
100°C 5.984 1.918<br />
of the experiment; however, the ambient temperature also rises by 3°C<br />
making the final temperature differential 5°C.<br />
For the simulation results, the final ambient temperature of 30°C is<br />
used as the starting case temperature. At the end of the simulation run,<br />
the MOSFET case temperature is 34.3°C, or .3°C above the ambient<br />
temperature.<br />
The simulation results show a good approximation of the experimental<br />
measurements. The temperature difference obtained with the simulation<br />
model is 4.3°C, or 14% lower than the experimental results. It should be<br />
noted that the temperature of the simulation model converged to its<br />
final value within 20 ms whereas the experimental system took<br />
approximately one minute to converge. The reason for this discrepancy<br />
is the thermal capacitance of the heatsink model was deliberately<br />
reduced in size to shorten the simulation time. If a more realistic value<br />
is needed to replicate the experimental system, it should be noted that<br />
PLECS includes a steady state analysis tool that iterates rapidly to the<br />
final steady state solution without wasting minutes or hours of<br />
simulation time.<br />
Table 2: Switching loss measurements for the FCD4N60 MOSFET<br />
Figure 2: Combined electrical thermal simulation of a flyback converter using PLECS. The heatsink, shown in<br />
purple, automatically aggregates the MOSFET conduction <strong>and</strong> switching losses <strong>and</strong> injects the losses into the<br />
thermal circuit<br />
Therefore the thermal impedance in the simulation model was set to<br />
this value. The thermal capacitance, not given in the heatsink datasheet,<br />
was assigned to a small value of 0.2 mJ/K in order to allow the heatsink<br />
<strong>and</strong> MOSFET temperatures to converge rapidly to their final values. In<br />
practice, the thermal capacitance would be larger but the actual value<br />
is unimportant since the purpose of the simulation is to obtain the final<br />
temperature differential.<br />
The conduction losses were modeled by configuring the drain-source<br />
resistance of the MOSFET to an average value of 1 ! as recommended by<br />
the datasheet. The load, consisting of three Luxeon LXK2 1A <strong>LED</strong>s, was<br />
modeled by adding a forward voltage drop <strong>and</strong> on resistance value to<br />
an ideal diode model. Each <strong>LED</strong> was assigned a forward voltage drop of<br />
3.1 V <strong>and</strong> an on resistance of 0.6 ! such that the forward voltage drop<br />
at 1 A matches the typical datasheet value of 3.7 V.<br />
Results<br />
The results, which show the temperature rise of the MOSFET case<br />
compared with the ambient temperature, are given in Figure 3. The<br />
experimental results show that the case temperature at the beginning<br />
of the experiment is 27°C. The case temperature rises to 35°C by the end<br />
(a) Experimental results<br />
(b) <strong>Simulation</strong> results<br />
Figure 3: Experimental <strong>and</strong> simulation results showing the temperature rise of MOSFET case compared with the<br />
ambient temperature<br />
Conclusion<br />
This article has explained the principles of simulating combined electrical<br />
<strong>and</strong> thermal circuits using PLECS <strong>and</strong> has demonstrated the validity of<br />
the PLECS approach to this problem. PLECS uses a lookup tables to<br />
account for switching losses, simplifying the switching transitions <strong>and</strong><br />
maintaining a fast simulation speed. The unique heatsink concept also<br />
permits simple coupling between the electrical <strong>and</strong> thermal domains.<br />
As an example, a thermal model of a single MOSFET switch in a flyback<br />
converter was presented <strong>and</strong> the simulated increase in case temperature<br />
showed close correlation with actual experimental measurements.<br />
More complicated thermal structures <strong>and</strong> circuits can be implemented<br />
using PLECS, including hierarchical component models <strong>and</strong> thermal<br />
circuits with multiple heat flow paths. One important point holds true<br />
regardless of the simulation complexity. The results are only as accurate<br />
as the data supplied <strong>and</strong> the validity of the electrical model.<br />
Acknowledgements:<br />
The author would like to thank Michael Weirich <strong>and</strong> Marcus Schmeidl from Fairchild Semiconductor Europe for<br />
supplying the MOSFET switching loss data <strong>and</strong> Siegfried Luger from Luger Research for his collaboration during<br />
the project.<br />
www.led-professional.com <strong>LED</strong> professional Review | Nov/Dec 2008 | page 43
<strong>LED</strong> professional Review (LpR) Editorial Calendar 2009<br />
Issue Main Feature Reservation by Files by Publication date