Effects of Er:YAG laser irradiation and manipulation ... - Univap
Effects of Er:YAG laser irradiation and manipulation ... - Univap
Effects of Er:YAG laser irradiation and manipulation ... - Univap

Create successful ePaper yourself
Turn your PDF publications into a flip-book with our unique Google optimized e-Paper software.
Silva Soares et al.: <strong>Effects</strong> <strong>of</strong> <strong>Er</strong>:<strong>YAG</strong> <strong>laser</strong> <strong>irradiation</strong> <strong>and</strong> <strong>manipulation</strong> treatment on dentin components, part 2…<br />
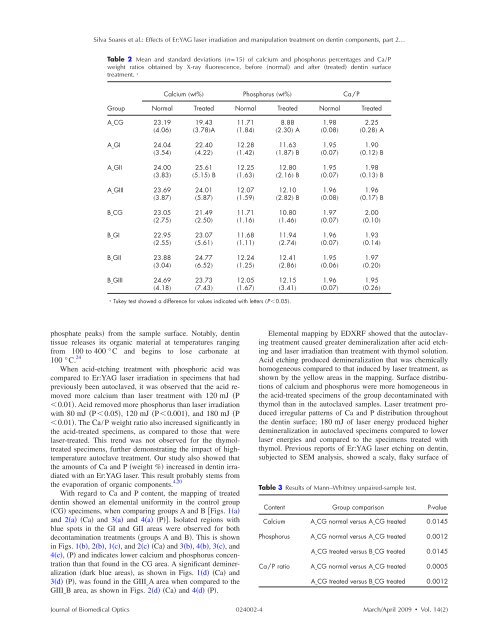
Table 2 Mean <strong>and</strong> st<strong>and</strong>ard deviations n=15 <strong>of</strong> calcium <strong>and</strong> phosphorus percentages <strong>and</strong> Ca/P<br />
weight ratios obtained by X-ray fluorescence, before normal <strong>and</strong> after treated dentin surface<br />
treatment. *<br />
Calcium wt% Phosphorus wt% Ca/P<br />
Group<br />
Normal Treated Normal Treated Normal Treated<br />
ACG 23.19<br />
4.06<br />
19.43<br />
3.78A<br />
11.71<br />
1.84<br />
8.88<br />
2.30 A<br />
1.98<br />
0.08<br />
2.25<br />
0.28 A<br />
AGI 24.04<br />
3.54<br />
22.40<br />
4.22<br />
12.28<br />
1.42<br />
11.63<br />
1.87 B<br />
1.95<br />
0.07<br />
1.90<br />
0.12 B<br />
AGII 24.00<br />
3.83<br />
25.61<br />
5.15 B<br />
12.25<br />
1.63<br />
12.80<br />
2.16 B<br />
1.95<br />
0.07<br />
1.98<br />
0.13 B<br />
AGIII 23.69<br />
3.87<br />
24.01<br />
5.87<br />
12.07<br />
1.59<br />
12.10<br />
2.82 B<br />
1.96<br />
0.08<br />
1.96<br />
0.17 B<br />
BCG 23.05<br />
2.75<br />
21.49<br />
2.50<br />
11.71<br />
1.16<br />
10.80<br />
1.46<br />
1.97<br />
0.07<br />
2.00<br />
0.10<br />
BGI 22.95<br />
2.55<br />
23.07<br />
5.61<br />
11.68<br />
1.11<br />
11.94<br />
2.74<br />
1.96<br />
0.07<br />
1.93<br />
0.14<br />
BGII 23.88<br />
3.04<br />
24.77<br />
6.52<br />
12.24<br />
1.25<br />
12.41<br />
2.86<br />
1.95<br />
0.06<br />
1.97<br />
0.20<br />
BGIII 24.69<br />
4.18<br />
23.73<br />
7.43<br />
12.05<br />
1.67<br />
12.15<br />
3.41<br />
1.96<br />
0.07<br />
1.95<br />
0.26<br />
* Tukey test showed a difference for values indicated with letters P0.05.<br />
phosphate peaks from the sample surface. Notably, dentin<br />
tissue releases its organic material at temperatures ranging<br />
from 100 to 400 °C <strong>and</strong> begins to lose carbonate at<br />
100 °C. 24<br />
When acid-etching treatment with phosphoric acid was<br />
compared to <strong>Er</strong>:<strong>YAG</strong> <strong>laser</strong> <strong>irradiation</strong> in specimens that had<br />
previously been autoclaved, it was observed that the acid removed<br />
more calcium than <strong>laser</strong> treatment with 120 mJ P<br />
0.01. Acid removed more phosphorus than <strong>laser</strong> <strong>irradiation</strong><br />
with 80 mJ P0.05, 120 mJ P0.001, <strong>and</strong> 180 mJ P<br />
0.01. The Ca/P weight ratio also increased significantly in<br />
the acid-treated specimens, as compared to those that were<br />
<strong>laser</strong>-treated. This trend was not observed for the thymoltreated<br />
specimens, further demonstrating the impact <strong>of</strong> hightemperature<br />
autoclave treatment. Our study also showed that<br />
the amounts <strong>of</strong> Ca <strong>and</strong> P weight % increased in dentin irradiated<br />
with an <strong>Er</strong>:<strong>YAG</strong> <strong>laser</strong>. This result probably stems from<br />
the evaporation <strong>of</strong> organic components. 4,20<br />
With regard to Ca <strong>and</strong> P content, the mapping <strong>of</strong> treated<br />
dentin showed an elemental uniformity in the control group<br />
CG specimens, when comparing groups A <strong>and</strong> B Figs. 1a<br />
<strong>and</strong> 2a Ca <strong>and</strong> 3a <strong>and</strong> 4a P. Isolated regions with<br />
blue spots in the GI <strong>and</strong> GII areas were observed for both<br />
decontamination treatments groups A <strong>and</strong> B. This is shown<br />
in Figs. 1b, 2b, 1c, <strong>and</strong> 2c Ca <strong>and</strong> 3b, 4b, 3c, <strong>and</strong><br />
4c, P <strong>and</strong> indicates lower calcium <strong>and</strong> phosphorus concentration<br />
than that found in the CG area. A significant demineralization<br />
dark blue areas, as shown in Figs. 1d Ca <strong>and</strong><br />
3d P, was found in the GIIIA area when compared to the<br />
GIIIB area, as shown in Figs. 2d Ca <strong>and</strong> 4d P.<br />
Elemental mapping by EDXRF showed that the autoclaving<br />
treatment caused greater demineralization after acid etching<br />
<strong>and</strong> <strong>laser</strong> <strong>irradiation</strong> than treatment with thymol solution.<br />
Acid etching produced demineralization that was chemically<br />
homogeneous compared to that induced by <strong>laser</strong> treatment, as<br />
shown by the yellow areas in the mapping. Surface distributions<br />
<strong>of</strong> calcium <strong>and</strong> phosphorus were more homogeneous in<br />
the acid-treated specimens <strong>of</strong> the group decontaminated with<br />
thymol than in the autoclaved samples. Laser treatment produced<br />
irregular patterns <strong>of</strong> Ca <strong>and</strong> P distribution throughout<br />
the dentin surface; 180 mJ <strong>of</strong> <strong>laser</strong> energy produced higher<br />
demineralization in autoclaved specimens compared to lower<br />
<strong>laser</strong> energies <strong>and</strong> compared to the specimens treated with<br />
thymol. Previous reports <strong>of</strong> <strong>Er</strong>:<strong>YAG</strong> <strong>laser</strong> etching on dentin,<br />
subjected to SEM analysis, showed a scaly, flaky surface <strong>of</strong><br />
Table 3 Results <strong>of</strong> Mann–Whitney unpaired-sample test.<br />
Content Group comparison P-value<br />
Calcium ACG normal versus ACG treated 0.0145<br />
Phosphorus ACG normal versus ACG treated 0.0012<br />
ACG treated versus BCG treated 0.0145<br />
Ca/P ratio ACG normal versus ACG treated 0.0005<br />
ACG treated versus BCG treated 0.0012<br />
Journal <strong>of</strong> Biomedical Optics 024002-4<br />
March/April 2009 Vol. 142