Standing Waves on a String
Standing Waves on a String
Standing Waves on a String

You also want an ePaper? Increase the reach of your titles
YUMPU automatically turns print PDFs into web optimized ePapers that Google loves.
<str<strong>on</strong>g>Waves</str<strong>on</strong>g><br />
Apparatus<br />
Tracker software (free; download from http://www.cabrillo.edu/∼dbrown/tracker/)<br />
Tracker Digital Library: http://physics.highpoint.edu/∼atitus/tracker/standing-waves/<br />
Goal<br />
Using video analysis, you will measure the frequency and wavelength of standing waves <strong>on</strong> a “string” (actually<br />
a l<strong>on</strong>g spring) and will calculate the speed of the wave. You will investigate which properties of the string<br />
affect the wave speed.<br />
Introducti<strong>on</strong><br />
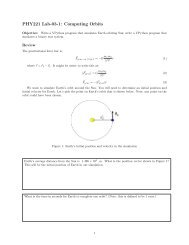
A standing wave exists when two waves of the same speed travel in opposite directi<strong>on</strong>s and interfere. If the<br />
wavelength of the wave is such that there is a node at the beginning and end of the string. The l<strong>on</strong>gest<br />
wavelength for this to occur is when λ = 2L which is shown in Figure 1.<br />
Figure 1: First harm<strong>on</strong>ic, n=1 (the fundamental).<br />
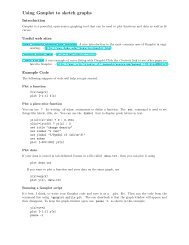
If the wavelength is shorter, the next possible standing wave is for λ = L which is shown in Figure 2.<br />
Figure 2: Sec<strong>on</strong>d harm<strong>on</strong>ic, n=2.<br />
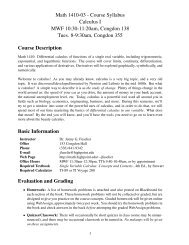
If the wavelength is shorter by half a wavelength, the next possible standing wave is for λ = 2 3L which is<br />
shown in Figure 3.<br />
Figure 3: Third harm<strong>on</strong>ic, n=3.<br />
1
Figure 4: Fourth harm<strong>on</strong>ic, n=4.<br />
Again, shorten the wavelength by half a wavelength, and you’ll get λ = 1 2L which is shown in Figure 4.<br />
We can write a general equati<strong>on</strong> relating wavelength of the standing wave to the length L of the string.<br />
λ = 2L n<br />
(1)<br />
where n = 1, 2, 3, 4, ... and each integer is referred to as the mode or harm<strong>on</strong>ic. The l<strong>on</strong>gest wavelength<br />
occurs for n = 1, the first harm<strong>on</strong>ic which is called the fundamental. Higher harm<strong>on</strong>ics are referred to as<br />
overt<strong>on</strong>es. The sec<strong>on</strong>d harm<strong>on</strong>ic is called the first overt<strong>on</strong>e. You will notice that for a string that is fixed at<br />
both ends, the number of antinodes is the same as the harm<strong>on</strong>ic n.<br />
Speed of a wave <strong>on</strong> a string<br />
For any wave, its speed is related to its wavelength and frequency.<br />
v = λf (2)<br />
The wave speed also depends <strong>on</strong> the medium it travels in. For a wave <strong>on</strong> a string, its speed depends <strong>on</strong><br />
the tensi<strong>on</strong> in the string and the linear density of the string µ. (Linear density is its mass per unit length,<br />
so µ = m/L). The speed of a wave <strong>on</strong> a string is<br />
√<br />
F T<br />
v =<br />
(3)<br />
µ<br />
<strong>String</strong>ed Instruments<br />
Equating the above two equati<strong>on</strong>s, then<br />
λf =<br />
√<br />
F T<br />
µ<br />
(4)<br />
For a standing wave <strong>on</strong> a string, substitute λ = 2L n<br />
and solve for the frequency of the standing wave in<br />
terms of tensi<strong>on</strong> and linear density of the string, as well as the harm<strong>on</strong>ic n.<br />
( 2L<br />
n<br />
)<br />
f =<br />
√<br />
F T<br />
µ<br />
f = n<br />
2L<br />
√<br />
F T<br />
µ<br />
(5)<br />
(6)<br />
Suppose that a standing wave <strong>on</strong> a string <strong>on</strong> an instrument (like piano or violin or guitar, etc.) vibrates<br />
with the fundamental frequency (n = 1). Then,<br />
√<br />
f 1 = 1 F T<br />
(7)<br />
2L µ<br />
2
To increase the frequency of the fundamental standing wave, you can:<br />
• decrease the length of the string (by pressing down <strong>on</strong> the string).<br />
• increase the tensi<strong>on</strong> (by tightening a screw, or “key”).<br />
• decrease the mass per unit length (by using a less dense string, typically a thinner string or <strong>on</strong>e made<br />
of a different material)<br />
What can you do to decrease the fundamental frequency <strong>on</strong> a string?<br />
The frequencies of a standing wave are proporti<strong>on</strong>al to n. Thus, the frequencies of overt<strong>on</strong>es (i.e. n > 1<br />
are integer multiples of the fundamental f 1 .<br />
f n = nf 1 (8)<br />
As a result, the sec<strong>on</strong>d harm<strong>on</strong>ic has a frequency 2f 1 , the 3rd harm<strong>on</strong>ic is 3f 1 , etc.<br />
Experiment–Video Analysis of a Point <strong>on</strong> a <str<strong>on</strong>g>Standing</str<strong>on</strong>g> Wave<br />
Procedure<br />
1. Open Tracker.<br />
2. Go to File→Open Library Browser .<br />
3. Enter the URL http://physics.highpoint.edu/~atitus/tracker/standing-waves/<br />
4. Double-click n=1 lower tensi<strong>on</strong> to open the video in Tracker.<br />
5. Play the video and observe the moti<strong>on</strong> of a piece of tape that is <strong>on</strong> the spring.<br />
Describe the moti<strong>on</strong> of the piece of tape in words. Based <strong>on</strong> what you learned in CH 21, what is<br />
this type of moti<strong>on</strong> called?<br />
If you measure and graph the vertical positi<strong>on</strong> of a piece of tape as a functi<strong>on</strong> of time, what should<br />
the graph look like if the tape’s moti<strong>on</strong> is simple harm<strong>on</strong>ic moti<strong>on</strong>? What does this remind you of?<br />
Now, we will measure and graph y(t).<br />
3
6. To calibrate the video, you will use the 2-m l<strong>on</strong>g meterstick <strong>on</strong> the tray of the whiteboard in the video.<br />
In the toolbar, click <strong>on</strong> the Calibrati<strong>on</strong> ic<strong>on</strong> shown in Figure 5.<br />
Figure 5: Ic<strong>on</strong> used to set the scale.<br />
Choose the Calibrati<strong>on</strong> Stick opti<strong>on</strong>. Click and drag the left end of the calibrati<strong>on</strong> stick so that it<br />
is <strong>on</strong> top of the left end of the 2-m l<strong>on</strong>g stick <strong>on</strong> the tray of the whiteboard. Repeat for the right end<br />
of the calibrati<strong>on</strong> stick. Click <strong>on</strong> the number of the calibrati<strong>on</strong> stick to set its length to 2 m, as shown<br />
in Figure 6.<br />
Figure 6: Set the scale of the calibrati<strong>on</strong> stick.<br />
7. Click the clip settings ic<strong>on</strong> in the toolbar and set the step size to 5 frames.<br />
8. To mark an object in the video, first click the Create butt<strong>on</strong>. From the menu, select Point Mass<br />
as shown in Figure 7. Now, you will mark the positi<strong>on</strong> of the object in each frame. While holding<br />
down the shift key, click <strong>on</strong> the piece of tape that is <strong>on</strong> the spring, close to the center of<br />
the spring. (There are actually three pieces of tape <strong>on</strong> the spring, but we’ll just mark <strong>on</strong>e of them<br />
for now.) The video will automatically advance to the next frame after you mark the object. C<strong>on</strong>tinue<br />
to mark the object for approximately 4 or 5 cycles of the spring. This might be about 90 data points.<br />
9. We want to analyze the y-positi<strong>on</strong> of the marker as a functi<strong>on</strong> of time. To change the variable being<br />
graphed, click <strong>on</strong> the vertical axis variable <strong>on</strong> the graph and select y: positi<strong>on</strong> y-comp<strong>on</strong>ent as<br />
shown in Figure 8.<br />
10. Right-click <strong>on</strong> the graph and select Analyze... . A new window with the graph will pop up. Click the<br />
Measure butt<strong>on</strong> and select Coordinates . Use this tool to measure time for any data point. Measure<br />
the total time between 4 peaks or 4 troughs and divide by the number of cycles to get the average<br />
period. Note that the time between four peaks corresp<strong>on</strong>ds to 3 cycles. Record your measurements in<br />
Table 1.<br />
11. Observe the other two pieces of tape. (You do not have to measure their moti<strong>on</strong>.)<br />
4
Figure 7: Create menu.<br />
Figure 8: Change the variable plotted <strong>on</strong> the graph.<br />
Do the three pieces of tape have the same periods?<br />
5
Do the three pieces of tape have the same amplitudes?<br />
12. Now you will measure the length of the spring. Go back to the main window. Click the Create<br />
butt<strong>on</strong> and select Measuring Tools→Tape Measure . Place the left end of the tape measure <strong>on</strong><br />
the left pers<strong>on</strong>’s hand. Place the right end of the tape measure <strong>on</strong> the right pers<strong>on</strong>’s hand, as shown<br />
in Figure 9. Record the length of the spring in Table 1.<br />
Figure 9: Measure the length of the spring.<br />
Answer the following questi<strong>on</strong>s using your data for the period of the standing wave and the distance<br />
between the ends.<br />
1. What is the frequency of the standing wave?<br />
2. What is the wavelength of the standing wave?<br />
3. What is the speed of the wave?<br />
Record the results in Table 1.<br />
13. Save the trk file to your computer in case you need it again. It will remain open as a tab in Tracker.<br />
When you open other files, they will be opened in new tabs. You can always close a tab if you d<strong>on</strong>’t<br />
need that Tracker file anymore.<br />
14. Go to File→Open Library Browser and open the sec<strong>on</strong>d video, n=2 lower tensi<strong>on</strong>. This standing<br />
6
wave is not ideal because the amplitude for any particular point is not c<strong>on</strong>sistent. But the average<br />
period can still be measured. Repeat the previous steps to determine the period, frequency, length,<br />
wavelength and speed of the wave. Note that it might be hard to see the piece of tape in all<br />
frames. As l<strong>on</strong>g as you click <strong>on</strong> the spring when marking the object, this is ok since we<br />
<strong>on</strong>ly care about the y-moti<strong>on</strong> and since all pieces of the spring have the same period.<br />
15. Use a data table like the <strong>on</strong>e below to record all of your data.<br />
Table 1: Data<br />
video cycles ∆t (s) T (s) f (Hz) L (m) λ (m) v (m/s)<br />
n=1, lower tensi<strong>on</strong><br />
n=2, lower tensi<strong>on</strong><br />
n=3, lower tensi<strong>on</strong><br />
n=1, higher tensi<strong>on</strong><br />
n=2, higher tensi<strong>on</strong><br />
Analysis<br />
1. For each standing wave, calculate the speed v of the wave.<br />
2. Is the speed of the wave approximately the same for any of the videos? If so, which <strong>on</strong>es? Calculate<br />
the average speed of the wave for those videos that have approximately the same speed.<br />
3. Does the speed of the wave depend <strong>on</strong> the wavelength or frequency? Explain your reas<strong>on</strong>ing.<br />
4. What does the speed of the wave depend <strong>on</strong>? Explain your reas<strong>on</strong>ing.<br />
5. Suppose that the two people shorten the spring but stretch it to the same distance L as before. Does<br />
this result in greater tensi<strong>on</strong> or less tensi<strong>on</strong>? Greater linear density or less linear density?<br />
6. You will notice that for the last two videos, the spring was stretched a greater amount. Stretching the<br />
spring increases the tensi<strong>on</strong> and decreases the linear density of the spring. Calculate the ratio of the<br />
average wavespeeds for the high tensi<strong>on</strong> and low tensi<strong>on</strong> cases.<br />
v high tensi<strong>on</strong><br />
v low tensi<strong>on</strong><br />
=<br />
By what factor did the ratio T/µ increase when the spring was stretched?<br />
(T/µ) high tensi<strong>on</strong><br />
(T/µ) low tensi<strong>on</strong><br />
=<br />
7. Suppose that the spring tensi<strong>on</strong> is kept c<strong>on</strong>stant. If you wiggle your hand faster, how does this effect<br />
the speed of a wave <strong>on</strong> the spring?<br />
7
8. Suppose that the spring tensi<strong>on</strong> is kept c<strong>on</strong>stant. If you wiggle your hand faster until you find the next<br />
higher mode of standing wave, how does this effect the frequency of a standing wave <strong>on</strong> the spring?<br />
What about the wavelength?<br />
9. What do you notice about the frequency for n = 2 compared to n = 1 (for a spring with the same<br />
tensi<strong>on</strong> and density)?<br />
10. What do you notice about the frequency for n = 3 compared to n = 1 (for a spring with the same<br />
tensi<strong>on</strong> and density)?<br />
11. Make a predicti<strong>on</strong>: what would be the frequency and wavelength of a standing wave with n = 4 if the<br />
tensi<strong>on</strong> and density remains the same?<br />
12. On a guitar string (or piano string or violin string), the spring approximately oscillates as a standing<br />
wave with n = 1 (i.e. the fundamental). So, this stays c<strong>on</strong>stant, regardless of other variables. If you<br />
increase the tensi<strong>on</strong> of the string:<br />
(a) Does the wavelength increase or decrease?<br />
(b) Does the frequency increase or decrease?<br />
(c) Does the speed of a wave <strong>on</strong> the string increase or decrease?<br />
13. Suppose that the “top” string <strong>on</strong> a guitar and the “bottom” string <strong>on</strong> a guitar have the same tensi<strong>on</strong>.<br />
(a) Which string has a greater linear density (mass/length)?<br />
(b) Which string has the greater fundamental frequency?<br />
14. Sketch the first five harm<strong>on</strong>ics for a standing wave <strong>on</strong> a string that is fixed at both ends. Label each<br />
graph with the harm<strong>on</strong>ic (n). If the length of the string is 0.5 m, what is the wavelength for each<br />
harm<strong>on</strong>ic.<br />
8