
You also want an ePaper? Increase the reach of your titles
YUMPU automatically turns print PDFs into web optimized ePapers that Google loves.
.<br />
<strong>INICC</strong><br />
<strong>Surveillance</strong> <strong>Data</strong>
Last Annual <strong>INICC</strong> Report:<br />
<strong>Data</strong> of 36 countries
American Journal of Infection Control xxx (2011) 1-11<br />
Contents lists available at ScienceDirect<br />
American Journal of Infection Control<br />
American Journal of<br />
Infection Control<br />
journal homepage: www.ajicjournal.org<br />
1<br />
2<br />
3<br />
4<br />
5<br />
6<br />
7<br />
8<br />
9<br />
10<br />
11<br />
12<br />
13<br />
14<br />
15<br />
16<br />
17<br />
18<br />
19<br />
20<br />
21<br />
22<br />
<strong>23</strong><br />
24<br />
Q1<br />
Special communication<br />
International Nosocomial Infection Control Consortium (<strong>INICC</strong>) report,<br />
data summary of 36 countries, for 2004-2009<br />
Victor D. Rosenthal MD, MSc, CIC a, *, Hu Bijie b , Dennis G. Maki c , Yatin Mehta d ,<br />
Anucha Apisarnthanarak e , Eduardo A. Medeiros f , Hakan Leblebicioglu g , Dale Fisher h ,<br />
Carlos Álvarez-Moreno i , Ilham Abu Khader j , Marisela Del Rocío González Martínez k ,<br />
Luis E. Cuellar l , Josephine Anne Navoa-Ng m , Rédouane Abouqal n , Humberto Guanche Garcell o ,<br />
Zan Mitrev p , María Catalina Pirez García q , Asma Hamdi r , Lourdes Dueñas s , Elsie Cancel t ,<br />
Vaidotas Gurskis u , Ossama Rasslan v , Altaf Ahmed w , Souha S. Kanj x , Olber Chavarría Ugalde y ,<br />
Trudell Mapp z , Lul Raka aa , Cheong Yuet Meng bb , Le Thi Anh Thu cc , Sameeh Ghazal dd ,<br />
Achilleas Gikas ee , Leonardo Pazmiño Narváez ff , Nepomuceno Mejía gg , Nassya Hadjieva hh ,<br />
May Osman Gamar Elanbya ii , María Eugenia Guzmán Siritt jj , Kushlani Jayatilleke kk<br />
a From the International Nosocomial Infection Control Consortium, Buenos Aires, Argentina<br />
b Zhongshan Hospital, Shanghai, China<br />
c University of Wisconsin Medical School, Madison, WI<br />
d Medanta the Medcity, New Delhi, India<br />
e Thammasat University Hospital, Pratumthani, Thailand<br />
f Hospital São Paulo, São Paulo, Brazil<br />
g Ondokuz Mayis University Medical School, Samsun, Turkey<br />
h Singapore University Hospital, Singapore, Republic of Singapore<br />
i Hospital Universitario San Ignacio, Universidad Pontificia Javeriana, Bogotá, Colombia<br />
j<br />
American Journal of Infection Control, 2011.<br />
56<br />
57<br />
58<br />
59<br />
60<br />
61<br />
62<br />
63<br />
64<br />
65<br />
66<br />
67<br />
68<br />
69<br />
70<br />
71<br />
72<br />
73<br />
74<br />
75<br />
76<br />
77<br />
78<br />
79
et al. / American Journal of Infection Control xxx (2011) 1-11 3<br />
untries is kept<br />
36 countries in<br />
articipating in<br />
ospitals’ mean<br />
months (range,<br />
AI rates, device<br />
specific type of<br />
nce for January<br />
in Tables 2-17.<br />
infection type<br />
s. The data for<br />
ified by type or<br />
mber of central<br />
e DU ratio is an<br />
samarkerfor<br />
A-HAI.<br />
Table 1<br />
Features of the participating <strong>INICC</strong> hospitals, 2004-2009<br />
America Asia Africa Europe Pooled<br />
ICUs, n 1<strong>23</strong> 241 6 52 422<br />
ICUs, type<br />
Medical ICU 3 34 0 5 42<br />
Medical cardiac 6 17 0 4 27<br />
Medical-surgical ICU 69 50 2 17 138<br />
Neurosurgical ICU 1 22 0 2 25<br />
Neurologic ICU 0 3 0 1 4<br />
Neonatal ICU 19 10 2 5 36<br />
Pediatric ICU 20 16 0 9 45<br />
Respiratory ICU 0 16 1 1 18<br />
Surgical ICU 3 40 1 6 50<br />
Surgical-cardiothoracic ICU 0 26 0 2 28<br />
Trauma ICU 2 7 0 0 9<br />
Hospitals, n<br />
Academic teaching 19 45 5 25 94<br />
Public 32 40 1 2 75<br />
Private community 28 16 0 2 46<br />
American Journal of Infection Control, 2011.<br />
(extended-spectrum b-lactamase producers), and Pseudomonas aeru-<br />
3<strong>06</strong><br />
307<br />
308<br />
309<br />
310<br />
311<br />
312<br />
313<br />
314<br />
315<br />
316<br />
317<br />
318<br />
319<br />
320<br />
321<br />
322<br />
3<strong>23</strong><br />
324<br />
325<br />
326
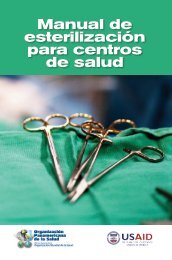
<strong>INICC</strong> report 2004- 2009.<br />
AJIC 2011<br />
! Period: January 2004 to December 2009 (6 years)<br />
! Countries: 36 (Argentina, Brazil, Bulgaria, China, Colombia, Costa Rica, Cuba,<br />
Dominican Republic, Ecuador, Egypt, Greece, India, Jordan, Kosovo, Lebanon,<br />
Lithuania, Macedonia, Malaysia, Mexico, Morocco, Pakistan, Panama, Peru,<br />
Philippines, Puerto Rico, El Salvador, Saudi Arabia, Singapore, Sri Lanka, Sudan,<br />
Thailand, Tunisia, Turkey, Venezuela, Vietnam, Uruguay)<br />
! ICUs: 422<br />
! Patients: 313,008<br />
! Bed days: 2,194,897<br />
! Central Line days: 1,078,448<br />
! Ventilator days: 796,847<br />
! Urinary catheter days: 1,049,541<br />
! BSI (n): 7,603<br />
! VAP (n): 12,395<br />
! CAUTI (n): 6,595<br />
! Total IAD: 26,593
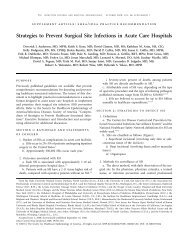
DAI RATES<br />
<strong>INICC</strong> vs CDC-NHSN (USA)<br />
V.D. Rosenthal et al. / American Journal of Infection Control xxx (2011) 1-11 7<br />
761<br />
762<br />
763<br />
764<br />
765<br />
766<br />
767<br />
768<br />
769<br />
770<br />
771<br />
772<br />
773<br />
774<br />
775<br />
776<br />
777<br />
778<br />
779<br />
780<br />
781<br />
782<br />
783<br />
784<br />
785<br />
786<br />
787<br />
Table 18<br />
Comparison of DA-HAI rates per 1000 device-days in the ICUs of the <strong>INICC</strong> and the US NHSN<br />
<strong>INICC</strong> 2004-2009,<br />
pooled mean (95% CI)<br />
DA-HAI and its adverse effects, in the ICUs participating in the<br />
US NHSN 20<strong>06</strong>-2008,<br />
pooled mean (95% CI)<br />
Medical cardiac ICU<br />
CLABSI 6.2 (5.6-6.9) 2.0 (1.8-2.1)<br />
CAUTI 3.7 (3.2-4.3) 4.8 (4.6-5.1)<br />
VAP 10.8 (9.5-12.3) 2.1 (1.9-2.3)<br />
Medical-surgical ICU<br />
CLABSI 6.8 (6.6-7.1) 1.5 (1.4-1.6)<br />
CAUTI 7.1 (6.9-7.4) 3.1 (3.0-3.3)<br />
VAP 18.4 (17.9-18.8) 1.9 (1.8-2.1)<br />
Pediatric ICU<br />
CLABSI 4.6 (3.7-5.6) 3.0 (2.7-3.1)<br />
CAUTI 4.7 (4.1-5.5) 4.2 (3.8-4.7)<br />
VAP 6.5 (5.9-7.1) 1.8 (1.6-2.1)<br />
Newborn ICU (1501-2500 g)<br />
CLABSI 11.9 (10.2-13.9) 1.5 (1.2-1.9)<br />
VAP 10.1 (7.9-12.8) 0.8 (0.04-1.5)<br />
CI, confidence interval.<br />
Table 19<br />
Comparison of antimicrobial resistance rates in the ICUs of the <strong>INICC</strong> and the US NHSN<br />
Pathogen, antimicrobial<br />
<strong>INICC</strong>, as well as in all other health care facilities in the developing<br />
world.<br />
American Journal of Infection Control, 2011.<br />
<strong>INICC</strong> 2004-2009 US NHSN 20<strong>06</strong>-2007<br />
Resistance, % (CLABSI)<br />
Resistance, % (CLABSI)<br />
Staphylococcus aureus<br />
Oxacillin 84.4 56.8<br />
Enterococcus faecalis<br />
826<br />
827<br />
828<br />
829<br />
830<br />
831<br />
832<br />
833<br />
834<br />
835<br />
836<br />
837<br />
838<br />
839<br />
840<br />
841<br />
842<br />
843<br />
844<br />
845<br />
846<br />
847<br />
848<br />
849<br />
850<br />
851<br />
852
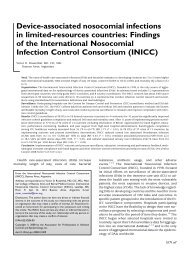
Comparing last four<br />
<strong>INICC</strong> Annual Reports
<strong>INICC</strong> report 2004- 2009
m<br />
HAI rates published by <strong>INICC</strong><br />
Publication year 20<strong>06</strong><br />
2008<br />
2010<br />
<strong>2012</strong><br />
Number of Countries 8<br />
18<br />
25<br />
36<br />
Peer Review Journal<br />
Annals of Internal<br />
Medicine<br />
American Journal<br />
of Infection Control<br />
American Journal of<br />
Infection Control<br />
American Journal of<br />
Infection Control<br />
CLABSI rate per 1000<br />
CL days<br />
12.5<br />
9.2<br />
7.6<br />
6.8<br />
VAP rate per 1000<br />
device days<br />
24.1<br />
19.5<br />
13.6<br />
15.8<br />
CAUTI per 1000 device<br />
days<br />
8.9<br />
6.5<br />
6.3<br />
6.3<br />
American Journal of Infection Control xxx (2011) 1-11<br />
Contents lists available at ScienceDirect<br />
American Journal of Infection Control<br />
American Journal of<br />
Infection Control<br />
journal homepage: www.ajicjournal.org<br />
1<br />
2<br />
3<br />
4<br />
5<br />
6<br />
7<br />
8<br />
9<br />
10<br />
11<br />
12<br />
13<br />
14<br />
15<br />
16<br />
17<br />
18<br />
19<br />
20<br />
21<br />
22<br />
<strong>23</strong><br />
24<br />
25<br />
26<br />
27<br />
Q1<br />
Special communication<br />
International Nosocomial Infection Control Consortium (<strong>INICC</strong>) report,<br />
data summary of 36 countries, for 2004-2009<br />
Victor D. Rosenthal MD, MSc, CIC a, *, Hu Bijie b , Dennis G. Maki c , Yatin Mehta d ,<br />
Anucha Apisarnthanarak e , Eduardo A. Medeiros f , Hakan Leblebicioglu g , Dale Fisher h ,<br />
Carlos Álvarez-Moreno i , Ilham Abu Khader j , Marisela Del Rocío González Martínez k ,<br />
Luis E. Cuellar l , Josephine Anne Navoa-Ng m , Rédouane Abouqal n , Humberto Guanche Garcell o ,<br />
Zan Mitrev p , María Catalina Pirez García q , Asma Hamdi r , Lourdes Dueñas s , Elsie Cancel t ,<br />
Vaidotas Gurskis u , Ossama Rasslan v , Altaf Ahmed w , Souha S. Kanj x , Olber Chavarría Ugalde y ,<br />
9<br />
Trudell Mapp z , Lul Raka aa , Cheong Yuet Meng bb , Le Thi Anh Thu cc , Sameeh Ghazal dd ,<br />
Achilleas Gikas ee , Leonardo Pazmiño Narváez ff , Nepomuceno Mejía gg , Nassya Hadjieva hh ,<br />
May Osman Gamar Elanbya ii , María Eugenia Guzmán Siritt jj , Kushlani Jayatilleke kk<br />
a From the International Nosocomial Infection Control Consortium, Buenos Aires, Argentina<br />
b Zhongshan Hospital, Shanghai, China<br />
c University of Wisconsin Medical School, Madison, WI<br />
d Medanta the Medcity, New Delhi, India<br />
e Thammasat University Hospital, Pratumthani, Thailand<br />
f Hospital São Paulo, São Paulo, Brazil<br />
g Ondokuz Mayis University Medical School, Samsun, Turkey<br />
h Singapore University Hospital, Singapore, Republic of Singapore<br />
i Hospital Universitario San Ignacio, Universidad Pontificia Javeriana, Bogotá, Colombia<br />
j Jordan University Hospital, Amman, Jordan<br />
k Instituto Mexicano del Seguro Social, Torreón, Mexico<br />
l Instituto Nacional de Enfermedades Neoplásicas, Lima, Peru<br />
56<br />
57<br />
58<br />
59<br />
60<br />
61<br />
62<br />
63<br />
64<br />
65<br />
66<br />
67<br />
68<br />
69<br />
70<br />
71<br />
72<br />
73<br />
74<br />
75<br />
76<br />
77<br />
78<br />
79<br />
80<br />
81<br />
82
<strong>INICC</strong> Papers<br />
1. Reports by Country<br />
2. Annual Reports Pooling all Countries<br />
3. Consecquences of HAIs.<br />
4. Improvement of Process (Hand Hygiene,<br />
Catheter Care, etc).<br />
5. Succesfull Interventions: HAI rate and<br />
mortality rate reduction.
EXTRA MORTALITY
CUs<br />
95% CI<br />
0.39-0.43<br />
0.39-0.40<br />
0.28-0.29<br />
0.22-0.22<br />
0.18-0.19<br />
0.24-0.25<br />
0 ventilator-days<br />
led<br />
an<br />
P<br />
e<br />
95% CI<br />
.1 0.08-0.81<br />
.2 5.3-9.4<br />
.8 6.5-11.7<br />
.1 7.9-12.8<br />
.1 8.8-13.9<br />
.0 7.9-10.2<br />
EXTRA MORTALITY RATES in ADULT ICUs<br />
Table 12<br />
Pooled means and 95% CIs of the distribution of crude mortality and crude excess<br />
mortality * of ICU patients with DA-HAIs, adult and pediatric ICUs combined<br />
Crude mortality of patients<br />
without DA-HAI<br />
Crude mortality of patients<br />
with CLABSI<br />
Crude excess mortality of<br />
patients with CLABSI<br />
Crude mortality rate of<br />
patients with CAUTI<br />
Crude excess mortality of<br />
patients with CAUTI<br />
Crude mortality rate of<br />
patients with VAP<br />
Crude excess mortality of<br />
patients with VAP<br />
Deaths,<br />
n<br />
Patients,<br />
n<br />
Pooled crude<br />
mortality, %<br />
95% CI<br />
11,908 119,501 10.0 9.8-10.14<br />
414 1679 24.7 22.6-26.8<br />
414 1679 14.7 12.8-16.6<br />
290 1677 17.3 15.5-19.2<br />
290 1677 7.3 5.7-9.1<br />
1265 5020 25.2 24.0-24.5<br />
1265 5020 15.2 14.2-14.3<br />
CI, confidence interval.<br />
*Crude excess mortality of DA-HAI 5 crude mortality of ICU patients with DA-HAI -<br />
crude mortality of patients without DA-HAI.<br />
American Journal of Infection Control, 2011.<br />
Table 13<br />
Pooled means and 95% CIs of the distribution of crude mortality and crude excess<br />
mortality * of infants in NICUs, all birth weight categories combined<br />
Q18<br />
589<br />
590<br />
591<br />
592<br />
593<br />
594<br />
595<br />
596<br />
597<br />
598<br />
599<br />
600<br />
601<br />
602<br />
603<br />
604<br />
605<br />
6<strong>06</strong><br />
607<br />
608<br />
609<br />
610<br />
611<br />
612<br />
613<br />
614<br />
615<br />
616<br />
617
EXTRA LENGTH OF STAY
6<br />
Extra Length of Stay Rate of Central-Line<br />
Associated Bloodstream Infection<br />
V.D. Rosenthal et al. / American Journal of Infection Control xxx (2011) 1-11<br />
631<br />
632<br />
633<br />
634<br />
635<br />
636<br />
637<br />
638<br />
639<br />
640<br />
641<br />
642<br />
643<br />
644<br />
645<br />
646<br />
647<br />
648<br />
649<br />
650<br />
651<br />
652<br />
653<br />
654<br />
655<br />
656<br />
Table 14<br />
Q20 Pooled means and 95% CIs of the distribution of the length of stay and crude excess length of stay * of ICU patients with DA-HAI, adult and pediatric ICUs combined<br />
LOS, total days Patients, n Pooled average LOS, days 95% CI<br />
LOS of patients without DA-HAI 746,251 119,501 6.2 6.2-6.3<br />
LOS of patients with CLABSI 28,709 1679 17.1 16.3-17.9<br />
Extra LOS of patients with CLABSI 28,709 1679 10.9 10.1-11.6<br />
LOS of patients with CAUTI 30,982 1677 18.5 17.6-19.4<br />
Extra LOS of patients with CAUTI 30,982 1677 12.2 11.4-13.1<br />
LOS of patients with VAP 90,146 5020 18.0 17.5-18.5<br />
Extra LOS of patients with VAP 90,146 5020 11.7 11.3-12.2<br />
CI, confidence interval; LOS, length of stay.<br />
Table 15<br />
Q21 Pooled means and 95% CIs of the distribution of the length of stay and crude excess length of stay* of infants in NICUs, all birth weight categories combined<br />
LOS, total days Patients, n Pooled average LOS, days 95% CI<br />
LOS of infants without DA-HAI 537 5910 9.1 8.4-9.9<br />
LOS of infants with CLABSI 72 204 35.3 28.7-42.3<br />
Extra LOS of infants with CLABSI 72 204 26.2 20.3-32.4<br />
LOS of infants with VAP 42 175 24.0 17.9-31.0<br />
Extra LOS of infants with VAP 42 175 14.9 8.9-21.1<br />
CI, confidence interval; LOS, length of stay.<br />
Table 16<br />
Antimicrobial resistance rates in the <strong>INICC</strong> ICUs<br />
Pathogen, Antimicrobial<br />
Staphylococcus aureus<br />
American Journal of Infection Control, 2011.<br />
Pathogenic isolates<br />
tested, pooled, CLABSI, n<br />
Resistance,<br />
CLABSI, %<br />
Pathogenic isolates<br />
tested, pooled, VAP, n<br />
Resistance,<br />
VAP, %<br />
Pathogenic isolates<br />
tested, pooled, CAUTI, n<br />
Resistance,<br />
CAUTI, %<br />
696<br />
697<br />
698<br />
699<br />
700<br />
701<br />
702<br />
703<br />
704<br />
705<br />
7<strong>06</strong><br />
707<br />
708<br />
709<br />
710<br />
711<br />
712<br />
713<br />
714<br />
715<br />
716<br />
717<br />
718<br />
719<br />
720<br />
721
New <strong>INICC</strong> Analysis for<br />
Length of Stay and<br />
Mortality<br />
15
New <strong>INICC</strong> Analysis
Extra<br />
Costs<br />
and<br />
Length<br />
of Stay<br />
of HAIs<br />
17
The attributable cost, length of hospital stay, and mortality of central<br />
line-associated BLOODSTREAM INFECTION in intensive care<br />
departments in Argentina: A prospective, matched analysis.<br />
Rosenthal VD, et al. Am J Infect Control 2003;31(8):475-80.<br />
18
The attributable cost, length of hospital stay, and mortality of central<br />
line-associated BLOODSTREAM INFECTION in intensive care<br />
departments in Argentina: A prospective, matched analysis.<br />
Case (N= 142) Control (N= 142) Extra Expenditures<br />
Total days 3,322 1,632 1690<br />
Average length of stay in ICU <strong>23</strong>.39 (SE 1.49) 11.49 (SE 0.68) 11.90<br />
Total fixed cost $830,500 $408,000 $422,500<br />
Mean fixed cost $5,848 (SE 372.89) $2,873 (SE 171.07) $2,975<br />
Antibiotic utilization<br />
Total antibiotics (in DDD*) 4,568 1,356 3,212<br />
Mean antibiotic use per patient<br />
( DDD*)<br />
32.16 (SE 2.81) 9.54 (SE 1.05) 22.62<br />
Total cost of antibiotics $301,488 $29,832 $271,656<br />
Mean costs of antibiotics per patient $2,1<strong>23</strong> (SE 186.<strong>06</strong>) $210 (SE <strong>23</strong>.09) $1,913<br />
Aggregate costs $1,131,988 $437,832 $694,156<br />
Mean aggregate costs per patient $7,971.74 $3,083.32 $4,888.42<br />
Average mortality 77/142 (54.2%) 42/142 (29.6%) 24.6%<br />
Rosenthal VD, et al. Am J Infect Control 2003;31(8):475-80.<br />
19
The Attributable Cost, And Length Of Hospital Stay Of Central Line<br />
Associated BLOOD STREAM INFECTION In Intensive Care Units In<br />
Brazil. A Prospective, Matched Analysis<br />
BSI Controls Extra RR 95 % CI P-value<br />
Total patients (n) 70 140<br />
Total Antibiotic DDD, (DDD) 4243 2124<br />
Antibiotic DDD per patient, (DDD) 60.61 15.17 45.44<br />
Total Antibiotic cost (US$) 312,225.54 99,930.12<br />
Antibiotic cost per patient, (US$) 4,460.36 713.78 3,746.58<br />
Length of Stay (days) 30.58 + 20.41 6.95 + 4.89 <strong>23</strong>.6 4.40 4.08 – 4.75 0.0000<br />
Cost (US$) 9,843.35 1,937.18 7,9<strong>06</strong><br />
Total deaths (n) <strong>23</strong> 45<br />
Crude mortality (%) 32.9% 32.1% 1.02 0.62 – 1.69 0.9316<br />
Reinaldo Salomao, Victor D. Rosenthal, et al. APIC Meeting. Tampa, USA. June 20<strong>06</strong>.<br />
20
The Attributable Cost, And Length Of Hospital Stay Of Central Line<br />
Associated BLOOD STREAM INFECTION In Intensive Care Units In<br />
Mexico. A Prospective, Matched Analysis.<br />
Average length of stay in ICU<br />
(days)<br />
Control<br />
(N= 55)<br />
Case<br />
(N= 55)<br />
Overall<br />
Attributable<br />
Extra<br />
Expenditures<br />
Attributable<br />
Extra<br />
Expenditures<br />
per patient<br />
4<strong>06</strong> 739 333 6.05<br />
Antibiotics (US$) 13,354.35 46,265.96 32,911.61 598.39<br />
Other medicaments (US$) 128,415.14 129,832.44 1,417.30 25.77<br />
Disposables (US$) 219,345.82 308,808.79 89,462.97 1,626.60<br />
Cultures (US$) 1,171.40 2,111.85 940.45 17.10<br />
Other lab tests (US$) 37,441.19 61,174.01 <strong>23</strong>,732.82 431.51<br />
X ray, Scan, etc (US$) 15,198.40 19,556.44 4,358.04 79.24<br />
Other costs (US$) 44,395.46 71,105.56 26,710.09 485.64<br />
Hospitalization (fixed costs) (US<br />
$)<br />
496,326.78 954,294.33 457,967.55 8326.68<br />
Total cost (US$) 955,648.55 1,593,149.38 637,500.83 11,590.92<br />
Higuera F, Rangel-Frausto M, Rosenthal VD, Graves N, et al.<br />
Infection Control and Hospital Epidemiology. January 2007. In Press<br />
21
* Mann-Whitney u-test
* Mann-Whitney u-test
BACTERIAL RESISTANCE
772<br />
773<br />
774<br />
775<br />
776<br />
777<br />
778<br />
779<br />
780<br />
781<br />
782<br />
783<br />
784<br />
785<br />
786<br />
787<br />
788<br />
789<br />
790<br />
791<br />
792<br />
793<br />
794<br />
795<br />
796<br />
797<br />
798<br />
799<br />
800<br />
801<br />
802<br />
803<br />
804<br />
805<br />
8<strong>06</strong><br />
807<br />
808<br />
809<br />
Pediatric ICU<br />
CLABSI 4.6 (3.7-5.6) 3.0 (2.7-3.1)<br />
CAUTI 4.7 (4.1-5.5) 4.2 (3.8-4.7)<br />
VAP 6.5 (5.9-7.1) 1.8 (1.6-2.1)<br />
Newborn ICU (1501-2500 g)<br />
CLABSI 11.9 (10.2-13.9) 1.5 (1.2-1.9)<br />
BACTERIAL RESISTANCE<br />
<strong>INICC</strong> vs CDC-NHSN<br />
VAP 10.1 (7.9-12.8) 0.8 (0.04-1.5)<br />
CI, confidence interval.<br />
DA-HAI and its adverse effects, in the ICUs participating in the<br />
Table 19<br />
Comparison of antimicrobial resistance rates in the ICUs of the <strong>INICC</strong> and the US NHSN<br />
Pathogen, antimicrobial<br />
<strong>INICC</strong>, as well as in all other health care facilities in the developing<br />
world.<br />
<strong>INICC</strong> 2004-2009 US NHSN 20<strong>06</strong>-2007<br />
Resistance, % (CLABSI)<br />
Resistance, % (CLABSI)<br />
Staphylococcus aureus<br />
Oxacillin 84.4 56.8<br />
Enterococcus faecalis<br />
Vancomycin 5.1 78.9<br />
Pseudomonas aeruginosa<br />
Fluoroquinolones * 42.1 30.5<br />
Piperacillin or piperacillin-tazobactam 36.2 20.2<br />
Amikacin 27.7 4.3<br />
Imipenem or meropenem 47.2 <strong>23</strong>.0<br />
Cefepime 100.0 12.6<br />
Klebsiella pneumoniae<br />
Ceftriaxone or ceftazidime 76.3 27.1<br />
Imipenem, meropenem, or ertapenem 7.9 10.8<br />
Acinetobacter baumannii<br />
Imipenem or meropenem 55.3 29.2<br />
Escherichia coli<br />
Ceftriaxone or ceftazidime 66.7 8.1<br />
Imipenem, meropenem, or ertapenem 4.4 0.9<br />
Fluoroquinolones * 53.4 30.8<br />
CI, confidence interval.<br />
*Fluoroquinolones include ciprofloxacin, levofloxacin, moxifloxacin, and ofloxacin.<br />
<strong>INICC</strong>. American Journal of Infection Control, 2011<br />
Table 20<br />
Comparison of DA-HAI rates per 1000 device-days in the <strong>INICC</strong> ICUs, 20<strong>06</strong>, 2008, 2010, and 2011 reports<br />
<strong>INICC</strong> 2002-2005 <strong>INICC</strong> 2002-2007 <strong>INICC</strong> 2003-2008 <strong>INICC</strong> 2004-2009<br />
837<br />
838<br />
839<br />
840<br />
841<br />
842<br />
843<br />
844<br />
845<br />
846<br />
847<br />
848<br />
849<br />
850<br />
851<br />
852<br />
853<br />
854<br />
855<br />
856<br />
857<br />
858<br />
859<br />
860<br />
861<br />
862<br />
863<br />
864<br />
865<br />
866<br />
867<br />
868<br />
869<br />
870<br />
871<br />
872<br />
873<br />
874
Thank you very much<br />
Contact us by email:<br />
Info@inicc.org<br />
Contact us in our Web Page:<br />
www.<strong>INICC</strong>.org<br />
Follow us :<br />
- in facebo in “Hospital Infection <strong>INICC</strong>”<br />
- in Twitter in in “@inicc_org”