Passive smoking and atherosclerosis - IESC/UFRJ
Passive smoking and atherosclerosis - IESC/UFRJ
Passive smoking and atherosclerosis - IESC/UFRJ

You also want an ePaper? Increase the reach of your titles
YUMPU automatically turns print PDFs into web optimized ePapers that Google loves.
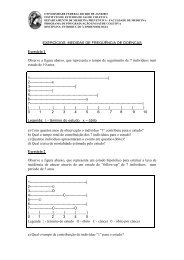
Intermediate Methods in Epidemiology<br />
2008<br />
Exercise No. 4 - <strong>Passive</strong> <strong>smoking</strong> <strong>and</strong> <strong>atherosclerosis</strong><br />
The purpose of this exercise is to allow students to recapitulate issues discussed<br />
throughout the course which affect the inferential process aimed at establishing whether results<br />
of observational studies are consistent with a cause-effect relationship.<br />
Active cigarette <strong>smoking</strong> is an important risk factor for numerous unhealthy outcomes,<br />
including lung cancer <strong>and</strong> cardiovascular diseases. In the 2006 report of the Surgeon General,<br />
“Reducing the Health Consequences of Smoking”, it is estimated that <strong>smoking</strong> is responsible for<br />
approximately 440,000 deaths each year, reflected in the 5,6 million years of life lost annually in<br />
the U.S.<br />
The importance of <strong>smoking</strong> as a hazardous exposure became widely recognized after<br />
the publication of the 1964 Surgeon General’s Report based on a review of more than 7,000<br />
scientific articles on <strong>smoking</strong> <strong>and</strong> health. As an interesting aside, the report was the first ever to<br />
systematically apply the causality criteria that should be considered when assessing<br />
observational data.<br />
Environmental tobacco smoke (passive <strong>smoking</strong>) has also been explored in relation to<br />
many different outcomes, including lung cancer, cardiovascular disease <strong>and</strong> reproductive<br />
outcomes. Based on both case-control <strong>and</strong> cohort studies, the 2006 report of the Surgeon<br />
General concluded that there is no threshold for the health effects of passive <strong>smoking</strong>, that is,<br />
there are no “safe” exposure levels.<br />
(1) Review Hill’s causality criteria. Based on the above Surgeon General’s<br />
conclusion on passive <strong>smoking</strong>, state which criterion has been met.<br />
This exercise will focus on the association of environmental tobacco smoke with the<br />
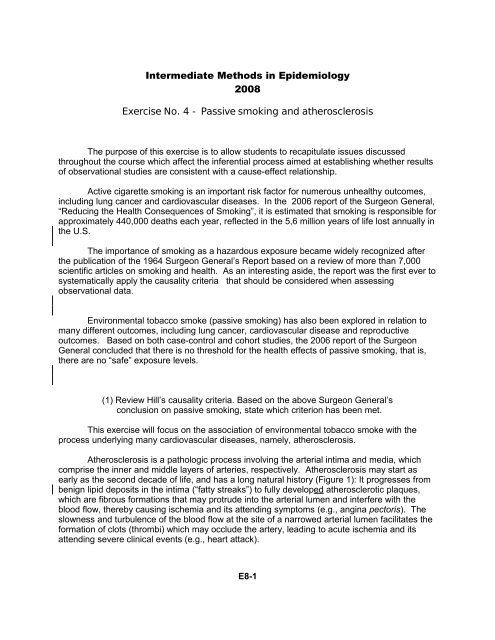
process underlying many cardiovascular diseases, namely, <strong>atherosclerosis</strong>.<br />
Atherosclerosis is a pathologic process involving the arterial intima <strong>and</strong> media, which<br />
comprise the inner <strong>and</strong> middle layers of arteries, respectively. Atherosclerosis may start as<br />
early as the second decade of life, <strong>and</strong> has a long natural history (Figure 1): It progresses from<br />
benign lipid deposits in the intima (“fatty streaks”) to fully developed atherosclerotic plaques,<br />
which are fibrous formations that may protrude into the arterial lumen <strong>and</strong> interfere with the<br />
blood flow, thereby causing ischemia <strong>and</strong> its attending symptoms (e.g., angina pectoris). The<br />
slowness <strong>and</strong> turbulence of the blood flow at the site of a narrowed arterial lumen facilitates the<br />
formation of clots (thrombi) which may occlude the artery, leading to acute ischemia <strong>and</strong> its<br />
attending severe clinical events (e.g., heart attack).<br />
E8-1
Figure 1 – Natural History of Atherosclerosis<br />
Lesion:<br />
Fatty streaks<br />
<br />
Fibrous<br />
plaques<br />
<br />
Raised lesions<br />
<br />
Occlusion by<br />
thrombus<br />
Clinical<br />
expression:<br />
Decade of<br />
life:<br />
None None May cause symptoms<br />
if lumen is narrowed,<br />
e.g., intermittent<br />
claudication, angina<br />
pectoris<br />
1 st / 2 nd / 3 rd 4 th / 5 th 6 th +<br />
Heart attack,<br />
stroke, etc.<br />
(2) What is the relevance of the natural history of atherosclerotic disease in relation<br />
to its primary prevention?<br />
In addition to hypertension, high serum cholesterol levels <strong>and</strong> diabetes, active <strong>smoking</strong><br />
has been consistently identified as a strong determinant of <strong>atherosclerosis</strong>; it appears to be<br />
particularly important in the more advanced stages of <strong>atherosclerosis</strong> (Sharrett et al, Am J<br />
Epidemiol 1999;149:843-52.) . For example, active <strong>smoking</strong> cessation leads to the elimination<br />
of virtually all excess risk of sudden coronary death in about one year after cessation.<br />
.<br />
(3) What does this fact tell you about the mechanism whereby active <strong>smoking</strong><br />
causes sudden coronary death? Is it appropriate to calculate rate per persontime<br />
using a long follow-up interval to study the relationship of active <strong>smoking</strong> to<br />
sudden coronary death?<br />
Sudden coronary death is usually defined as an unexpected out-of-hospital death occurring<br />
within 24 hours of the onset of symptoms (typically chest pain) <strong>and</strong> is caused by acute thrombosis leading<br />
to massive myocardial ischemia.<br />
E8-2
The concern that environmental tobacco exposure may be related to <strong>atherosclerosis</strong><br />
was a logical outgrowth of the role of active <strong>smoking</strong>, <strong>and</strong> has been explored in numerous<br />
studies. Glantz & Parmley (Circulation 1991;83:1-12) showed that, of ten published studies<br />
conducted both in the U.S. <strong>and</strong> abroad (Japan, Scotl<strong>and</strong>, China), only one (by Lee et al) did not<br />
yield a relative risk greater than 1.0 using clinical coronary heart disease death as an outcome<br />
(Figure 2).<br />
(4) Does the outcome used in these studies (mortality) allow firm conclusions on<br />
whether the association of environmental tobacco smoke with coronary heart<br />
disease risk is causal? Why?<br />
(5) Which causality criterion is met by the demonstration that all but one study<br />
showed a positive association between environmental tobacco smoke <strong>and</strong> death?<br />
(6) When conducting a review of the literature such as that reported by Glantz <strong>and</strong><br />
Parmley, what possible bias may interfere with the interpretation of this causality<br />
criterion? Are there situations when this criterion is not met, <strong>and</strong> yet the<br />
association is still causal? What are these situations?<br />
Wells (Environ Int 1988;14:249-65) estimated a pooled risk of coronary heart disease<br />
death in persons exposed to environmental tobacco smoke relative to that in those not exposed<br />
of 1.3 (95% confidence interval, 1.1-1.6) for men <strong>and</strong> 1.2 (95% confidence interval, 1.0 – 1.4) for<br />
women. These estimates are consistent with those arrived at by Glantz & Palmer of 1.3 for both<br />
genders (95% confidence interval 1.2 – 1.4), <strong>and</strong> have been confirmed by the 2006 report of the<br />
Surgeon General.<br />
(7) A relative risk close to one is often referred to as a “small effect”. Is that<br />
statement always true? Why?<br />
Using a relative risk estimate of 1.2 <strong>and</strong> an environmental tobacco smoke<br />
prevalence of approximately 26% (Howard et al, Arch Intern Med<br />
1994;154:1277-82), estimate the percentage of total clinical coronary deaths due<br />
to environmental tobacco <strong>smoking</strong> in women.<br />
E8-3
Recently, it has become possible to study not only clinical manifestations of<br />
<strong>atherosclerosis</strong>, but also subclinical <strong>atherosclerosis</strong> on a community-wide basis. In the<br />
Atherosclerosis Risk in Communities (ARIC) study, a cohort of approximately 15,800 people<br />
aged 45-64 years at baseline recruited from four U.S. communities undergo periodic B-mode<br />
ultrasound examinations of the carotid arteries in the neck for the purpose of measuring arterial<br />
wall (intima plus media) thickness. An increased arterial thickness is a marker of subclinical<br />
<strong>atherosclerosis</strong>.<br />
ARIC’s baseline visit was conducted between 1987 <strong>and</strong> 1989, <strong>and</strong> included in addition to<br />
ultrasound examination of the neck <strong>and</strong> risk factor measurements, questions about<br />
environmental tobacco <strong>smoking</strong>. Information on exposure to environmental tobacco smoke was<br />
obtained from non-active smokers by asking the following question: ”During the past year, about<br />
how many hours per week, on the average, were you in close contact with people when they<br />
were <strong>smoking</strong>? For example, in your home, in a car, at work, or other close quarters?”<br />
Environmental tobacco smokers were defined as those who reported an exposure of 1 or more<br />
hours per week to environmental smoke. Using this definition, approximately 26% of the ARIC<br />
cohort participants were never active smokers exposed to environmental tobacco smoke, 33%<br />
were past active smokers, 27% were current active smokers, <strong>and</strong> only 14% had never smoked<br />
<strong>and</strong> were not exposed to environmental tobacco smoke.<br />
E8-4
The unadjusted cross-sectional relationships between carotid wall thickness <strong>and</strong><br />
<strong>smoking</strong> in ARIC participants without clinically apparent atherosclerotic cardiovascular disease<br />
are shown in table 1. Table 1 also shows the average increases in the mean, median <strong>and</strong> 90 th<br />
percentile values of wall thickness associated with an average increase of one year of age in<br />
never-active smokers not exposed to environmental tobacco smoke. (These values were based<br />
on the cross-sectional relationships between age <strong>and</strong> wall thickness at the time of the baseline<br />
examination of the cohort.)<br />
Table 1. Unadjusted wall (intima + media) thickness of the carotid arteries by <strong>smoking</strong> status in<br />
the Atherosclerosis Risk in Communities (ARIC) study at baseline (1987-89), excluding persons<br />
with prevalent clinical cardiovascular disease¤<br />
Category<br />
Wall Thickness (mm)<br />
Smoking Status<br />
Never Active Smokers<br />
Unexposed<br />
to ETS<br />
(n=1774)<br />
Exposed<br />
to ETS<br />
(n=3358)<br />
Former<br />
Active smokers<br />
(n=4081)<br />
Current<br />
Active<br />
Smokers<br />
(n=3366)<br />
Estimated<br />
Increase/Year of<br />
Age (St<strong>and</strong>ard<br />
Error)§<br />
Mean 0.693 0.705 0.756 0.761 0.0085 (0.0006)<br />
25 th percentile 0.597 0.608 0.632 0.628<br />
50 th percentile 0.671 0.681 0.719 0.717 0.0087 (0.0008)<br />
75 th percentile 0.761 0.773 0.832 0.840<br />
90 th percentile 0.869 0.881 0.978 1.010 0.0136 (0.0019)<br />
¤ Myocardial infarction, angina pectoris, stroke, intermittent claudication<br />
Environmental tobacco smoke (passive <strong>smoking</strong>)<br />
§ In never active smokers not exposed to ETS<br />
(Adapted from: Howard et al, Arch Intern Med 1994;154:1277-82)<br />
(8) What biases may occur when examining the association between <strong>smoking</strong> <strong>and</strong><br />
wall thickness in the ARIC baseline visit, as shown in table 1? Are these biases<br />
likely to occur when studying subclinical outcome only in persons without<br />
evidence of clinical disease? Why?<br />
(9) Why are different percentile values shown in the table, rather than just the mean<br />
(or median) values?<br />
(10) How would you describe the differences among <strong>smoking</strong> categories for the<br />
values of the mean, median <strong>and</strong> 90 th percentile wall thickness vis-à-vis the<br />
estimated increase/year of age?<br />
E8-5
Stratification by age, adjusting for race <strong>and</strong> gender, is shown in Figure 3.<br />
Figure 3. Race <strong>and</strong> gender-adjusted wall (intima + media)<br />
thickness of the carotid arteries (IMT): Percentiles § by age<br />
<strong>and</strong> <strong>smoking</strong> in the Atherosclerosis Risk in Communities (ARIC)<br />
study at baseline (1987-89).<br />
§ In the “box-whisker” plots, the bottom whisker provides the 10 th percentile; the bottom of the<br />
box, the 25 th percentile; the horizontal line in the box, the 50 th percentile (median); the top of the<br />
box, the 75 th percentile; <strong>and</strong> the top of the whisker, the 90 th percentile.<br />
N=nonsmokers<br />
E=exposed to environmental tobacco <strong>smoking</strong><br />
P=past smokers<br />
C=current smokers<br />
(11) What is the assumption underlying the presentation of data simultaneously<br />
adjusted for race <strong>and</strong> gender? Are the findings in Figure 3 consistent with those<br />
in table 1?<br />
E8-6
Crude <strong>and</strong> adjusted estimates of the differences in mean carotid wall thickness in never<br />
active smokers according to exposure to environmental tobacco smoke are shown in table 2.<br />
Table 2. Differences in mean carotid wall thickness (mm) between never smokers exposed <strong>and</strong><br />
those unexposed to environmental tobacco smoke, unadjusted <strong>and</strong> adjusted for combinations of<br />
selected factors in participants of the ARIC study baseline visit, excluding persons with<br />
prevalent clinical cardiovascular disease¤<br />
Difference in mean carotid<br />
wall thickness (mm)<br />
between never smokers<br />
exposed <strong>and</strong> those<br />
Adjusted for:<br />
unexposed to ETS<br />
(p-value)<br />
No factors (crude) 0.012§<br />
Age, race <strong>and</strong> gender<br />
Age, race, gender plus life style factors (education, physical<br />
activity, fat intake, alcohol intake, body mass index)<br />
Age, race, gender, life style factors plus diabetes, hypertension<br />
<strong>and</strong> low density lipoprotein cholesterol<br />
¤ Myocardial infarction, angina pectoris, stroke, intermittent claudication<br />
Environmental tobacco smoke<br />
§ From table 1 (0.705 – 0.693 = 0.012)<br />
0.019 (p0.001)<br />
0.018 (p=0.003)<br />
0.016 (p=0.001)<br />
(12) Why is it important to examine the association between passive <strong>smoking</strong> <strong>and</strong><br />
carotid wall thickness adjusting for different combinations of risk factors (as<br />
opposed to using a single model in which all potential confounders are<br />
simultaneously adjusted)? What is the reason why the adjusted values are<br />
larger than the unadjusted ones?<br />
(13) What is the main shortcoming of assessing environmental tobacco smoke as a<br />
dichotomous variable, as done in tables 1 <strong>and</strong> 2, <strong>and</strong> Figure 3?<br />
E8-7
The relationship of reported number of hours of environmental tobacco <strong>smoking</strong> (ETS)<br />
exposure to carotid wall thickness has been also assessed in ARIC. Using the authors’ own<br />
words, the results (not shown in a table) were as follows: “For the 885 men with ETS exposure,<br />
after controlling for age <strong>and</strong> race, there was an increase in IMT of 0.00792 mm per 10 hours of<br />
weekly ETS exposure, a relationship that proved statistically significant. Despite a larger<br />
sample of ETS women (n=2340), the increase in IMT per 10 hours of ETS exposure was only<br />
0.0011 mm, a difference that proved statistically insignificant (p=0.43).”<br />
(14) In the absence of any other data in the report, can you critically assess whether<br />
there is indeed a linear dose-response relationship in men? Why?<br />
(15) Assuming that these estimates of wall thickness increases are accurate <strong>and</strong><br />
precise, what term would you use to describe the gender difference? What are<br />
some possible reasons for this difference?<br />
In one of the four communities included in the ARIC study, Washington County,<br />
Maryl<strong>and</strong> (the Johns Hopkins site), the sampling frame used to select the ARIC cohort was<br />
based on current Motor Vehicle Administration data, supplemented by a private census<br />
conducted iun 1975 by the Johns Hopkins Training Center for Public Health Research.<br />
About 2,884 of the 4,023 individuals who participated in the Washington County ARIC<br />
baseline examination conducted in 1987-89 could be identified in the 1975 census, which<br />
collected information on <strong>smoking</strong> in the household (Figure 4). Of these persons, data on both<br />
<strong>smoking</strong> in 1975 <strong>and</strong> carotid wall thickness in 1987-89 were available for 2,073 (about 51% of<br />
the total ARIC Washington County cohort). These 2,073 Washington County ARIC cohort<br />
participants comprised the study group used by Diez-Roux et al to examine the relationship of<br />
both active <strong>and</strong> passive <strong>smoking</strong> in 1975 to carotid wall thickness measured in the ARIC<br />
baseline visit approximately 12 to 14 years later (Figure 5) (Preventive Medicine<br />
1995;24:48-55).<br />
E8-8
Figure 4. Schematic representation of the connection between the ARIC study Washington<br />
County cohort at baseline (1987-89) <strong>and</strong> the Washington County census (1975)<br />
ARIC BASELINE VISIT (1987-89)<br />
Jackson, Miss<br />
Minneapolis, MN<br />
(n~3,600)<br />
(n~4,000)<br />
Wash Co, MD,<br />
linked to 1975<br />
census<br />
(n~2,884)<br />
Wash Co,<br />
MD, not<br />
linked to<br />
1975 census<br />
(n~1,139)<br />
Forsythe Co, NC<br />
(n~4,000)<br />
WASHINGTON<br />
COUNTY<br />
CENSUS<br />
(1975)<br />
E8-9
Figure 5. <strong>Passive</strong> <strong>smoking</strong> collected in the 1975 Washington County Census carried out by the<br />
Training Center for Public Health Research <strong>and</strong> carotid wall thickness measured in 1986-89 as<br />
part of ARIC’s baseline visit (n=2,073).<br />
<strong>Passive</strong> <strong>smoking</strong> (census) in<br />
1975<br />
<br />
Carotid Wall thickness (ARIC baseline visit)<br />
in 1986-89<br />
(16) What important causality criterion can be partly assessed in the study by Diez-<br />
Roux, but not in Howard’s study? (The results of the latter are shown in tables 1<br />
<strong>and</strong> 2 <strong>and</strong> Figure 3.) What are the major shortcomings of Diez-Roux’s design<br />
which prevent a full assessment of the criterion?<br />
When comparing the final study group with ARIC participants not linked to the 1975<br />
census, some differences were noted, as shown in table 3:<br />
Table 3. Characteristics of ARIC Participants Not Linked to the 1975 Census <strong>and</strong> the Study<br />
Group in the Analysis by Diez-Roux et al<br />
Characteristic (measured at the<br />
time of the ARIC baseline visit)<br />
ARIC Participants Not Linked<br />
to the 1975 Census (n=1139)<br />
Study Group (n=2073)<br />
Mean Age in years (st<strong>and</strong>ard<br />
deviation) 51.4 (5.7) 54.9 (5.5)<br />
Percentage with High School<br />
Education 72.4 70.5<br />
LDL Cholesterol in mg/dl<br />
(St<strong>and</strong>ard Deviation) 138.3 (35.9) 139.6 (38.6)<br />
Systolic Blood Pressure in<br />
mmHg (St<strong>and</strong>ard Deviation) 117.3 (16.7) 119.3 (17.6)<br />
Percentage with Diabetes 9.1 8.7<br />
Mean Carotid Wall Thickness in<br />
0.746 (0.188) 0.758 (0.212)<br />
mm (St<strong>and</strong>ard Deviation)<br />
The characteristics of the 811 ARIC Washington County cohort participants who were linked<br />
to the 1975 census, but with missing information on passive <strong>smoking</strong> or wall thickness were<br />
very similar to those of the study group.<br />
E8-10
(17) Could these differences have affected the results pertaining to the relationship<br />
between exposure to smoke in 1975 <strong>and</strong> wall thickness in 1987-89? Why or why<br />
not?<br />
The results of the analysis by Diez-Roux are shown in table 4.<br />
Table 4. Crude <strong>and</strong> adjusted mean carotid wall thickness (mm) by exposure to tobacco smoke,<br />
excluding persons with prevalent clinical cardiovascular disease¤, Washington County, 1975<br />
<strong>and</strong> 1987-89<br />
Exposure status<br />
Never Active Smokers:<br />
Sample<br />
Size<br />
Crude Mean<br />
(mm)<br />
Adjusted mean§ ± st<strong>and</strong>ard<br />
error (mm) [p-value§§]<br />
No ETS 189 0.681 0.696 ± 0.012<br />
ETS 1975 only 65 0.711 0.722 ± 0.021 [0.29]<br />
ETS 1987-89 only 250 0.732 0.733 ± 0.011 [0.02]<br />
ETS 1975 <strong>and</strong> 1987-89 219 0.692 0.722 ± 0.012 [0.13]<br />
Never Active Smokers Ever<br />
Exposed to ETS<br />
534 0.713 0.727 ± 0.007 [0.03]<br />
Current active <strong>smoking</strong> in<br />
both 1975 & 1987-89<br />
362 0.776 0.785 ± 0.009 [0.0001]<br />
¤ Myocardial infarction, angina pectoris, stroke, intermittent claudication<br />
§ Adjusted for age, gender, systolic blood pressure, LDL cholesterol, presence of diabetes, fat<br />
intake, physical activity scores, alcohol intake, education, body mass index<br />
§§ P value vis-à-vis never active smokers not exposed to environmental tobacco smoke<br />
Environmental tobacco smoke<br />
(18) Do the results of the study by Diez-Roux et al confirm those of the study by<br />
Howard et al? Are the results in table 4 entirely consistent with the hypothesis<br />
that intensity of exposure is related to carotid wall thickness? How can the<br />
consistency or lack thereof be explained?<br />
(19) The results of the adjustment presented in table 4 were based on a multiple<br />
linear regression model. Why?<br />
E8-11
Matanoski et al compared the characteristics of about 2,500 non-active <strong>smoking</strong> women<br />
whose husb<strong>and</strong>s were smokers with those of approximately 1,400 non-active <strong>smoking</strong> women<br />
whose husb<strong>and</strong>s did not smoke. The study population was identified among women who had<br />
participated in the first National Health <strong>and</strong> Nutrition Examination Survey (NHANES I) carried<br />
out in 1971-75 <strong>and</strong> the NHANES I Epidemiologic Follow-up Study conducted in 1982-84 (Am J<br />
Epidemiol 1995;142:149-57). The odds of having a <strong>smoking</strong> husb<strong>and</strong> relative to that of having<br />
a non<strong>smoking</strong> husb<strong>and</strong> according to selected demographic <strong>and</strong> dietary characteristics are<br />
shown in table 5.<br />
Table 5. Odds ratios of having a <strong>smoking</strong> husb<strong>and</strong> in women who were not active smokers<br />
according to selected demographic <strong>and</strong> dietary variables: first National Health <strong>and</strong> Nutrition<br />
Examination Survey (NHANES I) <strong>and</strong> NHANES I Epidemiologic Follow-up Study.<br />
Characteristic/Food<br />
Odds Ratio (95% confidence interval)<br />
Age 60 years vs. < 40 1.29 (1.10-1.51)<br />
White vs. Nonwhite 0.79 (0.65-0.95)<br />
Urban vs. Rural residence 1.17 (1.01-1.36)<br />
Education > 12 years vs. < 12 years 0.48 (0.40-0.57)<br />
Raw vegetables 1 or more times daily vs. less than<br />
once daily§<br />
0.87 (0.75-1.02)<br />
Eats poultry skin: Yes vs. No§ 1.19 (1.03-1.37)<br />
Odds ratio = [Odds of exposure to factor with <strong>smoking</strong> spouse] [Odds of exposure to factor<br />
with non<strong>smoking</strong> spouse]<br />
§ Age-adjusted<br />
E8-12
The relationship between education <strong>and</strong> <strong>atherosclerosis</strong> measured by average carotid<br />
intima-media thickness using baseline data from the ARIC study is shown in table 6 (Am J<br />
Epidemiol 1995;141:960-72).<br />
Table 6. Age <strong>and</strong> gender-adjusted mean differences (mm) in intima-media carotid artery<br />
average thickness by education <strong>and</strong> race.<br />
Age <strong>and</strong> gender-adjusted mean differences (mm)<br />
between each category <strong>and</strong> the reference category<br />
Educational Level Blacks (n=3,318) Whites (n=9,140)<br />
8 th grade or less 0.036 0.068<br />
9 th – 11 th grade 0.033 0.058<br />
12 th grade or GED 0.005 0.034<br />
1-3 years of vocational school 0.003 0.028<br />
1-4 years of college 0.000 0.018<br />
Graduate or Professional school Reference Reference<br />
General Education Development degree<br />
(20) How do the results shown in tables 5 <strong>and</strong> 6 affect your inference that passive<br />
<strong>smoking</strong> is a risk factor for <strong>atherosclerosis</strong> in general?<br />
(21) Do you believe that passive <strong>smoking</strong> causes <strong>atherosclerosis</strong>? Why?<br />
E8-13