Full Report - Alliance Trust
Full Report - Alliance Trust
Full Report - Alliance Trust

Create successful ePaper yourself
Turn your PDF publications into a flip-book with our unique Google optimized e-Paper software.
47<br />
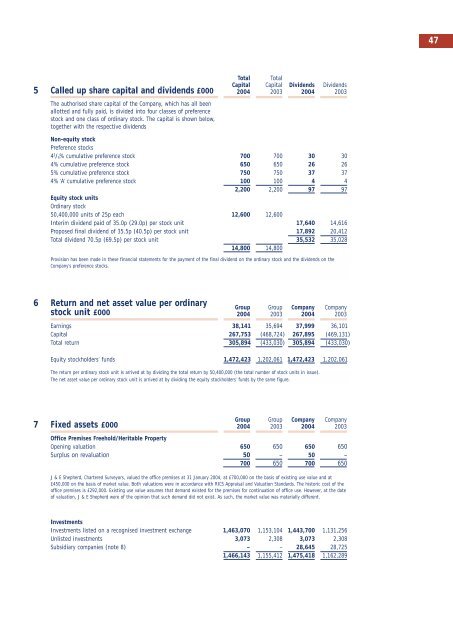
5 Called up share capital and dividends £000<br />
The authorised share capital of the Company, which has all been<br />
allotted and fully paid, is divided into four classes of preference<br />
stock and one class of ordinary stock. The capital is shown below,<br />
together with the respective dividends<br />
Total Total<br />
Capital Capital Dividends Dividends<br />
2004 2003 2004 2003<br />
Non-equity stock<br />
Preference stocks<br />
4 1 / 4 % cumulative preference stock 700 700 30 30<br />
4% cumulative preference stock 650 650 26 26<br />
5% cumulative preference stock 750 750 37 37<br />
4% ‘A’ cumulative preference stock 100 100 4 4<br />
2,200 2,200 97 97<br />
Equity stock units<br />
Ordinary stock<br />
50,400,000 units of 25p each 12,600 12,600<br />
Interim dividend paid of 35.0p (29.0p) per stock unit 17,640 14,616<br />
Proposed final dividend of 35.5p (40.5p) per stock unit 17,892 20,412<br />
Total dividend 70.5p (69.5p) per stock unit 35,532 35,028<br />
14,800 14,800<br />
Provision has been made in these financial statements for the payment of the final dividend on the ordinary stock and the dividends on the<br />
Company’s preference stocks.<br />
6 Return and net asset value per ordinary<br />
stock unit £000<br />
Group Group Company Company<br />
2004 2003 2004 2003<br />
Earnings 38,141 35,694 37,999 36,101<br />
Capital 267,753 (468,724) 267,895 (469,131)<br />
Total return 305,894 (433,030) 305,894 (433,030)<br />
Equity stockholders’ funds 1,472,423 1,202,061 1,472,423 1,202,061<br />
The return per ordinary stock unit is arrived at by dividing the total return by 50,400,000 (the total number of stock units in issue).<br />
The net asset value per ordinary stock unit is arrived at by dividing the equity stockholders’ funds by the same figure.<br />
7 Fixed assets £000<br />
Group Group Company Company<br />
2004 2003 2004 2003<br />
Office Premises Freehold/Heritable Property<br />
Opening valuation 650 650 650 650<br />
Surplus on revaluation 50 – 50 –<br />
700 650 700 650<br />
J & E Shepherd, Chartered Surveyors, valued the office premises at 31 January 2004, at £700,000 on the basis of existing use value and at<br />
£450,000 on the basis of market value. Both valuations were in accordance with RICS Appraisal and Valuation Standards. The historic cost of the<br />
office premises is £292,000. Existing use value assumes that demand existed for the premises for continuation of office use. However, at the date<br />
of valuation, J & E Shepherd were of the opinion that such demand did not exist. As such, the market value was materially different.<br />
Investments<br />
Investments listed on a recognised investment exchange 1,463,070 1,153,104 1,443,700 1,131,256<br />
Unlisted investments 3,073 2,308 3,073 2,308<br />
Subsidiary companies (note 8) – – 28,645 28,725<br />
1,466,143 1,155,412 1,475,418 1,162,289