Full Report - Alliance Trust
Full Report - Alliance Trust
Full Report - Alliance Trust

You also want an ePaper? Increase the reach of your titles
YUMPU automatically turns print PDFs into web optimized ePapers that Google loves.
7<br />
Capital<br />
The year under review has, once again, been a volatile one with<br />
the seesaw movement of equity markets. By the year end,<br />
equity markets had recovered and our closing net asset value of<br />
£29.21 per ordinary stock unit showed a net increase of 22.5%.<br />
This was the first increase for three years.<br />
A comparison of our net asset value over the year against the<br />
UK FTSE All-Share index, which rose 27%, is less favourable. We<br />
have a substantial proportion of our assets overseas and<br />
currency moves have had a significant effect. In the US, where<br />
we have close to 21% of our assets, the depreciation of the US<br />
Dollar by nearly 11% against Sterling reduced stock market<br />
returns on a currency adjusted basis, from 32% to just 19%. The<br />
movement of Asian currencies, apart from the Japanese Yen,<br />
were kept close to the US Dollar, either by intervention or by<br />
increasingly fragile pegs. In Europe, returns were boosted by the<br />
4% appreciation of the Euro against Sterling, but our exposure<br />
accounts for just 10% of our portfolio, as we have been deterred<br />
by the lack of visible structural reform and high valuations.<br />
The greater influence, however, has been in terms of stock<br />
selection. While we were sufficiently confident to move to full<br />
investment we maintained our focus on companies better placed<br />
in terms of management, market position, cash flow and<br />
dividend paying capability. The companies which had been most<br />
exposed by the last downturn were those which performed best<br />
for much of the year. With hindsight, we were too cautious<br />
about two areas in particular: Japanese banks, where we had no<br />
exposure, and IT hardware, where our exposure was limited. This<br />
adversely affected our relative performance.<br />
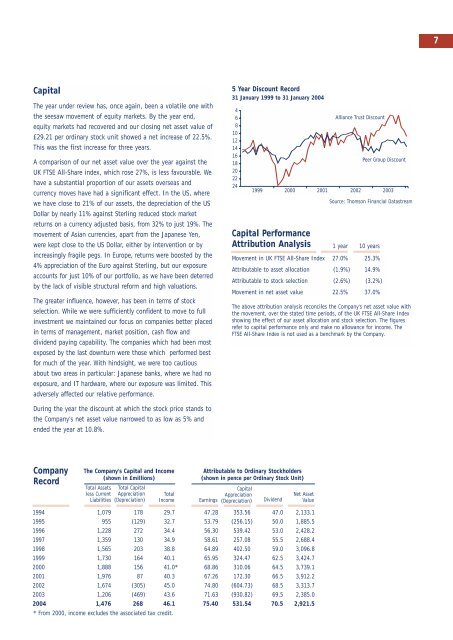
5 Year Discount Record<br />
31 January 1999 to 31 January 2004<br />
4<br />
6<br />
8<br />
10<br />
12<br />
14<br />
16<br />
18<br />
20<br />
22<br />
24<br />
<strong>Alliance</strong> <strong>Trust</strong> Discount<br />
Source: Thomson Financial Datastream<br />
Movement in UK FTSE All-Share Index 27.0% 25.3%<br />
Attributable to asset allocation (1.9%) 14.9%<br />
Attributable to stock selection (2.6%) (3.2%)<br />
Movement in net asset value 22.5% 37.0%<br />
Peer Group Discount<br />
1999 2000 2001 2002 2003<br />
Capital Performance<br />
Attribution Analysis 1 year 10 years<br />
The above attribution analysis reconciles the Company's net asset value with<br />
the movement, over the stated time periods, of the UK FTSE All-Share Index<br />
showing the effect of our asset allocation and stock selection. The figures<br />
refer to capital performance only and make no allowance for income. The<br />
FTSE All-Share Index is not used as a benchmark by the Company.<br />
During the year the discount at which the stock price stands to<br />
the Company’s net asset value narrowed to as low as 5% and<br />
ended the year at 10.8%.<br />
Company<br />
Record<br />
The Company’s Capital and Income<br />
(shown in £millions)<br />
Total Assets<br />
less Current<br />
Liabilities<br />
Total Capital<br />
Appreciation<br />
(Depreciation)<br />
Total<br />
Income<br />
Attributable to Ordinary Stockholders<br />
(shown in pence per Ordinary Stock Unit)<br />
Earnings<br />
Capital<br />
Appreciation<br />
(Depreciation)<br />
Dividend<br />
Net Asset<br />
Value<br />
1994 1,079 178 29.7 47.28 353.56 47.0 2,133.1<br />
1995 955 (129) 32.7 53.79 (256.15) 50.0 1,885.5<br />
1996 1,228 272 34.4 56.30 539.42 53.0 2,428.2<br />
1997 1,359 130 34.9 58.61 257.08 55.5 2,688.4<br />
1998 1,565 203 38.8 64.89 402.50 59.0 3,096.8<br />
1999 1,730 164 40.1 65.95 324.47 62.5 3,424.7<br />
2000 1,888 156 41.0* 68.86 310.06 64.5 3,739.1<br />
2001 1,976 87 40.3 67.26 172.30 66.5 3,912.2<br />
2002 1,674 (305) 45.0 74.80 (604.73) 68.5 3,313.7<br />
2003 1,206 (469) 43.6 71.63 (930.82) 69.5 2,385.0<br />
2004 1,476 268 46.1 75.40 531.54 70.5 2,921.5<br />
* From 2000, income excludes the associated tax credit.