Determination of the thermodynamics of carbonic anhydrase acid ...
Determination of the thermodynamics of carbonic anhydrase acid ...
Determination of the thermodynamics of carbonic anhydrase acid ...

Create successful ePaper yourself
Turn your PDF publications into a flip-book with our unique Google optimized e-Paper software.
Available online at www.sciencedirect.com<br />
J. Biochem. Biophys. Methods 70 (2008) 1043–1047<br />
www.elsevier.com/locate/jbbm<br />
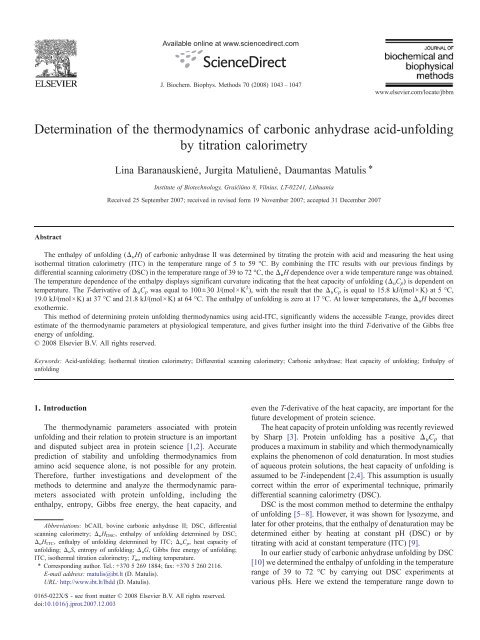
<strong>Determination</strong> <strong>of</strong> <strong>the</strong> <strong>the</strong>rmodynamics <strong>of</strong> <strong>carbonic</strong> <strong>anhydrase</strong> <strong>acid</strong>-unfolding<br />
by titration calorimetry<br />
Lina Baranauskienė, Jurgita Matulienė, Daumantas Matulis ⁎<br />
Institute <strong>of</strong> Biotechnology, Graičiūno 8, Vilnius, LT-02241, Lithuania<br />
Received 25 September 2007; received in revised form 19 November 2007; accepted 31 December 2007<br />
Abstract<br />
The enthalpy <strong>of</strong> unfolding (Δ u H) <strong>of</strong> <strong>carbonic</strong> <strong>anhydrase</strong> II was determined by titrating <strong>the</strong> protein with <strong>acid</strong> and measuring <strong>the</strong> heat using<br />
iso<strong>the</strong>rmal titration calorimetry (ITC) in <strong>the</strong> temperature range <strong>of</strong> 5 to 59 °C. By combining <strong>the</strong> ITC results with our previous findings by<br />
differential scanning calorimetry (DSC) in <strong>the</strong> temperature range <strong>of</strong> 39 to 72 °C, <strong>the</strong> Δ u H dependence over a wide temperature range was obtained.<br />
The temperature dependence <strong>of</strong> <strong>the</strong> enthalpy displays significant curvature indicating that <strong>the</strong> heat capacity <strong>of</strong> unfolding (Δ u C p ) is dependent on<br />
temperature. The T-derivative <strong>of</strong> Δ u C p was equal to 100±30 J/(mol ×K 2 ), with <strong>the</strong> result that <strong>the</strong> Δ u C p is equal to 15.8 kJ/(mol ×K) at 5 °C,<br />
19.0 kJ/(mol×K) at 37 °C and 21.8 kJ/(mol ×K) at 64 °C. The enthalpy <strong>of</strong> unfolding is zero at 17 °C. At lower temperatures, <strong>the</strong> Δ u H becomes<br />
exo<strong>the</strong>rmic.<br />
This method <strong>of</strong> determining protein unfolding <strong>the</strong>rmodynamics using <strong>acid</strong>-ITC, significantly widens <strong>the</strong> accessible T-range, provides direct<br />
estimate <strong>of</strong> <strong>the</strong> <strong>the</strong>rmodynamic parameters at physiological temperature, and gives fur<strong>the</strong>r insight into <strong>the</strong> third T-derivative <strong>of</strong> <strong>the</strong> Gibbs free<br />
energy <strong>of</strong> unfolding.<br />
© 2008 Elsevier B.V. All rights reserved.<br />
Keywords: Acid-unfolding; Iso<strong>the</strong>rmal titration calorimetry; Differential scanning calorimetry; Carbonic <strong>anhydrase</strong>; Heat capacity <strong>of</strong> unfolding; Enthalpy <strong>of</strong><br />
unfolding<br />
1. Introduction<br />
The <strong>the</strong>rmodynamic parameters associated with protein<br />
unfolding and <strong>the</strong>ir relation to protein structure is an important<br />
and disputed subject area in protein science [1,2]. Accurate<br />
prediction <strong>of</strong> stability and unfolding <strong>the</strong>rmodynamics from<br />
amino <strong>acid</strong> sequence alone, is not possible for any protein.<br />
Therefore, fur<strong>the</strong>r investigations and development <strong>of</strong> <strong>the</strong><br />
methods to determine and analyze <strong>the</strong> <strong>the</strong>rmodynamic parameters<br />
associated with protein unfolding, including <strong>the</strong><br />
enthalpy, entropy, Gibbs free energy, <strong>the</strong> heat capacity, and<br />
Abbreviations: bCAII, bovine <strong>carbonic</strong> <strong>anhydrase</strong> II; DSC, differential<br />
scanning calorimetry; Δ u H DSC , enthalpy <strong>of</strong> unfolding determined by DSC;<br />
Δ u H ITC , enthalpy <strong>of</strong> unfolding determined by ITC; Δ u C p , heat capacity <strong>of</strong><br />
unfolding; Δ u S, entropy <strong>of</strong> unfolding; Δ u G, Gibbs free energy <strong>of</strong> unfolding;<br />
ITC, iso<strong>the</strong>rmal titration calorimetry; T m , melting temperature.<br />
⁎ Corresponding author. Tel.: +370 5 269 1884; fax: +370 5 260 2116.<br />
E-mail address: matulis@ibt.lt (D. Matulis).<br />
URL: http://www.ibt.lt/lbdd (D. Matulis).<br />
even <strong>the</strong> T-derivative <strong>of</strong> <strong>the</strong> heat capacity, are important for <strong>the</strong><br />
future development <strong>of</strong> protein science.<br />
The heat capacity <strong>of</strong> protein unfolding was recently reviewed<br />
by Sharp [3]. Protein unfolding has a positive Δ u C p that<br />
produces a maximum in stability and which <strong>the</strong>rmodynamically<br />
explains <strong>the</strong> phenomenon <strong>of</strong> cold denaturation. In most studies<br />
<strong>of</strong> aqueous protein solutions, <strong>the</strong> heat capacity <strong>of</strong> unfolding is<br />
assumed to be T-independent [2,4]. This assumption is usually<br />
correct within <strong>the</strong> error <strong>of</strong> experimental technique, primarily<br />
differential scanning calorimetry (DSC).<br />
DSC is <strong>the</strong> most common method to determine <strong>the</strong> enthalpy<br />
<strong>of</strong> unfolding [5–8]. However, it was shown for lysozyme, and<br />
later for o<strong>the</strong>r proteins, that <strong>the</strong> enthalpy <strong>of</strong> denaturation may be<br />
determined ei<strong>the</strong>r by heating at constant pH (DSC) or by<br />
titrating with <strong>acid</strong> at constant temperature (ITC) [9].<br />
In our earlier study <strong>of</strong> <strong>carbonic</strong> <strong>anhydrase</strong> unfolding by DSC<br />
[10] we determined <strong>the</strong> enthalpy <strong>of</strong> unfolding in <strong>the</strong> temperature<br />
range <strong>of</strong> 39 to 72 °C by carrying out DSC experiments at<br />
various pHs. Here we extend <strong>the</strong> temperature range down to<br />
0165-022X/$ - see front matter © 2008 Elsevier B.V. All rights reserved.<br />
doi:10.1016/j.jprot.2007.12.003
1044 L. Baranauskienė et al. / J. Biochem. Biophys. Methods 70 (2008) 1043–1047<br />
5 °C by titrating <strong>the</strong> protein with <strong>acid</strong> at constant temperature in<br />
ITC. The two methods give essentially <strong>the</strong> same result at about<br />
40 °C. Fur<strong>the</strong>rmore, <strong>the</strong> enthalpy <strong>of</strong> unfolding falls on <strong>the</strong> same<br />
temperature trend. As expected, <strong>the</strong> heat capacity <strong>of</strong> unfolding is<br />
positive. Unexpectedly, however, <strong>the</strong> Δ u C p is found to increase<br />
with temperature. In a previous study <strong>of</strong> <strong>the</strong> temperature dependence<br />
<strong>of</strong> Δ u C p , <strong>the</strong> specific heat capacity increments <strong>of</strong> protein<br />
unfolding were found to decrease with increased temperature<br />
[1].<br />
It is important to determine <strong>the</strong> enthalpy <strong>of</strong> protein unfolding<br />
at physiological temperature in pharmaceutical industry when<br />
carrying out ligand binding screening using any type <strong>of</strong> <strong>the</strong>rmal<br />
shift assay, such as <strong>the</strong> ThermoFluor® assay [11,12]. This assay<br />
uses unfolding enthalpy (Δ u H) at 37 °C to determine <strong>the</strong> ligand<br />
binding constant (K b ) at 37 °C. The K b strongly depends on <strong>the</strong><br />
accuracy <strong>of</strong> Δ u H determination, yet it is <strong>of</strong>ten difficult or<br />
impossible to find appropriate <strong>the</strong>rmal denaturation conditions<br />
that afford accurate direct determination <strong>of</strong> unfolding parameters<br />
for most proteins at such a low temperature. Here we suggest that<br />
<strong>the</strong> protein <strong>acid</strong>-unfolding reaction as followed by ITC can be<br />
used as a general method to determine <strong>the</strong> Δ u H at 37 °C.<br />
2. Materials and methods<br />
2.1. Materials<br />
Carbonic <strong>anhydrase</strong> II (from bovine, bCAII) was purchased<br />
from Sigma (St. Louis, MO) and used without fur<strong>the</strong>r purification.<br />
Concentration <strong>of</strong> <strong>the</strong> protein was determined spectrophotometrically<br />
using ε 280 =52,000 M -1 cm -1 . Hydrochloric<br />
<strong>acid</strong> and NaCl were reagent grade chemicals. MiliQ (Millipore)<br />
deionized water was used in <strong>the</strong> study.<br />
2.2. Iso<strong>the</strong>rmal titration calorimetry<br />
greatly. Peaks were positive (exo<strong>the</strong>rmic, note that Calorimetry<br />
Sciences Corporation calorimeters use opposite sign standard<br />
than MicroCal ITC) at 5 °C and negative (endo<strong>the</strong>rmic) at<br />
37 °C.<br />
Since <strong>the</strong> unfolding reaction is slow, we did not wait for<br />
complete heat evolution and added next HCl portion before <strong>the</strong><br />
completion <strong>of</strong> relaxation to baseline. Since <strong>the</strong> heat continued to<br />
evolve and <strong>the</strong> baseline was not reached, a linear baseline was<br />
drawn to integrate an entire area. In Fig. 2, one can see that <strong>the</strong><br />
endo<strong>the</strong>rmic peaks are larger at higher temperatures because <strong>the</strong><br />
enthalpy <strong>of</strong> unfolding is more endo<strong>the</strong>rmic at higher temperatures.<br />
Fig. 3 shows integrated iso<strong>the</strong>rmal titration calorimetry<br />
curves. At higher temperatures, <strong>the</strong> endo<strong>the</strong>rmic heats were<br />
larger and <strong>the</strong> unfolding reaction was faster. However, between<br />
55 °C and 59 °C <strong>the</strong>re was a steep drop in <strong>the</strong> observed heat.<br />
DSC data show that <strong>the</strong> midpoint (T m ) <strong>of</strong> <strong>the</strong>rmal denaturation<br />
<strong>of</strong> <strong>the</strong> protein is about 64 °C, and since <strong>the</strong>re is a large<br />
preequilibration period (about 1 h) in ITC, <strong>the</strong> protein is partially<br />
unfolded at 59 °C even before <strong>the</strong> titration with <strong>acid</strong><br />
begins. Fig. 4 shows <strong>the</strong> ITC data obtained at lower temperatures.<br />
The observed reaction changes sign and becomes<br />
exo<strong>the</strong>rmic at temperatures below 17 °C.<br />
By summing up <strong>the</strong> enthalpies during <strong>the</strong> course <strong>of</strong> titration,<br />
we obtain <strong>the</strong> integral molar enthalpies <strong>of</strong> <strong>carbonic</strong> <strong>anhydrase</strong><br />
unfolding as a function <strong>of</strong> temperature. The black squares in<br />
Fig. 5 show <strong>the</strong> enthalpies (Δ u H ITC ) obtained by integrating <strong>the</strong><br />
<strong>acid</strong> titration curves in Figs. 3 and 4. Open triangles show<br />
calorimetric enthalpies <strong>of</strong> unfolding measured by DSC (Δ u H DSC ).<br />
The DSC experiments were described earlier [10]. The different<br />
protein melting temperatures in DSC experiments were obtained<br />
by altering <strong>the</strong> pH.<br />
Fig. 5 shows that <strong>the</strong>re is a clearly non-linear increase in Δ u H<br />
as a function <strong>of</strong> temperature. Both ITC and DSC datasets seem<br />
to fall on <strong>the</strong> same trend. There is also quite good congruence<br />
Carbonic <strong>anhydrase</strong> was dissolved in 100 mM NaCl aqueous<br />
solution <strong>of</strong> pH 6–7 to <strong>the</strong> final concentration <strong>of</strong> 0.5–2 (usually<br />
1.0) mg/ml. The protein solution was loaded into <strong>the</strong> Nano ITC-<br />
III iso<strong>the</strong>rmal titration calorimeter (Calorimetry Sciences<br />
Corporation) cell (about 1.2 ml, cell volume 1.025 ml). The<br />
titration syringe (250 µl volume) was filled with 5 to 30 (usually<br />
10) mM HCl containing 70 to 95 (usually 90) mM NaCl.<br />
Titrations were carried out using 25 injections <strong>of</strong> 10 µl each,<br />
injected at 3 to 15 minute intervals. Stirring speed was 150 rpm.<br />
Titrations were carried out at constant temperature in <strong>the</strong> 5–<br />
60 °C temperature range.<br />
3. Results<br />
The <strong>acid</strong>-unfolding <strong>of</strong> <strong>carbonic</strong> <strong>anhydrase</strong> was studied using<br />
iso<strong>the</strong>rmal titration calorimetry (ITC). Hydrochloric <strong>acid</strong> was<br />
injected into <strong>the</strong> unbuffered protein solution in <strong>the</strong> presence <strong>of</strong><br />
NaCl. Fig. 1 shows an unfolding titration carried out at 37 °C,<br />
and shows <strong>the</strong> control titration to determine <strong>the</strong> heat <strong>of</strong> <strong>acid</strong><br />
dilution in <strong>the</strong> absence <strong>of</strong> protein at 37 °C. Fig. 2 shows several<br />
ITC raw data curves obtained at 5, 15, 25, and 37 °C. The<br />
titration pr<strong>of</strong>iles obtained at different temperatures varied<br />
Fig. 1. Iso<strong>the</strong>rmal titration calorimetry raw data–titration <strong>of</strong> <strong>carbonic</strong> <strong>anhydrase</strong><br />
with HCl (black line, Unfolding) and <strong>of</strong> <strong>the</strong> same titration in <strong>the</strong> absence <strong>of</strong><br />
protein (grey line, Dilution). Endo<strong>the</strong>rmic heat evolved upon protein unfolding<br />
is visualized by large peaks pointing downwards. Heat <strong>of</strong> HCl dilution is<br />
relatively small. Both shown titrations were carried out at 37 °C.
L. Baranauskienė et al. / J. Biochem. Biophys. Methods 70 (2008) 1043–1047<br />
1045<br />
Fig. 2. ITC raw data at various temperatures: 5, 15, 25, and 37 °C. Since <strong>the</strong><br />
unfolding reaction is not complete in 4 min, <strong>the</strong> baseline does not reach full<br />
relaxation and <strong>the</strong> reaction continues into <strong>the</strong> next peak. The reaction is<br />
exo<strong>the</strong>rmic at 5 °C and endo<strong>the</strong>rmic at 37 °C.<br />
between <strong>the</strong> ITC and <strong>the</strong> DSC data around 40–45 °C. Above<br />
45 °C, <strong>the</strong> enthalpy measured by ITC begins to drop due to <strong>the</strong><br />
long preequilibration in <strong>the</strong> calorimeter at <strong>the</strong>se higher<br />
temperatures (i.e. <strong>the</strong> three ITC points at 49, 55, and 59 °C).<br />
Therefore, at temperatures where <strong>the</strong>rmal unfolding begins,<br />
<strong>acid</strong>-ITC data is no longer reliably comparable to <strong>the</strong> DSC<br />
values. On <strong>the</strong> o<strong>the</strong>r hand, DSC data could not be obtained at<br />
temperatures lower than 40 °C. Only <strong>the</strong> combination <strong>of</strong> <strong>the</strong>se<br />
two methods provided direct calorimetric data on <strong>the</strong> enthalpy<br />
<strong>of</strong> unfolding for such a wide temperature range.<br />
Each dataset on its own seems to follow an almost straight<br />
line without any apparent curvature. However, <strong>the</strong> overall<br />
dependence displays obvious curvature indicating that <strong>the</strong> heat<br />
capacity <strong>of</strong> unfolding is dependent on temperature.<br />
Fig. 4. Integrated curves <strong>of</strong> <strong>the</strong> ITC data at low temperatures. The enthalpy <strong>of</strong> <strong>the</strong><br />
reaction is exo<strong>the</strong>rmic at low temperatures and changes sign at about 17 °C.<br />
3.1. Heat capacity <strong>of</strong> unfolding dependence on temperature<br />
The combined DSC and ITC (5–72 °C) data in Fig. 5 were<br />
regressed to a curved line. We assumed that <strong>the</strong>re is a dependence<br />
<strong>of</strong> <strong>the</strong> heat capacity on temperature, such that:<br />
D u C p ¼ D u C pTm þ DD u C p ðT<br />
T m Þ ð1Þ<br />
where ΔΔ u C p is a constant (T-independent) coefficient <strong>of</strong> <strong>the</strong> heat<br />
capacity dependence on temperature. In Fig. 5, <strong>the</strong> curved line<br />
was obtained using ΔΔ u C p =100±30 J/(mol×K 2 ). The heat<br />
capacity <strong>of</strong> unfolding, equal to <strong>the</strong> tangential slope <strong>of</strong> <strong>the</strong> line at<br />
any specific temperature in Fig. 5, was 15.8 kJ/(mol×K) at 5 °C,<br />
19.0 kJ/(mol×K) at 37 °C, and 21.8 kJ/(mol×K) at <strong>the</strong> melting<br />
temperature (T m =64 °C).<br />
Fig. 3. Integrated curves <strong>of</strong> <strong>the</strong> ITC data at high temperatures. The endo<strong>the</strong>rmic<br />
heats are larger and evolve faster at higher temperatures until between 55 and<br />
59 °C where <strong>the</strong>re is a steep drop because <strong>the</strong> protein unfolds at this temperature<br />
during <strong>the</strong> preequilibration in ITC.<br />
Fig. 5. Integral enthalpies <strong>of</strong> <strong>carbonic</strong> <strong>anhydrase</strong> unfolding as a function <strong>of</strong><br />
temperature. The black squares show Δ u H ITC values obtained by <strong>the</strong> titration <strong>of</strong><br />
<strong>the</strong> protein with <strong>acid</strong> as described in <strong>the</strong> text. The open triangles show <strong>the</strong><br />
calorimetric enthalpies <strong>of</strong> unfolding measured by DSC, (Δ u H DSC ) as described<br />
previously [10]. Both datasets follow <strong>the</strong> same trend and <strong>the</strong>re is good agreement<br />
at about 40 °C. Above 45 °C <strong>the</strong> Δ u H ITC drops since <strong>the</strong> protein unfolds during<br />
<strong>the</strong> long preequilibration period. Bold line shows <strong>the</strong> best fit under assumption<br />
that <strong>the</strong> Δ u C p is dependent on temperature as described in <strong>the</strong> text (Eq. (8)).<br />
Narrow line shows <strong>the</strong> fit <strong>of</strong> <strong>the</strong> DSC and ITC data according to Eq. (2).
1046 L. Baranauskienė et al. / J. Biochem. Biophys. Methods 70 (2008) 1043–1047<br />
The enthalpy dependence on temperature was calculated by:<br />
D u H ¼ D u H Tm þ D u C pTm þ DD u C p ðT<br />
T m Þ ðT T m Þ ð2Þ<br />
where Δ u H Tm is <strong>the</strong> enthalpy <strong>of</strong> unfolding at melting temperature.<br />
It was determined by regression <strong>of</strong> <strong>the</strong> experimental<br />
data (Fig. 5). The best fit yielded Δ u H Tm = 803 kJ/mol.<br />
O<strong>the</strong>r <strong>the</strong>rmodynamic parameters could also be estimated<br />
using <strong>the</strong> same value <strong>of</strong> ΔΔ u C p . The entropy <strong>of</strong> unfolding was<br />
calculated by:<br />
D u S ¼ D u S Tm þ D u C pTm þ DD u C p ðT<br />
T m Þ <br />
ln T <br />
ð3Þ<br />
T m<br />
where Δ u S Tm is <strong>the</strong> entropy <strong>of</strong> unfolding at <strong>the</strong> melting<br />
temperature obtained by:<br />
D u S Tm ¼ D uH<br />
ð4Þ<br />
T m<br />
since <strong>the</strong> Gibbs free energy <strong>of</strong> unfolding at T m is equal to zero:<br />
D u G Tm ¼ 0 ð5Þ<br />
The Gibbs free energy was computed at various temperatures<br />
by:<br />
D u G ¼ D u H TD u S ð6Þ<br />
The probability <strong>of</strong> <strong>the</strong> protein to remain folded at various<br />
temperatures was calculated by:<br />
1<br />
P folded ¼<br />
ð7Þ<br />
1 þ e D uG=RT<br />
The probability multiplied by <strong>the</strong> enthalpy <strong>of</strong> unfolding gives<br />
<strong>the</strong> enthalpy that could be observed by ITC and predicts <strong>the</strong><br />
steep drop <strong>of</strong> <strong>the</strong> <strong>acid</strong>-ITC enthalpy (bold line in Fig. 5):<br />
D u H max ITC ¼ D u H P folded ð8Þ<br />
This maximum <strong>of</strong> <strong>the</strong> enthalpy <strong>of</strong> unfolding that could be<br />
observed by ITC was estimated to be 691 kJ/mol at 60 °C.<br />
4. Discussion<br />
It is common practice to determine <strong>the</strong> enthalpy <strong>of</strong> protein<br />
unfolding by differential scanning calorimetry (DSC). This<br />
approach limits <strong>the</strong> available data to higher temperatures where<br />
most proteins denature, ranging from about 50 to 70 °C.<br />
Proteins have to be artificially destabilized to reduce <strong>the</strong>ir<br />
melting temperature. One <strong>of</strong> <strong>the</strong> most common means to<br />
destabilize a protein is to reduce <strong>the</strong> pH. It was shown using<br />
lysozyme as a model protein that <strong>the</strong> enthalpy <strong>of</strong> unfolding<br />
determined by DSC at various pHs is equal to <strong>the</strong> enthalpy <strong>of</strong><br />
unfolding determined by iso<strong>the</strong>rmal calorimetric titration <strong>of</strong> <strong>the</strong><br />
protein with <strong>acid</strong> [9].<br />
Here we use <strong>the</strong> same approach to determine <strong>the</strong> enthalpy <strong>of</strong><br />
<strong>carbonic</strong> <strong>anhydrase</strong> unfolding by iso<strong>the</strong>rmal titration calorimetry<br />
(ITC), by carrying out denaturation with <strong>acid</strong> and comparing<br />
<strong>the</strong> observed enthalpy (Δ u H ITC ) with <strong>the</strong> enthalpy obtained by<br />
DSC (Δ u H DSC ) in our earlier study [10]. Such an approach<br />
significantly expands <strong>the</strong> accessible temperature range (down<br />
to nearly 0 °C) and measures enthalpies at constant temperature.<br />
Fur<strong>the</strong>rmore, it provides more detailed information about<br />
<strong>the</strong> T-dependence <strong>of</strong> <strong>the</strong> heat capacity <strong>of</strong> unfolding.<br />
During any <strong>acid</strong> titration one observes <strong>the</strong> sum <strong>of</strong> processes<br />
such as dilution <strong>of</strong> <strong>the</strong> <strong>acid</strong>, dilution <strong>of</strong> <strong>the</strong> protein solution,<br />
protonation <strong>of</strong> <strong>the</strong> ionic groups <strong>of</strong> <strong>the</strong> protein (aspartic <strong>acid</strong>,<br />
glutamic <strong>acid</strong>, and histidine residues), aggregation <strong>of</strong> <strong>the</strong><br />
protein, and anion binding to <strong>the</strong> positively charged protein at<br />
low pH. Analysis <strong>of</strong> <strong>the</strong> data may be fur<strong>the</strong>r complicated if <strong>the</strong><br />
unfolding reaction is not fully reversible, or if unfolding intermediates<br />
are present, such as <strong>the</strong> molten globule that was<br />
reported for <strong>carbonic</strong> <strong>anhydrase</strong> [13]. Our previous DSC<br />
analysis at low pH indicated that <strong>the</strong> process is reversible and<br />
could be described by a simple two-state model at any tested pH<br />
[10]. While <strong>the</strong> possible contributions <strong>of</strong> anion binding and<br />
molten globule formation to <strong>the</strong> unfolding energetics were not<br />
determined in this study, it is remarkable that DSC and ITC<br />
approaches yielded essentially <strong>the</strong> same enthalpy <strong>of</strong> unfolding<br />
at about 40 °C, which is a strong indication that <strong>the</strong> enthalpies<br />
obtained by both methods are accurate and consistent.<br />
The concave-up curvature <strong>of</strong> Δ u H versus temperature shown<br />
in Fig. 5 indicates that <strong>the</strong> heat capacity <strong>of</strong> unfolding is becoming<br />
more positive as <strong>the</strong> temperature increases. From <strong>the</strong> curvature <strong>of</strong><br />
<strong>the</strong> Δ u H dependence on temperature (Fig. 5) we have determined<br />
<strong>the</strong> second derivative to be about ΔΔ u C p =100±30J/(mol×K 2 ).<br />
This is inconsistent with <strong>the</strong> previous calculations and observations<br />
reviewed by [1] since <strong>the</strong>ir results indicated that Δ u C p<br />
decreases as <strong>the</strong> temperature increases. Biophysical community is<br />
in general agreement that <strong>the</strong> ΔΔ u C p <strong>of</strong> protein unfolding should<br />
be negative.<br />
However, our value may be explainable by <strong>the</strong> behaviour <strong>of</strong><br />
alkanes in water by comparing <strong>the</strong> reaction <strong>of</strong> protein refolding<br />
with <strong>the</strong> reaction <strong>of</strong> alkane aggregation in water. The heat capacity<br />
change <strong>of</strong> linear alkane aggregation expressed per mole <strong>of</strong><br />
methylene group (CH 2 ) per degree is equal to −0.24 J/(mol<br />
CH 2 ×K 2 ) [14,15]. TheT-derivative <strong>of</strong> <strong>the</strong> heat capacity <strong>of</strong> <strong>carbonic</strong><br />
<strong>anhydrase</strong> unfolding was measured here to be 100 J/(mol<br />
CH 2 ×K 2 ), thus for <strong>the</strong> process <strong>of</strong> refolding <strong>the</strong> value is −100 J/<br />
(mol CH 2 ×K 2 ). Dividing this value for <strong>the</strong> entire protein by <strong>the</strong><br />
value for <strong>the</strong> methylene group, we obtain that <strong>the</strong>re could be about<br />
420 methylene groups that are hidden from water during <strong>the</strong><br />
folding reaction.<br />
From <strong>the</strong> bCAII amino <strong>acid</strong> sequence and structure, we<br />
calculate that <strong>the</strong>re are 530 methylene, methyl, and aromatic<br />
carbon atoms in <strong>the</strong> side chains <strong>of</strong> amino <strong>acid</strong>s that are hidden<br />
inside <strong>the</strong> folded protein molecule and representing <strong>the</strong> maximum<br />
number <strong>of</strong> small hydrophobic groups that may become exposed to<br />
water if complete unfolding <strong>of</strong> <strong>the</strong> protein occurred.<br />
The number estimated from <strong>the</strong> energetic measurements,<br />
420, is similar to <strong>the</strong> number <strong>of</strong> hydrophobic groups calculated<br />
from <strong>the</strong> protein sequence and structure, 530. This could be just<br />
a fortuitous coincidence or it may have a physical basis. The<br />
difference (~20%) could be accounted for by <strong>the</strong> fact that not all<br />
hydrophobic groups are fully exposed to water upon unfolding.<br />
Fur<strong>the</strong>rmore, <strong>the</strong> aromatic and aliphatic groups are probably
L. Baranauskienė et al. / J. Biochem. Biophys. Methods 70 (2008) 1043–1047<br />
1047<br />
hydrated somewhat differently. However, <strong>the</strong> agreement is<br />
interesting, and it suggests that <strong>the</strong> same physical forces may be<br />
behind <strong>the</strong> heat capacity dependence on temperature in both<br />
protein folding and alkane aggregation.<br />
It is important to note that <strong>the</strong> ΔΔ u C p <strong>of</strong> protein unfolding is<br />
considered to be negative by <strong>the</strong> biophysical community [1].<br />
Our ΔΔ u C p value is uncorrected for a number <strong>of</strong> energetically<br />
linked phenomena including protonation, ion binding, and <strong>the</strong><br />
formation <strong>of</strong> partially folded intermediates.<br />
Subtracting <strong>the</strong> heats <strong>of</strong> glutamic and aspartic <strong>acid</strong> protonation<br />
that get protonated upon <strong>the</strong> titration with <strong>acid</strong> from <strong>the</strong><br />
observed enthalpy <strong>of</strong> protein unfolding would shift <strong>the</strong> ITC part<br />
<strong>of</strong> <strong>the</strong> curve in Fig. 5 upwards increasing <strong>the</strong> unexpected<br />
curvature <strong>of</strong> <strong>the</strong> enthalpy dependence on temperature. Therefore,<br />
<strong>the</strong> heats <strong>of</strong> protonation cannot explain <strong>the</strong> curvature.<br />
Anion binding to <strong>the</strong> positively charged protein may contribute<br />
significantly to <strong>the</strong> energetics. For example, <strong>the</strong> enthalpy <strong>of</strong><br />
iodide binding to <strong>the</strong> first site <strong>of</strong> deionized bovine serum<br />
albumin is equal to −72.8 kJ/mol [16], while <strong>the</strong> enthalpy <strong>of</strong><br />
non-specific anion binding to proteins in <strong>the</strong> presence <strong>of</strong> salt<br />
and buffer is usually followed by a relatively small exo<strong>the</strong>rmic<br />
or near zero enthalpy change [17]. Therefore it is unlikely that<br />
anion binding could account for <strong>the</strong> curvature.<br />
The protein denaturation by <strong>acid</strong> followed by ITC is<br />
worth testing on proteins o<strong>the</strong>r than <strong>carbonic</strong> <strong>anhydrase</strong> to<br />
make a general statement that above conclusions apply to o<strong>the</strong>r<br />
proteins.<br />
5. Simplified description <strong>of</strong> <strong>the</strong> method<br />
Acid-unfolding measured by ITC is a technique that<br />
complements DSC well, and both methods may be used to<br />
determine <strong>the</strong>rmodynamics <strong>of</strong> protein unfolding. The precision<br />
<strong>of</strong> <strong>the</strong> data obtained by both techniques is comparable. ITC<br />
enabled <strong>the</strong> determination <strong>of</strong> <strong>the</strong> enthalpy <strong>of</strong> unfolding at<br />
temperatures far lower than room temperature and under<br />
iso<strong>the</strong>rmal conditions, while DSC is constrained to protein<br />
melting temperatures. Combination <strong>of</strong> DSC and ITC data gives<br />
<strong>the</strong> dependence <strong>of</strong> <strong>the</strong> enthalpy <strong>of</strong> unfolding on temperature in a<br />
wide T-range — a necessary condition to determine <strong>the</strong> nonlinearity<br />
<strong>of</strong> <strong>the</strong> enthalpy dependence on temperature. The<br />
temperature derivative <strong>of</strong> <strong>the</strong> heat capacity <strong>of</strong> <strong>the</strong> unfolding <strong>of</strong><br />
<strong>the</strong> protein may be quantitatively accounted for by <strong>the</strong><br />
<strong>the</strong>rmodynamics <strong>of</strong> hydrophobic group exposure upon unfolding<br />
<strong>of</strong> <strong>the</strong> protein.<br />
References<br />
[1] Makhatadze GI, Privalov PL. Energetics <strong>of</strong> protein structure. Adv Protein<br />
Chem 1995;47:307–425.<br />
[2] Murphy KP. Protein structure, stability, and folding. Humana Press; 2001.<br />
[3] Prabhu NV, Sharp KA. Heat capacity in proteins. Annu Rev Phys Chem<br />
2005;56:521–48.<br />
[4] Robertson AD, Murphy KP. Protein structure and <strong>the</strong> energetics <strong>of</strong> protein<br />
stability. Chem Rev 1997;97:1251–68.<br />
[5] Bruylants G, Wouters J, Michaux C. Differential scanning calorimetry in<br />
life science: <strong>the</strong>rmodynamics, stability, molecular recognition and<br />
application in drug design. Curr Med Chem 2005;12:2011–20.<br />
[6] Freire E. Differential scanning calorimetry. Methods Mol Biol 1995;40:<br />
191–218.<br />
[7] Hu CQ, Kitamura S, Tanaka A, Sturtevant JM. Differential scanning<br />
calorimetric study <strong>of</strong> <strong>the</strong> <strong>the</strong>rmal unfolding <strong>of</strong> mutant forms <strong>of</strong> phage T4<br />
lysozyme. Biochemistry 1992;31:1643–7.<br />
[8] Jelesarov I, Bosshard HR. Iso<strong>the</strong>rmal titration calorimetry and differential<br />
scanning calorimetry as complementary tools to investigate <strong>the</strong> energetics<br />
<strong>of</strong> biomolecular recognition. J Mol Recognit 1999;12:3–18.<br />
[9] Pfeil W, Privalov PL. Thermodynamic investigations <strong>of</strong> proteins. I.<br />
Standard functions for proteins with lysozyme as an example. Biophys<br />
Chemist 1976;4:23–32.<br />
[10] Matulis D, Kranz JK, Salemme FR, Todd MJ. Thermodynamic stability <strong>of</strong><br />
<strong>carbonic</strong> <strong>anhydrase</strong>: measurements <strong>of</strong> binding affinity and stoichiometry<br />
using ThermoFluor. Biochemistry 2005;44:5258–66.<br />
[11] Pantoliano MW, Petrella EC, Kwasnoski JD, Lobanov VS, Myslik J, Graf<br />
E, et al. High-density miniaturized <strong>the</strong>rmal shift assays as a general<br />
strategy for drug discovery. J Biomol Screen 2001;6:429–40.<br />
[12] Todd MJ, Salemme FR. Direct binding assays for pharma screening.<br />
Genetic Eng News 2003;23.<br />
[13] Ptitsyn OB, Pain RH, Semisotnov GV, Zerovnik E, Razgulyaev OI.<br />
Evidence for a molten globule state as a general intermediate in protein<br />
folding. FEBS Lett 1990;262:20–4.<br />
[14] Matulis D, Bloomfield VA. Thermodynamics <strong>of</strong> <strong>the</strong> hydrophobic effect. I.<br />
Coupling <strong>of</strong> aggregation and pK a shifts in solutions <strong>of</strong> aliphatic amines.<br />
Biophys Chemist 2001;93:37–51.<br />
[15] Matulis D. Thermodynamics <strong>of</strong> <strong>the</strong> hydrophobic effect. III. Condensation<br />
and aggregation <strong>of</strong> alkanes, alcohols, and alkylamines. Biophys Chemist<br />
2001;93:67–82.<br />
[16] Lovrien R, Sturtevant JM. Calorimetric determination <strong>of</strong> <strong>the</strong> enthalpies <strong>of</strong><br />
binding <strong>of</strong> ions to deionized bovine serum albumin. Biochemistry 1971;10:<br />
3811–5.<br />
[17] Klotz IM. Ligand–receptor energetics. A guide for <strong>the</strong> perplexed. Wiley-<br />
Interscience; 1997.