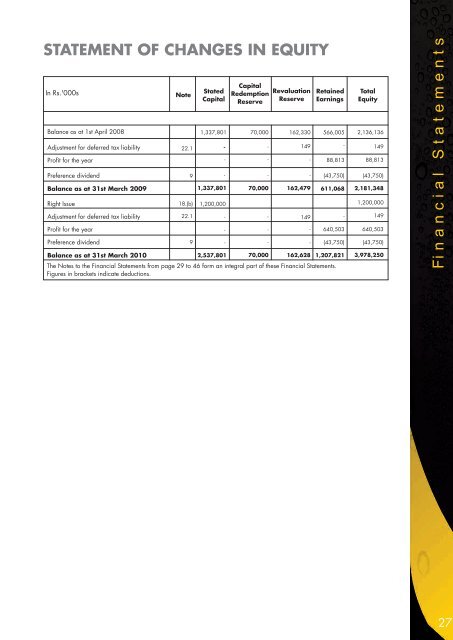
STATEMENT OF CHANGES IN EQUITY In Rs.'000s Balance as at 1st April 2008 Adjustment for deferred tax liability Profit for the year Preference dividend Balance as at 31st March <strong>2009</strong> Right Issue Adjustment for deferred tax liability Profit for the year Preference dividend Balance as at 31st March <strong>2010</strong> Note 22.1 9 18.(b) 22.1 9 Stated Capital 1,337,801 - 1,337,801 1,200,000 2,537,801 - - - - - Capital Redemption Reserve 70,000 - - - 70,000 - - - 70,000 Revaluation Reserve 162,330 149 162,479 - - 149 162,628 - - Retained Earnings 566,005 - 88,813 (43,750) 611,068 - 640,503 (43,750) 1,207,821 The Notes to the Financial Statements from page 29 to 46 form an integral part of these Financial Statements. Figures in brackets indicate deductions. Total Equity 2,136,136 149 88,813 (43,750) 2,181,348 1,200,000 149 640,503 (43,750) 3,978,250 Fi F i n a n c i i a l l S t t a t e m e n t s 27
Fi F n i n a a n n c c i i a a l l S S t t a t t e m e n t s CASH FLOW STATEMENT For the year ended 31st March In Rs.'000s Cash Flows from Operating Activities Profit before Taxation Adjustments for: Finance expenses Depreciation on property, plant & equipment Amortisation of intangible assets Property, plant & equipments write back Intangible assets write off Interest cost capitalised Adjustments made for Property plant & equipment Provision for gratuity Profit on disposal of property, plant & equipment Interest income Operating cash flow before working capital changes (Increase) in inventories Decrease / (Increase) in trade and other receivables Increase in amounts due from related companies Increase in trade and other payables Increase / ( Decrease) in amounts due to related companies Cash generated from operations Finance expenses paid Gratuity paid Income tax paid <strong>2010</strong> 632,695 240,105 125,357 <strong>2009</strong> 81,889 391,339 128,747 Inventory Provisions and write offs 15 56,435 31,180 Note 7 12 13 12 13 12 12 21 5 5 7 21 13,559 - - (5,587) 4,524 7,063 (926) (1,606) 1,071,619 (2,027) (184,871) (17,488) 190,127 (59,548) 997,812 (240,105) (1,177) - 3,626 (1,599) 2,959 (15,264) - 10,992 (919) (533) 632,417 (338,523) 37,020 (15,801) 25,869 71,212 412,194 (391,339) (1,668) (2) Economic service charge paid (17,676) (11,402) Net cash generated from operating activities 738,854 7,783 Cash Flows from Investing Activities Purchase of property , plant & equipment and intangible assets 12 & 13 (118,240) (209,612) Proceeds from sale of property,plant & equipment 1,044 1,020 Customer deposits received 20.3 59,931 168,185 Customer deposits refunded Long term investment 20.3 14 (25,966) (355,738) (11,048) (346,834) Interest received 5 1,606 533 Net cash used in investing activities (437,363) (397,756) Cash Flows from Financing Activities Proceeds from right issue 18.b 1,200,000 - Long term loan received 20.1 - 50,000 Repayments of long term borrowings Dividend paid 20.1 (37,447) (43,895) (86,645) (43,750) Net cash generated from/ (used in) financing activities 1,118,658 (80,395) Net increase/(decrease) in cash & cash equivalents 1,420,149 (470,368) Cash & cash equivalents at the beginning of the year (1,600,278) (1,129,910) Cash & cash equivalents at the end of the year (180,129) (1,600,278) Analysis of cash & cash equivalents Cash & cash equivalents Short term loan Bank overdraft 151,545 - (331,674) (180,129) 69,316 (400,000) (1,269,594) (1,600,278) 28 The Notes to the Financial Statements from page 29 to 46 form an integral part of these Financial Statements. Figures in brackets indicate deductions