Strategies for Coupling Nonvolatile Salt-Based HPLC to ... - Dionex
Strategies for Coupling Nonvolatile Salt-Based HPLC to ... - Dionex
Strategies for Coupling Nonvolatile Salt-Based HPLC to ... - Dionex

You also want an ePaper? Increase the reach of your titles
YUMPU automatically turns print PDFs into web optimized ePapers that Google loves.
<strong>Strategies</strong> <strong>for</strong> <strong>Coupling</strong> of <strong>Nonvolatile</strong> <strong>Salt</strong>-<strong>Based</strong> <strong>HPLC</strong> <strong>to</strong> MS Detection <strong>for</strong> the<br />
Separation and Characterization of Related Substances in Biopharmaceuticals<br />
Gurmil Gendeh, 1 Evert-Jan Sneekes, 2 Wim Decrop, 2 Marco Karsten, 2 and Remco Swart 2<br />
1<br />
Thermo Fisher Scientific, Sunnyvale, CA, USA<br />
2<br />
Thermo Fisher Scientific, Amsterdam, The Netherlands<br />
On-Line LC-UV-SPE-MS<br />
An important task in the pharmaceutical development<br />
process is the identification of impurities in drug<br />
substances and products. The International Conference<br />
on Harmonisation of Technical Requirements <strong>for</strong><br />
Registration of Pharmaceuticals <strong>for</strong> Human Use (ICH)<br />
has published guidelines on this <strong>to</strong>pic. These guidelines<br />
require that impurities be identified when present above<br />
concentration limits of 0.05 and 0.10%, depending on the<br />
daily dose. 1<br />
The sensitivity and specificity of mass spectrometry<br />
(MS) are ideally suited <strong>for</strong> the identification of impurities.<br />
However, LC methods <strong>for</strong> separating pharmaceuticals<br />
that use mobile phases containing buffers are often<br />
incompatible with MS detection. Development of new<br />
LC methods is often expensive and time consuming.<br />
Validation with regula<strong>to</strong>ry agencies is another barrier <strong>to</strong><br />
implementing new methods. Solid-phase extraction (SPE)<br />
of buffers from the mobile phase after separation is a timeand<br />
cost-effective alternative <strong>to</strong> new method development.<br />
Here, the authors describe an au<strong>to</strong>mated and<br />
hyphenated LC method <strong>for</strong> the identification of<br />
pharmaceutical compounds. An SPE desalting step is<br />
applied prior <strong>to</strong> sample introduction <strong>to</strong> the MS detec<strong>to</strong>r,<br />
removing buffers from the eluent stream. This allows<br />
current methods <strong>to</strong> be used with MS detection without<br />
new method development. On-line LC-UV-SPE-MS<br />
offers several advantages:<br />
• Completely au<strong>to</strong>mated method facilitates method<br />
validation.<br />
• Original (filed) <strong>HPLC</strong> method can be used.<br />
• LC and MS sensitivity can be optimized<br />
independently.<br />
• UV detection can be used <strong>for</strong> quantification of<br />
related compounds/impurities.<br />
• SPE column can be used <strong>for</strong> the removal of<br />
interfering buffer salts and <strong>for</strong> preconcentration<br />
(multiple loadings).<br />
System Configuration <strong>for</strong> On-Line<br />
LC-UV-SPE-MS<br />
A Thermo Scientific <strong>Dionex</strong> UltiMate 3000 ×2<br />
Dual-Gradient <strong>HPLC</strong> system comprising two integrated<br />
gradient pumps was used. Pump 1 was used <strong>for</strong><br />
separation on the analytical column. Pump 2 was used<br />
<strong>to</strong> transfer the impurities <strong>to</strong> the SPE column and <strong>for</strong><br />
desalting on the SPE column. An isocratic pump was<br />
used <strong>for</strong> elution of the impurities from the SPE column<br />
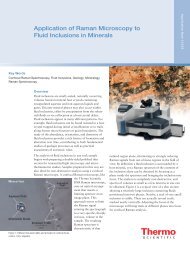
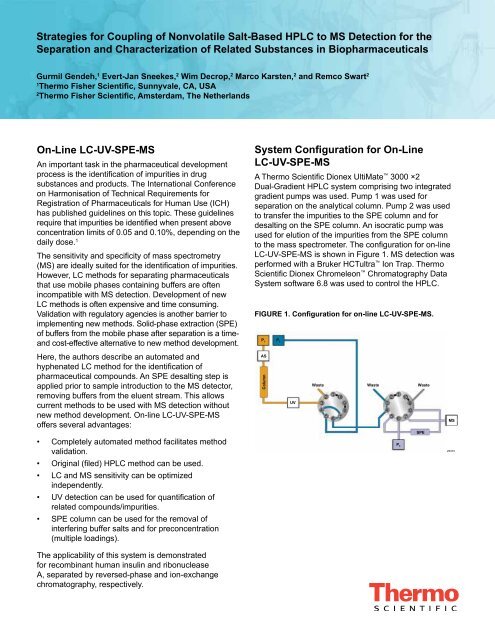
<strong>to</strong> the mass spectrometer. The configuration <strong>for</strong> on-line<br />
LC-UV-SPE-MS is shown in Figure 1. MS detection was<br />
per<strong>for</strong>med with a Bruker HCTultra Ion Trap. Thermo<br />
Scientific <strong>Dionex</strong> Chromeleon Chroma<strong>to</strong>graphy Data<br />
System software 6.8 was used <strong>to</strong> control the <strong>HPLC</strong>.<br />
FIGURE 1. Configuration <strong>for</strong> on-line LC-UV-SPE-MS.<br />
P 1<br />
AS<br />
Column<br />
P 2<br />
UV<br />
Waste<br />
Waste<br />
P 3<br />
Waste<br />
SPE<br />
MS<br />
25373<br />
The applicability of this system is demonstrated<br />
<strong>for</strong> recombinant human insulin and ribonuclease<br />
A, separated by reversed-phase and ion-exchange<br />
chroma<strong>to</strong>graphy, respectively.
The experimental workflow includes the following steps:<br />
• Separation of the analytes<br />
• Trapping of related compound in loop<br />
• Transfer of related compound <strong>to</strong> SPE column and<br />
removal of salts<br />
• Elution of related compound <strong>to</strong> MS<br />
The separation is moni<strong>to</strong>red with UV detection. Selection<br />
of the related compound can be per<strong>for</strong>med on retention<br />
time or by using a peak trigger based on the UV signal.<br />
The latter option has the advantage that retention time<br />
variation is accounted <strong>for</strong>.<br />
The LC and SPE systems are linked via a two-position<br />
switching valve with or without an additional sample loop<br />
<strong>to</strong> trap the related compound. The concept of in-loop<br />
trapping (column ➔ trapping loop ➔ SPE column ➔ MS)<br />
features some advantages compared <strong>to</strong> in-line trapping<br />
(column ➔ SPE column ➔ MS). The chroma<strong>to</strong>graphic<br />
method is independent of the SPE wash step and elution<br />
<strong>to</strong> the mass spectrometer. Also, the backpressure on<br />
the SPE column does not influence the LC per<strong>for</strong>mance<br />
(possible shift in retention times). In addition, this<br />
configuration maintains low backpressure on the UV flow<br />
cell as well as a low system pressure (see left valve,<br />
Figure 1). However, the loop dimensions must be<br />
carefully selected.<br />
USP <strong>HPLC</strong> Method <strong>for</strong> Related Compounds of<br />
Recombinant Insulin<br />
Sample:<br />
Recombinant human insulin<br />
3.75 mg/mL in 0.01 M HCl<br />
Analytical Column: Thermo Scientific Acclaim 120,<br />
C18, 3 µm, 4.6 × 150 mm<br />
SPE Column: Oasis ® 2.1 × 50 mm, 15 µm<br />
Solvents: (A) 0.2 M sodium sulfate,<br />
pH 2.3/ace<strong>to</strong>nitrile 82/18 (v/v %)<br />
(B) 0.2 M sodium sulfate,<br />
pH 2.3/ace<strong>to</strong>nitrile 50/50 (v/v %)<br />
Gradient: Time (min) % B<br />
0 24.5<br />
36 24.5<br />
61 64.0<br />
67 64.0<br />
68 24.5<br />
91 24.5<br />
Make-Up Liquid: Water<br />
SPE Elution: 80/20 ace<strong>to</strong>nitrile/H 2<br />
O + 1%<br />
<strong>for</strong>mic acid<br />
Flow Rates:<br />
Detection:<br />
Analytical column: 1.00 mL/min<br />
Make-up: 0.50 mL/min<br />
Elution from SPE column: 0.05 mL/min<br />
UV: 214 nm, 280 nm<br />
MS: 300–2000 m/z<br />
Ion-Exchange <strong>HPLC</strong> Separation of<br />
Ribonuclease A<br />
Sample: Approximately 0.35 mg/mL<br />
Ribonuclease A (1.75 µg injected)<br />
Analytical<br />
Column:<br />
SPE Column:<br />
Thermo Scientific ProPac SCX-10,<br />
2 × 250 mm<br />
Thermo Scientific Acclaim PepMap <br />
300 C18, 5 µm, 1.0 × 15 mm<br />
Solvents: (A) 20 mM MES + 60 mM NaCl, pH 5.6<br />
(B) 20 mM MES + 180 mM NaCl, pH 5.6<br />
Gradient: 55–85% B in 50 min<br />
SPE Elution: 80/20 ace<strong>to</strong>nitrile/H 2<br />
O + 1% <strong>for</strong>mic acid<br />
Flow Rates: Analytical column: 0.20 mL/min<br />
Make-up flow rate: 0.50 mL/min<br />
Elution from SPE column: 0.05 mL/min<br />
Results and Discussion<br />
Reversed-Phase <strong>HPLC</strong> Separation of Related<br />
Compounds of Recombinant Insulin<br />
Human insulin, a 5.7 kDa polypeptide, is used <strong>to</strong> treat<br />
some <strong>for</strong>ms of diabetes mellitus and is mainly produced<br />
through recombinant techniques. One of the release<br />
tests of human insulin is the quantification of related<br />
compounds. The United States Pharmacopeia (USP)<br />
has published a reversed-phase LC (RPLC) method<br />
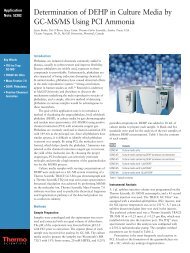
<strong>for</strong> determining insulin and related impurities. A typical<br />
chroma<strong>to</strong>gram is shown in Figure 2.<br />
FIGURE 2. Separation of human insulin and compounds<br />
according <strong>to</strong> the USP method.<br />
5.8<br />
mAU<br />
0<br />
0<br />
Hydrophilic<br />
impurities<br />
Insulin<br />
Minutes<br />
A21 Desamido insulin<br />
(Main impurity)<br />
Hydrophobic<br />
impurities<br />
52<br />
In-Loop Trapping<br />
Transfer <strong>to</strong> SPE Column<br />
Wash SPE Column<br />
Transfer <strong>to</strong> MS<br />
2 <strong>Strategies</strong> <strong>for</strong> <strong>Coupling</strong> of <strong>Nonvolatile</strong> <strong>Salt</strong>-<strong>Based</strong> <strong>HPLC</strong> <strong>to</strong> MS Detection <strong>for</strong> the Separation and<br />
Characterization of Related Substances in Biopharmaceuticals<br />
25374
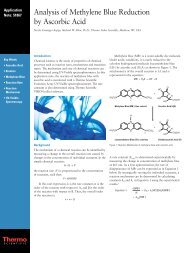
The influence of elution flow rate on MS detection<br />
of insulin and related compounds was studied. The<br />
resulting extracted ion chroma<strong>to</strong>grams and MS<br />
spectra are shown in Figure 3. A significantly improved<br />
detection sensitivity was obtained with low elution flow<br />
rates. Depending of the amount of related compounds<br />
transferred <strong>to</strong> the SPE column, the flow rate can be<br />
adjusted <strong>to</strong> obtain sufficient MS signal with a reasonable<br />
analysis time. If the sensitivity is not sufficient applying<br />
this standard procedure, the related compound can be<br />
trapped on the SPE column multiple times be<strong>for</strong>e elution<br />
<strong>to</strong> the mass spectrometer.<br />
FIGURE 3. Influence of SPE column elution flow rate on the<br />
mass spectrometer signal. Extracted ion chroma<strong>to</strong>grams<br />
(EIC) of 969.0 m/z (left) and MS spectra summed across<br />
peak <strong>for</strong> 25, 100, and 300 µL/min elution flow rates (right)<br />
with 80/20 ace<strong>to</strong>nitrile/H 2<br />
O + 1% <strong>for</strong>mic acid.<br />
1<br />
Intens.<br />
× 10 9<br />
25 µL/min<br />
0<br />
× 10 7<br />
1 50 µL/min<br />
Intens.<br />
× 10 9<br />
0<br />
1 100 µL/min<br />
Intens.<br />
Intens.<br />
× 10 9<br />
0<br />
1 200 µL/min<br />
Intens.<br />
× 10 9<br />
0<br />
1 300 µL/min<br />
Intens.<br />
968.9 1162.6<br />
× 10 9 0<br />
400 600 800 1000 1200 1400 1600<br />
0<br />
18 20 22 24 26 28 30 32<br />
m/z<br />
Minutes<br />
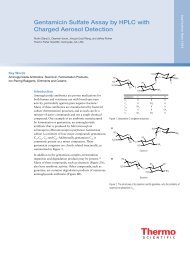
FIGURE 4. MS spectra of insulin (left) and A21 desamido<br />
insulin (right).<br />
25376<br />
Ion-Exchange <strong>HPLC</strong> Separation of<br />
Ribonuclease A and Variants<br />
Ion-exchange chroma<strong>to</strong>graphy is becoming more<br />
important as an LC technique <strong>for</strong> the characterization<br />
of biopharmaceutical proteins. For the separation of<br />
protein variants which often bear different charges,<br />
ion-exchange LC is often more selective than reversedphase<br />
2<br />
MS spectrum 969.0<br />
25 µL/min<br />
<strong>HPLC</strong>. The application of on-line LC-UV-SPE-MS<br />
Intens.<br />
1162.4<br />
<strong>for</strong> ion-exchange chroma<strong>to</strong>graphy of intact proteins was<br />
tested with the analysis of ribonuclease A, a 124 residue,<br />
0<br />
~13.7 kDa protein. The chroma<strong>to</strong>gram of ribonuclease A<br />
is shown in Figure 5.<br />
2<br />
MS spectrum 100 µL/min<br />
× 10 7<br />
0<br />
969.0<br />
1162.4<br />
FIGURE 5. UV chroma<strong>to</strong>gram of ribonuclease A on the<br />
ProPac SCX column. Collected fractions F1 through F5<br />
are labeled.<br />
30<br />
WVL: 214 nm<br />
2<br />
MS spectrum 300 µL/min<br />
Intens.<br />
25375<br />
1.5<br />
6+<br />
968.8<br />
Intens.<br />
5+<br />
Intens.<br />
× 10 8 1162.2<br />
× 10 7<br />
0<br />
mAU<br />
4+<br />
1452.7<br />
6<br />
0<br />
6+<br />
968.8<br />
5+<br />
1162.4<br />
400 600 800 1000 1200 1400 1600 400 600 800 1000 1200 1400 1600<br />
m/z<br />
m/z<br />
F1<br />
F2<br />
F3<br />
F4<br />
F5<br />
The recovery of insulin was determined using a<br />
0.1 mg/mL standard injected on<strong>to</strong> the SPE system<br />
with and without an analytical LC column installed. UV<br />
detection was applied <strong>to</strong> quantify the insulin peak. The<br />
recovery was 95%, which is sufficient <strong>for</strong> this qualitative<br />
method. The peak area precisions <strong>for</strong> insulin on the<br />
analytical column and SPE column were 0.10 and<br />
3.5 %RSD, respectively.<br />
One of the known modifications of insulin is deamidation<br />
of asparagine residues, <strong>for</strong>ming an iso-aspartic acid<br />
residue. As a result of this modification the molar mass<br />
is increased by one unit. Insulin and A21 desamido<br />
insulin were trapped, desalted, and detected by MS.<br />
The resulting MS spectra are shown in Figure 4. The<br />
deconvoluted masses <strong>for</strong> insulin and desamido insulin<br />
were 5806.6 and 5807.3 Da, respectively.<br />
-10<br />
10 12 14 16<br />
18<br />
Minutes<br />
25377<br />
3
The MS spectra of selected protein variants and<br />
ribonuclease A are shown in Figure 6. One of the<br />
protein variants shows a mass difference of 98 Da with<br />
ribonuclease. This could be the result of an additional<br />
phosphorylation site.<br />
FIGURE 6. MS spectra of ribonuclease A (F5) and two<br />
variants eluting at 15.6 and 15.8 min in Figure 5 (F3 and<br />
F4). In all spectra, ribonuclease A was detected with a<br />
deconvoluted mass of Mw 13680.2. Protein variants of<br />
13422.1 and 13777.7 Da were detected <strong>for</strong> LC fractions F3<br />
and F4 with the a<strong>for</strong>ementioned retention times.<br />
1<br />
Intens.<br />
1053.5<br />
1141.3<br />
978.3<br />
1244.8<br />
1369.0 1521.0<br />
895.9<br />
1711.1<br />
1850.5 2180.7<br />
0<br />
500 750 1000 1250 1500 1750 2000 2250 2500 m/z<br />
5<br />
Intens.<br />
× 10 6<br />
1141.1<br />
1244.7<br />
1053.6<br />
978.3<br />
913.2<br />
856.2<br />
1521.1<br />
1369.2<br />
1711.2<br />
0<br />
500 750 1000 1250 1500 1750 2000 2250 2500 m/z<br />
F3<br />
F4<br />
Conclusion<br />
On-Line LC-UV-SPE-MS is a useful technique<br />
<strong>for</strong> identification of impurities and product related<br />
compounds using nonMS compatible <strong>HPLC</strong> methods.<br />
The original (filed/validated) methods can readily be<br />
applied without the need <strong>for</strong> method redevelopment<br />
and revalidation.<br />
The technique shows excellent per<strong>for</strong>mance <strong>for</strong> RPLC<br />
and ion-exchange LC methods and is applicable <strong>for</strong><br />
(bio) pharmaceutical products (small molecules as well<br />
as therapeutical proteins) up <strong>to</strong> large intact proteins.<br />
The method is robust and shows good recovery and<br />
precision. In-loop analyte trapping triggered by UV signal<br />
provides the highest robustness and flexibility.<br />
Reference<br />
1. International Conference on Harmonisation<br />
of Technical Requirements <strong>for</strong> Registration of<br />
Pharmaceuticals <strong>for</strong> Human Use, ICH Harmonised<br />
Tripartite Guideline Impurities In New Drug<br />
Substances Q3A(R2), Current Step 4 Version,<br />
25 Oc<strong>to</strong>ber 2006, http://www.ich.org/fileadmin/<br />
Public_Web_Site/ICH_Products/Guidelines/Quality/<br />
Q3A_R2/Step4/Q3A_R2__Guideline.pdf<br />
(accessed Jun 27, 2011).<br />
× 10 7 25378<br />
6<br />
F5<br />
1369.0<br />
1521.0<br />
1710.8<br />
Intens.<br />
1244.7<br />
1053.4 1141.1<br />
× 10 7 500 750 1000 1250 1500 1750 2000 2250 2500 m/z<br />
0<br />
978.3<br />
913.1<br />
856.0<br />
1955.3<br />
©2011 Thermo Fisher Scientific, Inc. Oasis is a registered trademark of Waters Corporation. HCTultra is a trademark of Bruker Dal<strong>to</strong>nics.<br />
All other trademarks are the property of Thermo Fisher Scientific Inc. and its subsidiaries.<br />
This in<strong>for</strong>mation is not intended <strong>to</strong> encourage use of these products in any manners that might infringe the intellectual property rights of others.<br />
<strong>Dionex</strong> Products: 1228 Titan Way, PO Box 3603, Sunnyvale, CA 94088-3603, (408) 737-0700<br />
North America: U.S./Canada (847) 295-7500<br />
South America: Brazil (55) 11 3731 5140<br />
Europe: Austria (43) 616 51 25, Benelux (31) 20 683 9768 (32) 3 353 4294<br />
Denmark (45) 36 36 90 90, France (33) 1 39 30 01 10, Germany (49) 61125 991 0<br />
Ireland (353) 644 0064, Italy (39) 02 51 62 1267, Sweden (46) 8 473 3380,<br />
Switzerland (41) 62 205 9966, United Kingdom (44) 1276 691722<br />
Asia Pacific: Australia (61) 2 9420 5233, China (852) 2428 3282, India (91) 22 2764 2735,<br />
Japan (81) 6885 1213, Korea (82) 2 2653 2580, Singapore (65) 6289 1190,<br />
Taiwan (886) 2 875 6655<br />
www.thermoscientific.com/dionex<br />
LPN 2960-01 10/11