The Biuret Method for the Determination of Total Protein Using an ...
The Biuret Method for the Determination of Total Protein Using an ...
The Biuret Method for the Determination of Total Protein Using an ...

Create successful ePaper yourself
Turn your PDF publications into a flip-book with our unique Google optimized e-Paper software.
Application<br />
Note: 51859<br />
<strong>The</strong> <strong>Biuret</strong> <strong>Method</strong> <strong>for</strong> <strong>the</strong> <strong>Determination</strong> <strong>of</strong><br />
<strong>Total</strong> <strong>Protein</strong> <strong>Using</strong> <strong>an</strong> Evolution Array<br />
8-Position Cell Ch<strong>an</strong>ger<br />
Nicole Krueziger Keppy, Michael W. Allen, Ph.D, <strong>The</strong>rmo Fisher Scientific, Madison, WI, USA<br />
Key Words<br />
• <strong>Biuret</strong> <strong>Method</strong><br />
• 8-Position Cell<br />
Ch<strong>an</strong>ger<br />
• <strong>Total</strong> <strong>Protein</strong><br />
• UV-Visible<br />
Spectroscopy<br />
Introduction<br />
One commonly used method <strong>for</strong> determining <strong>the</strong> total<br />
protein in a sample is <strong>the</strong> <strong>Biuret</strong> method. <strong>The</strong> <strong>Biuret</strong> method<br />
is based on <strong>the</strong> complexation <strong>of</strong> Cu 2+ to functional groups<br />
in <strong>the</strong> protein’s peptide bonds as shown in Figure 1.<br />
<strong>The</strong> <strong>for</strong>mation <strong>of</strong> a Cu 2+ -protein complex requires two<br />
peptide bonds <strong>an</strong>d produces a violet-colored chelate<br />
product which is measured by absorption spectroscopy<br />
at 540 nm. Over a given<br />
concentra tion r<strong>an</strong>ge,<br />
NH 2 NH 2<br />
<strong>the</strong> measured absorption<br />
at 540 nm is linear<br />
with respect to <strong>the</strong><br />
NH NH<br />
concentration <strong>of</strong> total<br />
protein. This relationship<br />
Cu 2+<br />
allows a st<strong>an</strong>dard curve<br />
to be created that is<br />
NH 2 NH 2<br />
used to calculate <strong>the</strong><br />
concentration <strong>of</strong> <strong>an</strong> Figure 1: <strong>Biuret</strong> reagent reacts with <strong>an</strong><br />
alkaline solution <strong>of</strong> CuSO<br />
unknown sample.<br />
4 to <strong>for</strong>m a violet<br />
chelate compound<br />
Experiment <strong>an</strong>d Results<br />
<strong>The</strong> <strong>Biuret</strong> reagent was prepared by adding 3 g <strong>of</strong><br />
CuSO 4<br />
•5H 2 O <strong>an</strong>d 9 g <strong>of</strong> sodium potassium citrate to<br />
500 mL <strong>of</strong> 0.2 N NaOH solution, followed by <strong>the</strong><br />
addition <strong>of</strong> 5 g <strong>of</strong> KI. <strong>The</strong> resulting solution was <strong>the</strong>n<br />
brought to a total volume <strong>of</strong> 1 L with 0.2 N NaOH.<br />
Alternatively, <strong>the</strong> <strong>Biuret</strong> reagent is available from a<br />
variety <strong>of</strong> sources including <strong>The</strong>rmo Fisher Scientific.<br />
<strong>Protein</strong> st<strong>an</strong>dards <strong>an</strong>d <strong>the</strong> sample were prepared with<br />
saline solution (8.5 g/L) according to Table 1. 3.0 mL <strong>of</strong><br />
<strong>Biuret</strong> reagent was added to each st<strong>an</strong>dard <strong>an</strong>d sample,<br />
<strong>the</strong> solution was mixed well <strong>an</strong>d incubated at room<br />
temperature <strong>for</strong> 30 minutes.<br />
Test Tube Number<br />
Reagent 1 2 3 4 5 6 7 8<br />
3.0 mg/mL<br />
BSA (mL)<br />
– 0.2 0.4 0.7 1.0 2.0 3.0 –<br />
<strong>Protein</strong><br />
Sample (mL)<br />
– – – – – – – 1.0<br />
Saline<br />
Solution (mL)<br />
3.0 2.8 2.6 2.3 2.0 1.0 – 2.0<br />
Final<br />
Concentration 0 200 400 700 1000 2000 3000 –<br />
(µg/mL)<br />
Table 1: Preparation <strong>of</strong> <strong>Protein</strong> St<strong>an</strong>dards <strong>an</strong>d <strong>the</strong> Sample<br />
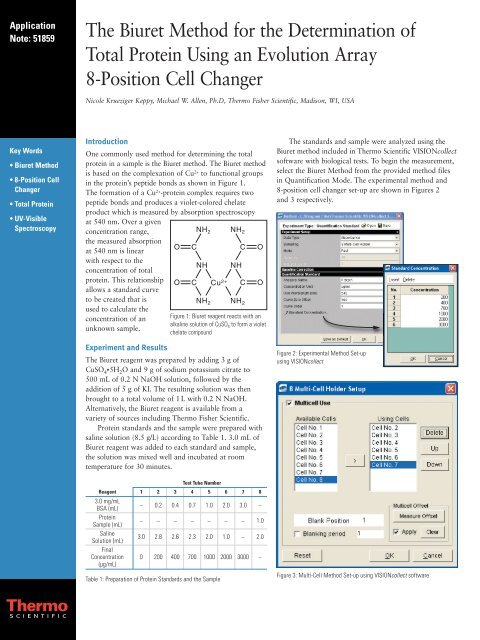
<strong>The</strong> st<strong>an</strong>dards <strong>an</strong>d sample were <strong>an</strong>alyzed using <strong>the</strong><br />
<strong>Biuret</strong> method included in <strong>The</strong>rmo Scientific VISIONcollect<br />
s<strong>of</strong>tware with biological tests. To begin <strong>the</strong> measurement,<br />
select <strong>the</strong> <strong>Biuret</strong> <strong>Method</strong> from <strong>the</strong> provided method files<br />
in Qu<strong>an</strong>tification Mode. <strong>The</strong> experimental method <strong>an</strong>d<br />
8-position cell ch<strong>an</strong>ger set-up are shown in Figures 2<br />
<strong>an</strong>d 3 respectively.<br />
Figure 2: Experimental <strong>Method</strong> Set-up<br />
using VISIONcollect<br />
Figure 3: Multi-Cell <strong>Method</strong> Set-up using VISIONcollect s<strong>of</strong>tware
St<strong>an</strong>dards 2 to 7 were measured at 540 nm using<br />
st<strong>an</strong>dard 1 as <strong>the</strong> reference sample, or bl<strong>an</strong>k. A linear fit<br />
was applied to <strong>the</strong> st<strong>an</strong>dard results in Table 2 to obtain<br />
<strong>the</strong> st<strong>an</strong>dard curve shown in Figure 4. <strong>The</strong> resulting<br />
calibration curve exhibits a linear relationship with a<br />
correlation coefficient (R 2 ) <strong>of</strong> 0.9996. <strong>The</strong> unknown<br />
sample was measured in Qu<strong>an</strong>tification mode. <strong>Using</strong><br />
<strong>the</strong> calibration curve <strong>the</strong> concentration <strong>of</strong> protein in<br />
<strong>the</strong> sample was calculated to be 1553 µg/mL, as shown<br />
in Table 2.<br />
Figure 4: <strong>Biuret</strong>-<strong>Protein</strong> Complex Spectrum <strong>an</strong>d Calibration Curve<br />
Solution Concentration (µg/mL) Absorb<strong>an</strong>ce<br />
St<strong>an</strong>dard 2 200 0.0238<br />
St<strong>an</strong>dard 3 400 0.0541<br />
St<strong>an</strong>dard 4 700 0.0862<br />
St<strong>an</strong>dard 5 1000 0.1304<br />
St<strong>an</strong>dard 6 2000 0.2514<br />
St<strong>an</strong>dard 7 3000 0.3817<br />
Unknown Sample 1553 0.1972<br />
Table 2: Results <strong>of</strong> <strong>Protein</strong> St<strong>an</strong>dards <strong>an</strong>d <strong>the</strong> Sample using <strong>Biuret</strong> <strong>Method</strong><br />
Conclusion<br />
Automated qu<strong>an</strong>titative <strong>an</strong>alysis <strong>of</strong> protein is per<strong>for</strong>med<br />
quickly <strong>an</strong>d easily using <strong>the</strong> <strong>The</strong>rmo Scientific Evolution<br />
Array UV-Visible spectrophotometer. <strong>The</strong> VISIONcollect <br />
s<strong>of</strong>tware includes a pre-configured method <strong>for</strong> <strong>the</strong> <strong>Biuret</strong><br />
assay, allowing fur<strong>the</strong>r customization to individual laboratory<br />
protocols. Integration <strong>of</strong> <strong>the</strong> sample measurement <strong>an</strong>d data<br />
<strong>an</strong>alysis into VISIONcollect s<strong>of</strong>tware saves time <strong>an</strong>d improves<br />
laboratory throughput by eliminating post-measurement<br />
data m<strong>an</strong>ipulation. <strong>The</strong> 8-position cell ch<strong>an</strong>ger enables<br />
measurements to be taken without exch<strong>an</strong>ging <strong>the</strong> cells<br />
between measurements fur<strong>the</strong>r increasing <strong>the</strong> efficiency<br />
<strong>of</strong> your methods.<br />
In addition to <strong>the</strong>se<br />
<strong>of</strong>fices, <strong>The</strong>rmo Fisher<br />
Scientific maintains<br />
a network <strong>of</strong> represen -<br />
tative org<strong>an</strong>izations<br />
throughout <strong>the</strong> world.<br />
Africa-O<strong>the</strong>r<br />
+27 11 570 1840<br />
Australia<br />
+61 2 8844 9500<br />
Austria<br />
+43 1 333 50 34 0<br />
Belgium<br />
+32 2 482 30 30<br />
C<strong>an</strong>ada<br />
+1 800 530 8447<br />
China<br />
+86 10 8419 3588<br />
Denmark<br />
+45 70 23 62 60<br />
Europe-O<strong>the</strong>r<br />
+43 1 333 50 34 0<br />
Finl<strong>an</strong>d/Norway/<br />
Sweden<br />
+46 8 556 468 00<br />
Fr<strong>an</strong>ce<br />
+33 1 60 92 48 00<br />
Germ<strong>an</strong>y<br />
+49 6103 408 1014<br />
India<br />
+91 22 6742 9434<br />
Italy<br />
+39 02 950 591<br />
Jap<strong>an</strong><br />
+81 45 453 9100<br />
Latin America<br />
+1 608 276 5659<br />
Middle East<br />
+43 1 333 50 34 0<br />
Ne<strong>the</strong>rl<strong>an</strong>ds<br />
+31 76 579 55 55<br />
South Africa<br />
+27 11 570 1840<br />
Spain<br />
+34 914 845 965<br />
Switzerl<strong>an</strong>d<br />
+41 61 716 77 00<br />
UK<br />
+44 1442 233555<br />
USA<br />
+1 800 532 4752<br />
www.<strong>the</strong>rmo.com<br />
©2009 <strong>The</strong>rmo Fisher Scientific Inc. All rights reserved. All trademarks are <strong>the</strong> property <strong>of</strong> <strong>The</strong>rmo Fisher Scientific Inc. <strong>an</strong>d its subsidiaries.<br />
Specifications, terms <strong>an</strong>d pricing are subject to ch<strong>an</strong>ge. Not all products are available in all countries. Please consult your local sales representative <strong>for</strong> details.<br />
<strong>The</strong>rmo Electron Scientific<br />
Instruments LLC, Madison, WI<br />
USA is ISO Certified.<br />
AN51859_E 12/09M<br />
Part <strong>of</strong> <strong>The</strong>rmo Fisher Scientific