Analysis of Methylene Blue Reduction by Ascorbic Acid
Analysis of Methylene Blue Reduction by Ascorbic Acid
Analysis of Methylene Blue Reduction by Ascorbic Acid
- No tags were found...

Create successful ePaper yourself
Turn your PDF publications into a flip-book with our unique Google optimized e-Paper software.
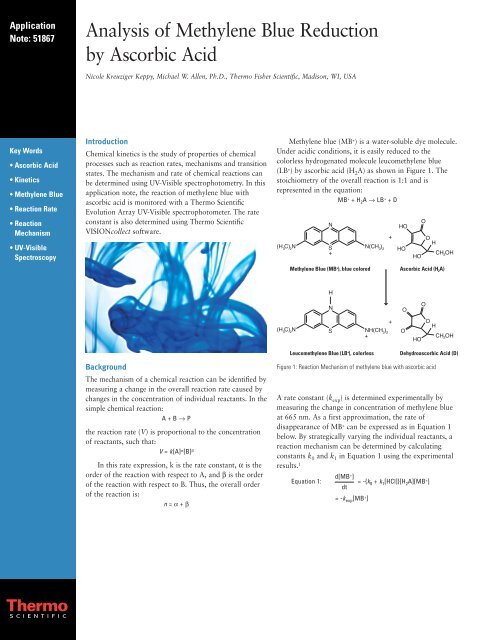
ApplicationNote: 51867<strong>Analysis</strong> <strong>of</strong> <strong>Methylene</strong> <strong>Blue</strong> <strong>Reduction</strong><strong>by</strong> <strong>Ascorbic</strong> <strong>Acid</strong>Nicole Kreuziger Keppy, Michael W. Allen, Ph.D., Thermo Fisher Scientific, Madison, WI, USAKey Words• <strong>Ascorbic</strong> <strong>Acid</strong>• Kinetics• <strong>Methylene</strong> <strong>Blue</strong>• Reaction Rate• ReactionMechanism• UV-VisibleSpectroscopyIntroductionChemical kinetics is the study <strong>of</strong> properties <strong>of</strong> chemicalprocesses such as reaction rates, mechanisms and transitionstates. The mechanism and rate <strong>of</strong> chemical reactions canbe determined using UV-Visible spectrophotometry. In thisapplication note, the reaction <strong>of</strong> methylene blue withascorbic acid is monitored with a Thermo ScientificEvolution Array UV-Visible spectrophotometer. The rateconstant is also determined using Thermo ScientificVISIONcollect s<strong>of</strong>tware.<strong>Methylene</strong> blue (MB + ) is a water-soluble dye molecule.Under acidic conditions, it is easily reduced to thecolorless hydrogenated molecule leucomethylene blue(LB + ) <strong>by</strong> ascorbic acid (H 2 A) as shown in Figure 1. Thestoichiometry <strong>of</strong> the overall reaction is 1:1 and isrepresented in the equation:MB + + H 2 A → LB + + DBackgroundThe mechanism <strong>of</strong> a chemical reaction can be identified <strong>by</strong>measuring a change in the overall reaction rate caused <strong>by</strong>changes in the concentration <strong>of</strong> individual reactants. In thesimple chemical reaction:A + B → Pthe reaction rate (V) is proportional to the concentration<strong>of</strong> reactants, such that:V = k[A] α [B] βIn this rate expression, k is the rate constant, α is theorder <strong>of</strong> the reaction with respect to A, and β is the order<strong>of</strong> the reaction with respect to B. Thus, the overall order<strong>of</strong> the reaction is:n = α + βFigure 1: Reaction Mechanism <strong>of</strong> methylene blue with ascorbic acidA rate constant (k exp ) is determined experimentally <strong>by</strong>measuring the change in concentration <strong>of</strong> methylene blueat 665 nm. As a first approximation, the rate <strong>of</strong>disappearance <strong>of</strong> MB + can be expressed as in Equation 1below. By strategically varying the individual reactants, areaction mechanism can be determined <strong>by</strong> calculatingconstants k 0 and k 1 in Equation 1 using the experimentalresults. 1d[MB + ]Equation 1: = -{k 0 + k 1 [HCl]}[H 2 A][MB + ]dt= -k exp [MB + ]
Experiment and ResultsStock solutions <strong>of</strong> methylene blue (4.0 x 10 -4 mol/L),ascorbic acid (0.5 mol/L) and hydrochloric acid (2.0 mol/L)were prepared. Fifteen sample solutions were preparedfrom these stock solutions according to the conditionsdefined in Table 1. A blank was prepared for each sample<strong>by</strong> mixing together all <strong>of</strong> the reagents in the correspondingsample except methylene blue. All measurements wereperformed immediately following the addition <strong>of</strong> methyleneblue to the sample due to the fast nature <strong>of</strong> the reaction.Time-based Kinetics mode was programmed using theparameters shown in Figure 2.<strong>Ascorbic</strong> <strong>Methylene</strong> Total RunSample # HCl (M) <strong>Acid</strong> (M) <strong>Blue</strong> (M) Time (s)Set A: Varying <strong>Methylene</strong> <strong>Blue</strong> Concentration [MB + ]A1 0.3 0.025 3.5 x 10 -5 200A2 0.3 0.025 2.5 x 10 -5 120A3 0.3 0.025 1.5 x 10 -5 120A4 0.3 0.025 9.0 x 10 -6 120A5 0.3 0.025 4.0 x 10 -6 120Set B: Varying <strong>Ascorbic</strong> <strong>Acid</strong> Concentration [H 2 A]B1 0.2 0.000 1.5 x 10 -5 600B2 0.2 0.004 1.5 x 10 -5 600B3 0.2 0.008 1.5 x 10 -5 360B4 0.2 0.016 1.5 x 10 -5 180B5 0.2 0.036 1.5 x 10 -5 120Set C: Varying Hydrochloric <strong>Acid</strong> Concentration [HCl]C1 0 0.045 1.5 x 10 -5 150C2 0.1 0.045 1.5 x 10 -5 120C3 0.2 0.045 1.5 x 10 -5 120C4 0.4 0.045 1.5 x 10 -5 120C5 0.5 0.045 1.5 x 10 -5 120Table 1: Sample preparation and experimental conditions for the analysis <strong>of</strong>methylene blue reductionFigure 2: Method parameters for methylene blue reduction analysisFigure 3: Absorbance decay <strong>of</strong> methylene blue under condition A1Sample # Start Time (s) End Time (s) K expA1 0 80 0.0616A2 0 80 0.0645A3 0 80 0.0607A4 0 80 0.0631A5 0 80 0.0619Average 0.0624B1 0 600 0.0000B2 0 450 0.0097B3 0 266 0.0172B4 0 150 0.0333B5 0 70 0.0693C1 0 150 0.0179C2 0 120 0.0454C3 0 90 0.0645C4 0 46 0.1076C5 0 36 0.1310The Relationship Between Rate Constant and <strong>Methylene</strong><strong>Blue</strong> Concentration, [MB + ] (Set A):The change in absorbance <strong>of</strong> methylene blue at 665 nm,plotted as a function <strong>of</strong> time, is shown in Figure 3. A firstorder fit <strong>of</strong> the absorbance between 0 and 80 secondswas used to determine an experimental rate constant (k exp )<strong>of</strong> 0.0616. The data collected for the remaining samples(A2-C5) shows a similar pattern and their rate constantsare shown in Table 2.Table 2: Rate calculation range and experimental rate for eachexperimental condition
One benefit <strong>of</strong> the Evolution Array is its ability tocollect the entire spectrum during kinetics experiments.The full spectrum <strong>of</strong> methylene blue can be observed <strong>by</strong>clicking the full spectrum icon in Time Based Kinetics Modein the VISIONcollect s<strong>of</strong>tware. The individual spectrafor sample A1 are shown in Figure 4. These spectra werealso used to construct the decay curve shown in Figure 3.Figure 5: Sample set B results show k exp as a function <strong>of</strong> ascorbic acidconcentrationFigure 4: Spectra <strong>of</strong> methylene blue reduction under condition A1As shown in Table 2, variations in k exp are small withrespect to methylene blue concentration. The averagevalue <strong>of</strong> k exp is approximately 0.0624. All <strong>of</strong> the measuredvalues fall within a small range <strong>of</strong> this average value anddo not exhibit a trend in variation as a result <strong>of</strong> a decreasein concentration. Thus, we can conclude that the initialconcentration <strong>of</strong> methylene blue is not a significant factorin the rate equation.The Relationship Between Rate Constant and <strong>Ascorbic</strong><strong>Acid</strong> Concentration, [H 2 A] (Set B):To determine the affect <strong>of</strong> ascorbic acid on the overallrate, the concentration <strong>of</strong> H 2 A was varied according tothe conditions defined in Set B, Table 1. A plot <strong>of</strong> k expagainst H 2 A concentration exhibits a linear relationship asshown in Figure 5. A linear fit <strong>of</strong> the data results in aslope <strong>of</strong> 1.9026 M -1 s -1 with a R 2 value <strong>of</strong> 0.9983. Theslope <strong>of</strong> this curve is the k exp and can be entered intoEquation 1:Equation 1: k 0 + k 1 [HCl] = 1.9026 M -1 s -1The concentration <strong>of</strong> HCl in this sample set is heldconstant at 0.2 M. Entering this value into the equationabove yields Equation 2:The Relationship Between Rate Constant and HClConcentration, [HCl] (Set C):In the final set <strong>of</strong> solutions, the concentration <strong>of</strong> HCl wasvaried according to Set C, Table 1. Plotting k exp againstHCl concentration illustrates the linear relationship <strong>of</strong> therate with respect to the concentration <strong>of</strong> HCl (Figure 6).The resulting linear fit has a slope <strong>of</strong> 0.2212 M -1 s -1 and aR 2 value <strong>of</strong> 0.9981. Taking the slope as the experimentalrate and substituting it into Equation 1 we find:k 1 [H 2 A] = 0.2212 M -1 s -1Entering the concentration <strong>of</strong> H 2 A (0.045 M), thevalue for k 1 is determined as follows:k 1 = 4.92 M -2 s -1Entering the value <strong>of</strong> k 1 into Equation 2, the value <strong>of</strong>k 0 is determined as follows:k 0 + (4.92 M -2 s -1 )(0.2 M) = 1.9026 M -1 s -1k 0 = 0.92 M -1 s -1Figure 6: Sample set C results show k exp as a function <strong>of</strong> HCl concentrationExperimental Rate LawThe rate law is obtained <strong>by</strong> combining the experimentalresults from sets A-C. This rate law for the oxidation <strong>of</strong>methylene blue <strong>by</strong> ascorbic acid under acidic conditions isshown in Equation 3.Equation 2: k 0 + k 1 (0.2 M) = 1.9026 M -1 s -1 d[MB + ]Equation 3: = -{0.92 + 4.92[HCl]}[H 2 A][MB + ] = -k exp [MB + ]dt
ConclusionThe analysis <strong>of</strong> methylene blue reduction <strong>by</strong> ascorbic acidis performed quickly and easily with the Evolution Arrayand VISIONcollect s<strong>of</strong>tware. In this experiment, rate datawas obtained for the analysis and rate constants weresimultaneously calculated using the kinetic analysis function<strong>of</strong> the VISIONcollect s<strong>of</strong>tware. The export function <strong>of</strong> theVISIONcollect s<strong>of</strong>tware facilitates further data processingin EXCEL ® . From this analysis it was determined that therate constant <strong>of</strong> the reaction is dependent on theconcentration <strong>of</strong> both ascorbic acid and HCl and not onthe initial concentration <strong>of</strong> methylene blue.References1. Mowry, S. and Orgen, P.J. (1999) Kinetics <strong>of</strong> <strong>Methylene</strong> <strong>Blue</strong> <strong>Reduction</strong><strong>by</strong> <strong>Ascorbic</strong> <strong>Acid</strong>, J Chem. Ed. 76(7), 970-974.In addition to these<strong>of</strong>fices, Thermo FisherScientific maintainsa network <strong>of</strong> represen -tative organizationsthroughout the world.Africa-Other+27 11 570 1840Australia+61 2 8844 9500Austria+43 1 333 50 34 0Belgium+32 53 73 42 41Canada+1 800 530 8447China+86 10 8419 3588Denmark+45 70 23 62 60Europe-Other+43 1 333 50 34 0Finland/Norway/Sweden+46 8 556 468 00France+33 1 60 92 48 00Germany+49 6103 408 1014India+91 22 6742 9434Italy+39 02 950 591Japan+81 45 453 9100Latin America+1 608 276 5659Middle East+43 1 333 50 34 0Netherlands+31 76 579 55 55South Africa+27 11 570 1840Spain+34 914 845 965Switzerland+41 61 716 77 00UK+44 1442 233555USA+1 800 532 4752www.thermo.com©2010 Thermo Fisher Scientific Inc. All rights reserved. Excel is a registered trademark <strong>of</strong> Micros<strong>of</strong>t Corporation. All other trademarks are the property <strong>of</strong> Thermo Fisher Scientific Inc. and itssubsidiaries. Specifications, terms and pricing are subject to change. Not all products are available in all countries. Please consult your local sales representative for details.Thermo Electron ScientificInstruments LLC, Madison, WIUSA is ISO Certified.AN51867_E 01/10MPart <strong>of</strong> Thermo Fisher Scientific