Analysis of Nitrate Nitrogen (NO3-) in Water by the EPA Approved ...
Analysis of Nitrate Nitrogen (NO3-) in Water by the EPA Approved ...
Analysis of Nitrate Nitrogen (NO3-) in Water by the EPA Approved ...

You also want an ePaper? Increase the reach of your titles
YUMPU automatically turns print PDFs into web optimized ePapers that Google loves.
Application<br />
Note: 51862<br />
<strong>Analysis</strong> <strong>of</strong> <strong>Nitrate</strong> <strong>Nitrogen</strong> (NO 3 - ) <strong>in</strong> <strong>Water</strong> <strong>by</strong><br />
<strong>the</strong> <strong>EPA</strong> <strong>Approved</strong> Bruc<strong>in</strong>e Method<br />
Gordon Ba<strong>in</strong>, Ph.D., Michael W. Allen, Ph.D., Nicole Kreuziger Keppy, Thermo Fisher Scientific, Madison, WI, USA<br />
Key Words<br />
• Bruc<strong>in</strong>e Method<br />
• <strong>Nitrate</strong><br />
• UV-Visible<br />
• <strong>Water</strong> <strong>Analysis</strong><br />
Introduction<br />
In this experiment quantitative analysis <strong>of</strong> nitrate nitrogen<br />
(NO - 3 ) was performed <strong>by</strong> <strong>the</strong> Bruc<strong>in</strong>e method. Data was<br />
acquired and processed us<strong>in</strong>g <strong>the</strong> Thermo Scientific<br />
Evolution Array UV-Visible spectrophotometer and<br />
Thermo Scientific VISIONcollect s<strong>of</strong>tware.<br />
Background<br />
The Bruc<strong>in</strong>e method for nitrate is approved <strong>by</strong> <strong>the</strong> United<br />
States <strong>EPA</strong> as Method No. 352.1. 1 When a water sample<br />
conta<strong>in</strong><strong>in</strong>g nitrate ion is treated with Bruc<strong>in</strong>e <strong>in</strong> sulfuric<br />
acid, a yellow solution results. The concentration <strong>of</strong><br />
nitrate nitrogen may be calculated based upon <strong>the</strong><br />
absorbance <strong>of</strong> <strong>the</strong> solution at 410 nm.<br />
Experimental<br />
Reagents and Apparatus<br />
• <strong>Nitrate</strong> ion standard solution (0.001 mg NO - 3 N/mL)<br />
• Sodium chloride solution (30% w/v)<br />
– Dissolve 30 g NaCl <strong>in</strong> 100 mL deionized water<br />
• Sulfuric acid solution (4+1)<br />
– 4:1 = Sulfuric acid (H 2 SO 4 ):deionized water<br />
– CAUTION: Wear appropriate protective cloth<strong>in</strong>g and<br />
observe proper protocols for dilut<strong>in</strong>g sulfuric acid<br />
• Bruc<strong>in</strong>e-Sulfanilic acid solution<br />
– Dissolve 1 g bruc<strong>in</strong>e dihydrate (C 23 H 26 N 2 O 4<br />
•2H 2 O) and<br />
0.1 g sulfanilic acid (H 2 NC 6 H 4 SO 3 H•H 2 O) <strong>in</strong> 3 mL conc.<br />
HCl. Dilute to 100 mL with deionized water<br />
• Evolution Array UV-Vis spectrophotometer with<br />
VISIONcollect s<strong>of</strong>tware<br />
• Cuvette (10 mm pathlength)<br />
Standards and Measurement Procedure<br />
1. Prepare a series <strong>of</strong> nitrate standards from <strong>the</strong> 0.001 mg/mL<br />
NO - 3 standard. Each <strong>of</strong> <strong>the</strong> standards should be an<br />
accurately measured volume between 1 mL and 10 mL<br />
<strong>of</strong> stock diluted to a total volume <strong>of</strong> 10.0 mL. Also<br />
prepare a 0 ppm reagent blank. Between four and six<br />
standards are generally considered to be sufficient to<br />
establish a robust calibration curve.<br />
2. Treat each standard accord<strong>in</strong>g to <strong>the</strong> procedure<br />
described <strong>in</strong> <strong>the</strong> sample work-up procedure below<br />
3. In Quantification Standard mode<br />
a. Measure <strong>the</strong> 0 ppm standard as <strong>the</strong> blank<br />
b. Measure <strong>the</strong> absorbance <strong>of</strong> <strong>the</strong> rema<strong>in</strong><strong>in</strong>g standards<br />
4. In Quantification Sample mode, measure <strong>the</strong> absorbance<br />
<strong>of</strong> <strong>the</strong> unknown sample(s) and calculate <strong>the</strong> concentration<br />
Sample Work-up Procedure<br />
1. Measure a known, consistent volume (1–5 mL is a typical<br />
range) <strong>of</strong> sample <strong>in</strong>to a calibrated tube or flask<br />
2. Dilute with deionized water to a total volume <strong>of</strong> 10 mL<br />
3. If samples are sal<strong>in</strong>e, add 2 mL sodium chloride solution<br />
4. Add 10 mL sulfuric acid solution and mix well <strong>by</strong><br />
shak<strong>in</strong>g while cool<strong>in</strong>g <strong>in</strong> flow<strong>in</strong>g water.<br />
Do not stopper <strong>the</strong> tube/flask.<br />
CAUTION: This step is exo<strong>the</strong>rmic. The contents will<br />
heat up and pressure will result <strong>in</strong>side <strong>the</strong> conta<strong>in</strong>er if<br />
it is stoppered.<br />
5. Add 0.5 mL bruc<strong>in</strong>e <strong>in</strong> sulfanilic acid solution and mix<br />
<strong>by</strong> shak<strong>in</strong>g<br />
6. Heat 25 m<strong>in</strong>utes at 100 °C <strong>in</strong> a water bath<br />
7. Cool with flow<strong>in</strong>g water, dilute to 25 mL with deionized<br />
water, stopper and <strong>in</strong>vert several times to mix thoroughly<br />
8. Pour ca. 3 mL <strong>of</strong> solution <strong>in</strong>to <strong>the</strong> 10 mm pathlength<br />
cuvette and record <strong>the</strong> absorbance us<strong>in</strong>g <strong>the</strong><br />
spectrophotometer<br />
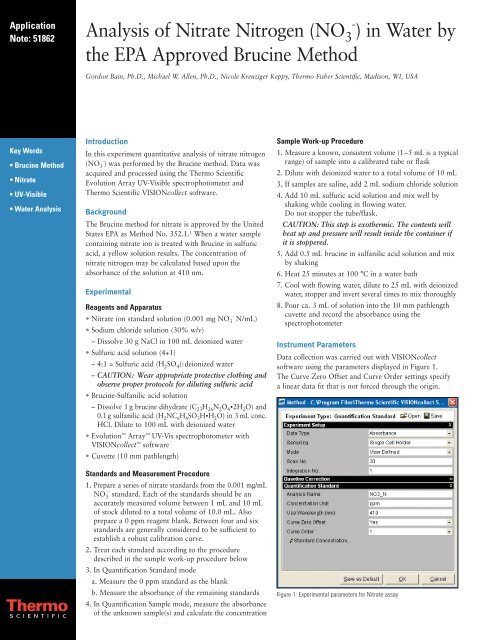
Instrument Parameters<br />
Data collection was carried out with VISIONcollect<br />
s<strong>of</strong>tware us<strong>in</strong>g <strong>the</strong> parameters displayed <strong>in</strong> Figure 1.<br />
The Curve Zero Offset and Curve Order sett<strong>in</strong>gs specify<br />
a l<strong>in</strong>ear data fit that is not forced through <strong>the</strong> orig<strong>in</strong>.<br />
Figure 1: Experimental parameters for <strong>Nitrate</strong> assay
Results<br />
Figure 2 shows <strong>the</strong> s<strong>of</strong>tware screen for <strong>the</strong> standard solution<br />
data collection. Full spectra <strong>of</strong> all standards are displayed<br />
<strong>in</strong> <strong>the</strong> Standard Spectrum w<strong>in</strong>dow (upper left). Details <strong>of</strong><br />
<strong>the</strong> standards used and <strong>the</strong>ir measured absorbance values<br />
at <strong>the</strong> analytical wavelength (410 nm) are shown at <strong>the</strong><br />
bottom <strong>of</strong> <strong>the</strong> screen and a calibration curve is plotted<br />
(upper right). The equation <strong>of</strong> <strong>the</strong> l<strong>in</strong>e <strong>of</strong> best fit is<br />
calculated <strong>by</strong> <strong>the</strong> least squares method and displayed<br />
below <strong>the</strong> Standard Spectrum.<br />
A sample conta<strong>in</strong><strong>in</strong>g an unknown amount <strong>of</strong> nitrate<br />
was prepared accord<strong>in</strong>g to <strong>the</strong> procedure and measured <strong>in</strong><br />
duplicate. The results were displayed as shown <strong>in</strong> Figure 3.<br />
The concentration <strong>of</strong> <strong>the</strong> sample was found to be 0.23 ppm.<br />
Figure 2: Standard solution data<br />
Conclusion<br />
In this experiment quantitative analysis <strong>of</strong> nitrate nitrogen<br />
(NO - 3 ) <strong>in</strong> water was successfully performed with <strong>the</strong><br />
Evolution Array spectrophotometer and VISIONcollect<br />
s<strong>of</strong>tware. Rapid acquisition <strong>of</strong> full-range spectra and<br />
excellent <strong>in</strong>strument sensitivity made <strong>the</strong> analysis quick,<br />
accurate and reproducible.<br />
References<br />
1. Electronic: http://www.epa.gov/waterscience/methods/method/files/352_1.pdf .<br />
Date acquired 12-12-2009.<br />
In addition to <strong>the</strong>se<br />
<strong>of</strong>fices, Thermo Fisher<br />
Scientific ma<strong>in</strong>ta<strong>in</strong>s<br />
a network <strong>of</strong> represen -<br />
tative organizations<br />
throughout <strong>the</strong> world.<br />
Africa-O<strong>the</strong>r<br />
+27 11 570 1840<br />
Australia<br />
+61 2 8844 9500<br />
Austria<br />
+43 1 333 50 34 0<br />
Belgium<br />
+32 2 482 30 30<br />
Canada<br />
+1 800 530 8447<br />
Ch<strong>in</strong>a<br />
+86 10 8419 3588<br />
Denmark<br />
+45 70 23 62 60<br />
Europe-O<strong>the</strong>r<br />
+43 1 333 50 34 0<br />
F<strong>in</strong>land/Norway/<br />
Sweden<br />
+46 8 556 468 00<br />
France<br />
+33 1 60 92 48 00<br />
Germany<br />
+49 6103 408 1014<br />
India<br />
+91 22 6742 9434<br />
Italy<br />
+39 02 950 591<br />
Japan<br />
+81 45 453 9100<br />
Lat<strong>in</strong> America<br />
+1 608 276 5659<br />
Middle East<br />
+43 1 333 50 34 0<br />
Ne<strong>the</strong>rlands<br />
+31 76 579 55 55<br />
South Africa<br />
+27 11 570 1840<br />
Spa<strong>in</strong><br />
+34 914 845 965<br />
Switzerland<br />
+41 61 716 77 00<br />
UK<br />
+44 1442 233555<br />
USA<br />
+1 800 532 4752<br />
www.<strong>the</strong>rmo.com<br />
Figure 3: Sample solution data<br />
©2009 Thermo Fisher Scientific Inc. All rights reserved. All trademarks are <strong>the</strong> property <strong>of</strong> Thermo Fisher Scientific Inc. and its subsidiaries.<br />
Specifications, terms and pric<strong>in</strong>g are subject to change. Not all products are available <strong>in</strong> all countries. Please consult your local sales representative for details.<br />
Thermo Electron Scientific<br />
Instruments LLC, Madison, WI<br />
USA is ISO Certified.<br />
AN51862_E 12/09M<br />
Part <strong>of</strong> Thermo Fisher Scientific