10.8 - Gene and Linda Voiland School of Chemical Engineering ...
10.8 - Gene and Linda Voiland School of Chemical Engineering ...
10.8 - Gene and Linda Voiland School of Chemical Engineering ...

Create successful ePaper yourself
Turn your PDF publications into a flip-book with our unique Google optimized e-Paper software.
ChE 450<br />
<strong>Chemical</strong> Process Design <strong>and</strong> Analysis I<br />
Fall, 2012<br />
Washington State University<br />
Voil<strong>and</strong> <strong>School</strong> <strong>of</strong> <strong>Chemical</strong> <strong>Engineering</strong><br />
<strong>and</strong> Bioengineering<br />
Richard L. Zollars<br />
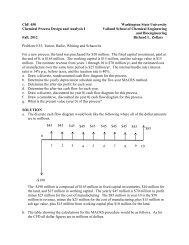
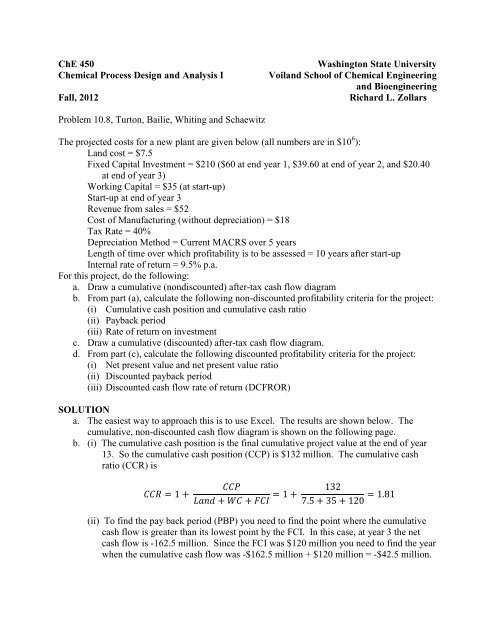
Problem <strong>10.8</strong>, Turton, Bailie, Whiting <strong>and</strong> Schaewitz<br />
The projected costs for a new plant are given below (all numbers are in $10 6 ):<br />
L<strong>and</strong> cost = $7.5<br />
Fixed Capital Investment = $210 ($60 at end year 1, $39.60 at end <strong>of</strong> year 2, <strong>and</strong> $20.40<br />
at end <strong>of</strong> year 3)<br />
Working Capital = $35 (at start-up)<br />
Start-up at end <strong>of</strong> year 3<br />
Revenue from sales = $52<br />
Cost <strong>of</strong> Manufacturing (without depreciation) = $18<br />
Tax Rate = 40%<br />
Depreciation Method = Current MACRS over 5 years<br />
Length <strong>of</strong> time over which pr<strong>of</strong>itability is to be assessed = 10 years after start-up<br />
Internal rate <strong>of</strong> return = 9.5% p.a.<br />
For this project, do the following:<br />
a. Draw a cumulative (nondiscounted) after-tax cash flow diagram<br />
b. From part (a), calculate the following non-discounted pr<strong>of</strong>itability criteria for the project:<br />
(i) Cumulative cash position <strong>and</strong> cumulative cash ratio<br />
(ii) Payback period<br />
(iii) Rate <strong>of</strong> return on investment<br />
c. Draw a cumulative (discounted) after-tax cash flow diagram.<br />
d. From part (c), calculate the following discounted pr<strong>of</strong>itability criteria for the project:<br />
(i) Net present value <strong>and</strong> net present value ratio<br />
(ii) Discounted payback period<br />
(iii) Discounted cash flow rate <strong>of</strong> return (DCFROR)<br />
SOLUTION<br />
a. The easiest way to approach this is to use Excel. The results are shown below. The<br />
cumulative, non-discounted cash flow diagram is shown on the following page.<br />
b. (i) The cumulative cash position is the final cumulative project value at the end <strong>of</strong> year<br />
13. So the cumulative cash position (CCP) is $132 million. The cumulative cash<br />
ratio (CCR) is<br />
(ii) To find the pay back period (PBP) you need to find the point where the cumulative<br />
cash flow is greater than its lowest point by the FCI. In this case, at year 3 the net<br />
cash flow is -162.5 million. Since the FCI was $120 million you need to find the year<br />
when the cumulative cash flow was -$162.5 million + $120 million = -$42.5 million.
Year L<strong>and</strong> FCI Working Revenue Deprec (DDB) Deprec (SL) Deprec (MACRS) FCI - Sum(D) Taxes Cash Flow Discounted Cum. Cash Cum. Cash Disc Interest Rate<br />
0 0 0 0 0 0 0.095<br />
0 7.5 -7.5 -7.5 -7.5 -7.5<br />
1 60 -60 -54.79452055 -67.5 -62.29452055<br />
2 39.6 -39.6 -33.0268343 -107.1 -95.32135485<br />
3 20.4 -20.4 -15.53773857 -127.5 -1<strong>10.8</strong>590934<br />
3 35 -35 -26.6578848 -162.5 -137.5169782<br />
4 34 24 24 96 4 30 20.8672288 -132.5 -116.6497494<br />
5 34 38.4 21.33333333 38.4 57.6 -1.76 35.76 22.71574131 -96.74 -93.9340081<br />
6 34 23.04 16.45714286 23.04 34.56 4.384 29.616 17.18073291 -67.124 -76.75327519<br />
7 34 13.824 13.824 13.824 20.736 8.0704 25.9296 13.73716083 -41.1944 -63.01611436<br />
8 34 13.824 13.824 6.912 8.0704 25.9296 12.54535236 -15.2648 -50.470762<br />
9 34 6.912 6.912 <strong>10.8</strong>352 23.1648 10.23532135 7.9 -40.23544065<br />
10 34 13.6 20.4 8.231689409 28.3 -32.00375124<br />
11 34 13.6 20.4 7.517524575 48.7 -24.48622666<br />
12 34 13.6 20.4 6.865319246 69.1 -17.62090742<br />
13 34 13.6 20.4 6.269697942 89.5 -11.35120948<br />
13 42.5 13.06187071 132 1.710661237
Project Value ($million)<br />
150<br />
Cumulative Non-Discounted Cash Flow<br />
100<br />
50<br />
0<br />
0 2 4 6 8 10 12 14<br />
-50<br />
-100<br />
-150<br />
-200<br />
Years
From the Excel spreadsheet the cumulative (non-discounted) cash flow at year 7<br />
is -$41.2 million. Interpolating gives year 6.95. But the start-up occurred in year 3 so<br />
the payback period is 6.95 – 3 = 3.95 years.<br />
(iii)To find the rate <strong>of</strong> return on investment (ROROI) take the slope <strong>of</strong> a straight line<br />
from the start-up cash position to the final cash position minus working capital <strong>and</strong><br />
l<strong>and</strong> (but with the salvage value, in this zero). At start-up (year 3) the cumulative<br />
cash position is -162.5 million. At the end (year 13) the cash position is $132 million<br />
minus working capital ($35million) <strong>and</strong> l<strong>and</strong> ($7.5 million). Thus the slope is<br />
( ) ( )<br />
Then<br />
c. The cumulative discounted cash flow diagram is shown on the following page.<br />
d. (i) The net present value (NPV) is read directly from the cumulative CFD as<br />
$1.71 million. The net present value ratio (NPVR) then is<br />
(ii) The discounted payback period (DPBP) is found just like the PBP except now using<br />
discounted values. The discounted FCI is 60/(1.095) + 39.6/(1.095) 2 + 20.4/(1.095) 3<br />
= $103.3 million. At start-up the discounted cash position was -137.5 million. Thus<br />
you need to find the time when the cumulative cash flow reached -137.5 + 103.3<br />
= -34.2 million. This occurred between years 9 <strong>and</strong> 10. Interpolating gives year 9.73<br />
years. The start-up was in year 3 so the DPBP is 9.73 – 3 = 6.73 years.<br />
(iii)The discounted cash flow rate <strong>of</strong> return (DCFROR) is the rate <strong>of</strong> return that gives a<br />
cumulative cash value <strong>of</strong> zero at the end <strong>of</strong> the project. Since an interest rate <strong>of</strong> 9.5%<br />
p.a. gives a positive value at the end <strong>of</strong> the project we know that the DCFROR must<br />
be higher. You could try adjusting the value <strong>of</strong> the interest rate upwards until the<br />
cumulative cash position becomes 0 or use the Solver utility in Excel. Using Solver<br />
gives a DCFROR <strong>of</strong> 9.73% p.a.
Project Value ($millions)<br />
20<br />
Cumulative Cash Flow (Discounted)<br />
0<br />
0 2 4 6 8 10 12 14<br />
-20<br />
-40<br />
-60<br />
-80<br />
-100<br />
-120<br />
-140<br />
-160<br />
Years