Russ Doerner - Controlled Fusion Atomic Data Center
Russ Doerner - Controlled Fusion Atomic Data Center
Russ Doerner - Controlled Fusion Atomic Data Center

Create successful ePaper yourself
Turn your PDF publications into a flip-book with our unique Google optimized e-Paper software.
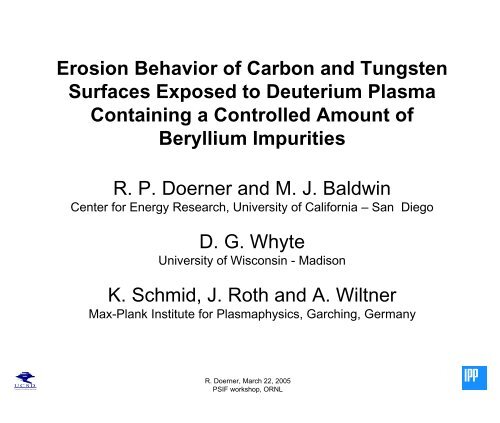
Erosion Behavior of Carbon and Tungsten<br />
Surfaces Exposed to Deuterium Plasma<br />
Containing a <strong>Controlled</strong> Amount of<br />
Beryllium Impurities<br />
R. P. <strong>Doerner</strong> and M. J. Baldwin<br />
<strong>Center</strong> for Energy Research, University of California – San Diego<br />
D. G. Whyte<br />
University of Wisconsin - Madison<br />
K. Schmid, J. Roth and A. Wiltner<br />
Max-Plank Institute for Plasmaphysics, Garching, Germany<br />
UCSD<br />
University of California San Diego<br />
R. <strong>Doerner</strong>, March 22, 2005<br />
PSIF workshop, ORNL
PISCES is a steady-state reflex arc plasma source that<br />
provides parameters relevant to edge physics and PMI<br />
issues in present and future confinement machines<br />
Sample Manipulator<br />
Surface<br />
Analysis<br />
System<br />
Confinement<br />
PISCES-B Devices<br />
Ion flux (m -2 s -1 ) 10 23 10 23<br />
Ion energy (eV)<br />
20-300 (bias) 10-300 (thermal)<br />
Target<br />
C, W, Be, Li<br />
Heat flux (MW/m 2 ) 1-10 1-10<br />
Reciprocating<br />
Double<br />
Probe<br />
Da monitor<br />
Pyrometers<br />
Axial<br />
Spectroscopic views<br />
Doppler<br />
T (eV) e<br />
2-40 (thermal) 1-100 (thermal)<br />
n (m -3 ) e<br />
10 17 -10 19 10 18 -10 20<br />
Impurity fraction (%) 0.03-10 1-10<br />
Pulse length continuous 10-30 sec<br />
Target materials C,W,Be,Li C,W,Be,etc.<br />
and coatings<br />
(essentially any)<br />
Plasma<br />
Source<br />
Plasma species H,D,He H,D,T,He<br />
UCSD<br />
University of California San Diego<br />
R. <strong>Doerner</strong>, March 22, 2005<br />
PSIF workshop, ORNL
PISCES-B, and Its Associated Surface Analysis<br />
Laboratory, Are Compatible with<br />
Beryllium Operations.<br />
- The PISCES-B plasma generator is contained<br />
in a separate enclosure to prevent release of<br />
beryllium particulates into the general lab.<br />
- The entire enclosure has a specially<br />
designed ventilation system that filters all<br />
input and output air streams.<br />
- All personnel entering the enclosure<br />
wear full coverage personal protective<br />
equipment and follow strict entry and<br />
exit procedures when performing<br />
routine maintenance, machine repair, or<br />
sample handling/exchange operations.<br />
UCSD<br />
University of California San Diego<br />
R. <strong>Doerner</strong>, March 22, 2005<br />
PSIF workshop, ORNL
US-EU Collaboration on<br />
Mixed-Material PMI Effects for ITER<br />
U.S. - R. <strong>Doerner</strong> – UCSD<br />
E.U. – A. Loarte - EFDA<br />
Three main experimental aspects:<br />
• The erosion, deuterium retention and codeposition properties of<br />
graphite exposed to a beryllium-containing deuterium plasmas<br />
• The erosion, deuterium retention and codeposition properties of<br />
tungsten exposed to deuterium plasma containing beryllium<br />
impurities (as well as with and without (in TPE) carbon impurities)<br />
• The erosion and deuterium retention behavior of beryllium<br />
exposed to deuterium plasma at temperatures approaching the<br />
Be melting temperature<br />
Verification of surface and edge plasma models:<br />
TRIDYN (IPP), ERO (KFA), WBC (ANL), UEDGE (LLNL, UCSD)<br />
UCSD<br />
University of California San Diego<br />
R. <strong>Doerner</strong>, March 22, 2005<br />
PSIF workshop, ORNL
PISCES-B linear plasma device simulates<br />
ITER diverted field line geometry<br />
UCSD<br />
University of California San Diego<br />
R. <strong>Doerner</strong>, March 22, 2005<br />
PSIF workshop, ORNL
PISCES- B has been modified to allow exposure of<br />
samples to Be seeded plasma<br />
High temperature<br />
MBE effusion cell<br />
used to seed<br />
plasma with<br />
evaporated Be<br />
12 °<br />
153 mm<br />
102 mm<br />
Beryllium<br />
impurity<br />
seeding<br />
195 mm<br />
Axial spectroscopic field of view<br />
Thermocouple<br />
Cooled target<br />
holder<br />
Target<br />
76 mm<br />
Deposition<br />
probe<br />
sample<br />
45 o<br />
PISCES-B Plasma<br />
Radial transport<br />
guard<br />
Water cooled Mo<br />
heat dump<br />
Heatable<br />
deposition probe<br />
assembly<br />
Thermocouple<br />
Resistive heating<br />
coils<br />
UCSD<br />
University of California San Diego<br />
R. <strong>Doerner</strong>, March 22, 2005<br />
PSIF workshop, ORNL
PISCES-B operation above 6 eV T e provides<br />
complete ionization of the thermal Be atom beam<br />
0.25<br />
0.20<br />
Be II Plasma concentration, new Be Oven<br />
(30.10.2002)<br />
• Be II line emission @ 467 nm is<br />
used to measure Be ion density<br />
(along with ADAS rate<br />
coefficients)<br />
Be II / n e<br />
[%]<br />
0.15<br />
0.10<br />
0.05<br />
0.00<br />
Te 3eV, T Be<br />
= 1450 °C, n e<br />
= 3E12 cm -3<br />
Te 7eV, T Be<br />
= 1450 °C, n e<br />
= 3E12 cm -3<br />
Te 20eV, T Be<br />
= 1450 °C, n e<br />
= 2E12 cm -3<br />
Te 16eV, T Be<br />
= 1550 °C, n e<br />
= 2E12 cm -3<br />
Te 6eV, T Be<br />
= 1550 °C, n e<br />
= 3E12 cm -3<br />
0 50 100 150 200<br />
Distance from Target [mm]<br />
Be oven<br />
location<br />
• Be oven temperature controls<br />
Be ion density in the plasma<br />
• Be concentration is fairly<br />
constant along the plasma<br />
column<br />
UCSD<br />
University of California San Diego<br />
R. <strong>Doerner</strong>, March 22, 2005<br />
PSIF workshop, ORNL
Results from experimental tasks #1 & #2<br />
Task 1<br />
• The erosion, deuterium retention and codeposition<br />
properties of graphite exposed to a beryllium-containing<br />
deuterium plasmas<br />
Task 2<br />
• The erosion, deuterium retention and codeposition<br />
properties of tungsten exposed to deuterium plasma<br />
containing beryllium impurities (as well as with and<br />
without (in TPE) carbon impurities)<br />
Task 3<br />
• The erosion and deuterium retention behavior of<br />
beryllium exposed to deuterium plasma at temperatures<br />
approaching the Be melting temperature<br />
UCSD<br />
University of California San Diego<br />
R. <strong>Doerner</strong>, March 22, 2005<br />
PSIF workshop, ORNL
A small beryllium impurity concentration in the<br />
plasma drastically suppresses carbon erosion<br />
-50 V bias, 200ºC, T e<br />
= 8 eV, n e<br />
= 3 e 12 cm -3<br />
4000<br />
Chemical erosion<br />
Physical sputtering<br />
3500<br />
3000<br />
CD band<br />
No Be injection<br />
0.2% Be ion concentration<br />
2.4 10 4<br />
No Be injection<br />
0.2% Be ion concentration<br />
2500<br />
D gamma<br />
Be I<br />
2.8 10 4 400 450 500 550 600<br />
2 10 4<br />
2000<br />
1500<br />
1000<br />
500<br />
1.6 10 4<br />
1.2 10 4<br />
8000<br />
4000<br />
C I<br />
200 400 600 800 1000<br />
pixel number<br />
pixel number<br />
UCSD<br />
University of California San Diego<br />
R. <strong>Doerner</strong>, March 22, 2005<br />
PSIF workshop, ORNL
Be rich surface layers form during exposure<br />
and shield underlying carbon from erosion<br />
T surface = 700ºC T surface = 800ºC<br />
100<br />
100<br />
80<br />
80<br />
60<br />
60<br />
40<br />
40<br />
20<br />
T surface ~ 250C<br />
T surface ~ 700C<br />
20<br />
T surface ~ 900C<br />
T surface ~ 1000C<br />
0<br />
0 0.05 0.1 0.15 0.2 0.25 0.3 0.35<br />
Be plasma concentration (%)<br />
0<br />
0 0.1 0.2 0.3 0.4 0.5<br />
Be plasma concentration (%)<br />
• Be surface concentration after 5000 sec. P-B exposure.<br />
• ITER will have 1-10% Be impurity concentration in the<br />
divertor plasma<br />
UCSD<br />
University of California San Diego<br />
R. <strong>Doerner</strong>, March 22, 2005<br />
PSIF workshop, ORNL
Be layer formation effectively eliminates<br />
erosion from carbon substrate<br />
CD band intensity<br />
(i.e. chemical erosion)<br />
decreases With increasing<br />
Weight loss data<br />
confirms reduction in<br />
erosion seen spectroscopically<br />
Be concentration in the plasma<br />
100<br />
CD-Band intensity [%]<br />
80<br />
60<br />
40<br />
20<br />
CD-Band intensity [%]<br />
Linear Fit: CD = 100.0 - 580.6 * C Be<br />
0<br />
0.00 0.05 0.10 0.15<br />
Be plasma concentration [%]<br />
Normalized weightloss [10 -26 mg m 2 ]<br />
Weight loss (mg/cm 2 )<br />
0<br />
-10<br />
-20<br />
-30<br />
Bias: 50V<br />
~500K<br />
No Be<br />
Be seeding<br />
~1000K<br />
No Be<br />
Be seeding<br />
0.00 0.05 0.10 0.15 0.20<br />
Be 1+ plasma concentration [%]<br />
Decreasing erosion<br />
UCSD<br />
University of California San Diego<br />
R. <strong>Doerner</strong>, March 22, 2005<br />
PSIF workshop, ORNL
Be layer forms on C targets with a complicated<br />
three dimensional structure<br />
~0.1 % Be seeding<br />
∆m = - 5 mg<br />
AES - 85 % Be,<br />
10% O & 5% C<br />
ATJ graphite<br />
Not exposed<br />
No Be seeding<br />
∆m = - 62 mg<br />
Plasma<br />
conditions:<br />
Γ D<br />
~3x10 18 cm -2 s -1 , T e<br />
~ 6eV, n e<br />
~ 10 12 cm -3 , T ~500 K, D Ion Fluence ~2x10 22 cm -2<br />
UCSD<br />
University of California San Diego<br />
R. <strong>Doerner</strong>, March 22, 2005<br />
PSIF workshop, ORNL
Do we understand why these Be layers form?<br />
In equilibrium:<br />
Deposition Rate of Be = Removal Rate of Be<br />
Be Deposition Rate = f Be<br />
Γ pl<br />
(1 – R f<br />
)<br />
~0 for Be on C<br />
where, f Be<br />
= plasma Be concentration, Γ pl<br />
= plasma flux, R f<br />
= reflection coefficient<br />
Be Removal Rate = c Be<br />
Y Be<br />
Γ pl<br />
(1-R d<br />
)<br />
where, c Be<br />
= Be surface concentration, Y Be<br />
= sputtering yield of Be due to 50 eV<br />
deuterium ions (=0.02), R d<br />
= redeposition fraction (~20% from WBC simulation)<br />
So the equilibrium surface concentration of Be, c Be<br />
, should be:<br />
c Be<br />
= f Be<br />
/ Y Be<br />
(1-R d<br />
) = 0.001 / 0.02(1-0.2) = ~ 6%<br />
Beryllium-carbide formation may be responsible for erosion suppression.<br />
If Be 2<br />
C surface layer, then Y = 0.002 (from TRIMSP) and<br />
c Be<br />
= f Be<br />
/ Y Be2C<br />
(1-R d<br />
) = 0.001 / 0.002(1-0.2) = ~ 60%<br />
UCSD<br />
University of California San Diego<br />
R. <strong>Doerner</strong>, March 22, 2005<br />
PSIF workshop, ORNL
*<br />
*<br />
*<br />
* Be oven became depleted during exposure<br />
UCSD<br />
University of California San Diego<br />
R. <strong>Doerner</strong>, March 22, 2005<br />
PSIF workshop, ORNL
WPM samples show collection of beryllium<br />
rich deposits during Be seeding runs<br />
<strong>Data</strong> from IPP-Garching sputter XPS system<br />
100<br />
profile, WPMTA01<br />
300ºC target exposure<br />
100<br />
700ºC target exposure<br />
composition (%)<br />
90<br />
80<br />
70<br />
60<br />
50<br />
40<br />
30<br />
Be%<br />
C%<br />
O%<br />
Ta%<br />
90<br />
80<br />
70<br />
60<br />
50<br />
40<br />
30<br />
<strong>Atomic</strong> %<br />
100<br />
90<br />
80<br />
70<br />
60<br />
50<br />
40<br />
30<br />
Be%<br />
C%<br />
O%<br />
Ta-%<br />
20<br />
20<br />
20<br />
10<br />
10<br />
10<br />
0<br />
0 5000 10000 15000 20000 25000 30000 35000 40000 45000<br />
0<br />
0<br />
Be seeding on<br />
time (s)<br />
Plasma setup<br />
C sample, No Be<br />
Ta<br />
substrate<br />
0 20 40 60 80 100 120<br />
Fluence [cm -2 ]<br />
Be seeding on<br />
Plasma on<br />
Ta<br />
substrate<br />
UCSD<br />
University of California San Diego<br />
R. <strong>Doerner</strong>, March 22, 2005<br />
PSIF workshop, ORNL
T retained in Be rich codeposits can be more<br />
easily removed during divertor bakeout<br />
D/Be in codeposits (at. %)<br />
1 10 100<br />
Baldwin et al.<br />
PSI-16 Maine USA (2004)<br />
J. Nucl. Mater. (accepted)<br />
50 o C (O ~ 3 at. %)<br />
ITER bake<br />
150 o C (O ~ 30 at. %)<br />
Co-deposited a:CH layer<br />
Causey et al. J. Nucl.<br />
Mater. 176-7 (1990) 987<br />
300 o C (O ~ 33 at. %)<br />
1 10 100<br />
H/C in codeposits (at. %)<br />
• Although more hydrogen<br />
isotopes are retained during<br />
lower temperature<br />
codeposition, they are more<br />
easily desorbed<br />
• ITER can bake divertor to<br />
375°C (after coolant drain)<br />
• Codeposits will be in line-ofsight<br />
of erosion location<br />
200 400 600 800 1000<br />
• Oxygen bake may not be<br />
Temperature ( o C)<br />
needed<br />
UCSD<br />
University of California San Diego<br />
R. <strong>Doerner</strong>, March 22, 2005<br />
PSIF workshop, ORNL
Be impurities from the ITER first wall can also form<br />
Be-rich surfaces on the tungsten baffle plates.<br />
• Be layers have been observed<br />
on on W surfaces, as well as C<br />
Surface composition of a W target<br />
exposed to a Be seeded deuterium<br />
plasma in PISCES-B<br />
• Plasma exposure conditions<br />
– Be conc. ~0.1%<br />
100<br />
– E ion<br />
~ 75 eV<br />
90<br />
– T W<br />
~ 300°C<br />
– Ion flux ~ 1x10 22 m -2 s -1<br />
– Exposure time = 5000 sec.<br />
• Estimated Be layer thickness<br />
on W is 10 nm<br />
Composition (at. %)<br />
80<br />
70<br />
60<br />
50<br />
40<br />
30<br />
20<br />
Be (at %)<br />
O (at %)<br />
W (at %)<br />
10<br />
• Surface has 12 times as much<br />
Be as W<br />
0<br />
0 5 10 15 20<br />
Sputtering Time (min)<br />
0 10 20 30 40<br />
Estimated Thickness (nm)<br />
50 60<br />
UCSD<br />
University of California San Diego<br />
R. <strong>Doerner</strong>, March 22, 2005<br />
PSIF workshop, ORNL
Be on W should be even less likely to form<br />
Be surface layers.<br />
Again, in equilibrium:<br />
Deposition Rate of Be = Removal Rate of Be<br />
Be Deposition Rate = f Be<br />
Γ pl<br />
(1 – R f<br />
)<br />
where, R f<br />
= reflection coefficient is now R f<br />
~ 0.6 (for Be on W)<br />
Be Removal Rate = c Be<br />
Y Be<br />
Γ pl<br />
(1-R d<br />
)<br />
Now, Y Be<br />
= 0.026 for 75 eV D ions on Be<br />
So the equilibrium surface concentration of Be on W, c Be-W<br />
, should be:<br />
c Be-W<br />
= f Be<br />
(1-R f<br />
)/ Y Be<br />
(1-R d<br />
) = 0.001(1-0.6) / 0.026(1-0.2) = ~ 2%<br />
Are tungsten beryllides (i.e. Be x<br />
W) responsible?<br />
UCSD<br />
University of California San Diego<br />
R. <strong>Doerner</strong>, March 22, 2005<br />
PSIF workshop, ORNL
What will be the result of Be layers on<br />
plasma exposed W surfaces?<br />
• Be can alloy with W<br />
• Resulting alloys (Be W 22<br />
and Be W) have lower<br />
12<br />
melting temperatures<br />
(~1500°C)<br />
• Should ITER/JET be<br />
concerned about these<br />
alloys? (Ongoing research)<br />
From H. Okamoto and L.E. Tanner, in “Phase Diagrams of<br />
Binary Tungsten Alloys”, Ed. S.V. Naidu and P. Rao,Indian<br />
Institute of Metals, Calcutta, 1991.<br />
UCSD<br />
University of California San Diego<br />
R. <strong>Doerner</strong>, March 22, 2005<br />
PSIF workshop, ORNL
If alloy formation (carbide or beryllide) is responsible for Be<br />
layers, then subsequent Be deposition should be quickly<br />
re-eroded. Be alloy layers should be thin.<br />
C sample, 175°C, f Be<br />
~0.15%<br />
W sample (AES data)<br />
f Be<br />
= 0.1%, 5000 sec., T W<br />
= 300°C<br />
100<br />
90<br />
Composition (at. %)<br />
80<br />
70<br />
60<br />
50<br />
40<br />
30<br />
20<br />
10<br />
0<br />
Be (at %)<br />
O (at %)<br />
W (at %)<br />
0 5 10 15 20<br />
Sputtering Time (min)<br />
0 10 20 30 40<br />
Estimated Thickness (nm)<br />
50 60<br />
UCSD<br />
University of California San Diego<br />
R. <strong>Doerner</strong>, March 22, 2005<br />
PSIF workshop, ORNL
The dynamic behavior of the Be layer may help<br />
decipher the mechanism responsible for<br />
surface layer formation.<br />
1.6<br />
• At PISCES-B conditions:<br />
f ~ 0.001<br />
Be<br />
Γ = 3e18 cm -2 s -1<br />
pl<br />
Γ = 3e15 Be/cm 2 s<br />
Be<br />
or 1 Be monolayer/sec<br />
CD/Dg<br />
1.4<br />
1.2<br />
1.0<br />
0.8<br />
0.6<br />
0.4<br />
0.2<br />
0 50 100 150 200<br />
Distance from Target [mm]<br />
Discharge time [s]<br />
1940<br />
2670<br />
3500<br />
4100<br />
7050<br />
For 50 eV Be on C the stopping<br />
distance is only ~0.5nm, or<br />
~2-3 monolayers<br />
Erosion suppression (i.e. CD<br />
band decrease) takes much<br />
longer<br />
Upstream Be conc. (%)<br />
1<br />
0.1<br />
UCSD<br />
University of California San Diego<br />
R. <strong>Doerner</strong>, March 22, 2005<br />
PSIF workshop, ORNL<br />
0.01<br />
10 1 10 2 10 3 10 4<br />
CD Band strength e-folding time (s)
US-EU Collaboration on Be/C/W has produced<br />
significant new results, but more work is needed.<br />
• Understand mechanism responsible for Be-rich layer<br />
formation at very low impurity Be concentration (~0.1%)<br />
• Develop a model that can predict the dynamic behavior<br />
of the Be coating process<br />
• Investigate concurrent Be and C injection into D plasma<br />
• Investigate similarities and differences of W & C targets<br />
• W-Be alloy formation is a critical issue needing<br />
immediate attention (melting temperature, thermal<br />
properties, formation rates, tritium retention, etc.)<br />
UCSD<br />
University of California San Diego<br />
R. <strong>Doerner</strong>, March 22, 2005<br />
PSIF workshop, ORNL
Be impurities may dominate PMI<br />
(specifically tritium accumulation) in<br />
devices with large area Be walls<br />
• Need to predict first wall erosion rates (CX, diffusion,<br />
blob transport, ELMs, …)<br />
• Understanding SOL flows in confinement devices is<br />
crucial to predicting divertor impurity content and<br />
likelihood of layer growth<br />
• Subject layers to ELM style heat pulses during formation<br />
• Investigate role of other impurities (i.e. oxygen, Ne, Ar)<br />
UCSD<br />
University of California San Diego<br />
R. <strong>Doerner</strong>, March 22, 2005<br />
PSIF workshop, ORNL


![Mixed-mode Calculations within the Nuclear Shell Model [pdf]](https://img.yumpu.com/28265410/1/190x146/mixed-mode-calculations-within-the-nuclear-shell-model-pdf.jpg?quality=85)