IESO 2009 Annual Report - Independent Electricity System Operator
IESO 2009 Annual Report - Independent Electricity System Operator
IESO 2009 Annual Report - Independent Electricity System Operator

You also want an ePaper? Increase the reach of your titles
YUMPU automatically turns print PDFs into web optimized ePapers that Google loves.
<strong>IESO</strong> <strong>2009</strong> ANNUAL REPORT<br />
Market Comparisons<br />
The <strong>IESO</strong> regularly benchmarks compensation to similar positions in Canadian industry. The comparator<br />
employers are segmented into government and non-government categories. Market compensation data is<br />
gathered for each segment. A 50/50 weighting is applied to each of the government and non-government<br />
market results to reflect an overall comparator market for executive compensation at the <strong>IESO</strong>. When<br />
comparing the compensation of the <strong>IESO</strong> executives to this overall market, care is taken to assess<br />
positions of similar size, scope and complexity.<br />
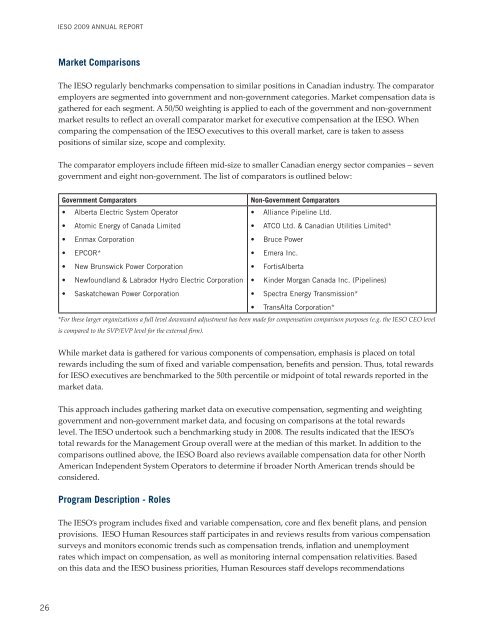
The comparator employers include fifteen mid-size to smaller Canadian energy sector companies – seven<br />
government and eight non-government. The list of comparators is outlined below:<br />
Government Comparators<br />
Non-Government Comparators<br />
• Alberta Electric <strong>System</strong> <strong>Operator</strong><br />
• Alliance Pipeline Ltd.<br />
• Atomic Energy of Canada Limited<br />
• ATCO Ltd. & Canadian Utilities Limited*<br />
• Enmax Corporation<br />
• Bruce Power<br />
• EPCOR*<br />
• Emera Inc.<br />
• New Brunswick Power Corporation<br />
• FortisAlberta<br />
• Newfoundland & Labrador Hydro Electric Corporation • Kinder Morgan Canada Inc. (Pipelines)<br />
• Saskatchewan Power Corporation<br />
• Spectra Energy Transmission*<br />
• TransAlta Corporation*<br />
*For these larger organizations a full level downward adjustment has been made for compensation comparison purposes (e.g. the <strong>IESO</strong> CEO level<br />
is compared to the SVP/EVP level for the external firm).<br />
While market data is gathered for various components of compensation, emphasis is placed on total<br />
rewards including the sum of fixed and variable compensation, benefits and pension. Thus, total rewards<br />
for <strong>IESO</strong> executives are benchmarked to the 50th percentile or midpoint of total rewards reported in the<br />
market data.<br />
This approach includes gathering market data on executive compensation, segmenting and weighting<br />
government and non-government market data, and focusing on comparisons at the total rewards<br />
level. The <strong>IESO</strong> undertook such a benchmarking study in 2008. The results indicated that the <strong>IESO</strong>’s<br />
total rewards for the Management Group overall were at the median of this market. In addition to the<br />
comparisons outlined above, the <strong>IESO</strong> Board also reviews available compensation data for other North<br />
American <strong>Independent</strong> <strong>System</strong> <strong>Operator</strong>s to determine if broader North American trends should be<br />
considered.<br />
Program Description - Roles<br />
The <strong>IESO</strong>’s program includes fixed and variable compensation, core and flex benefit plans, and pension<br />
provisions. <strong>IESO</strong> Human Resources staff participates in and reviews results from various compensation<br />
surveys and monitors economic trends such as compensation trends, inflation and unemployment<br />
rates which impact on compensation, as well as monitoring internal compensation relativities. Based<br />
on this data and the <strong>IESO</strong> business priorities, Human Resources staff develops recommendations<br />
26